Original Article
, Volume: 17( 1) DOI: 10.37532/0972-768X.2019.17(1).301Waste Chemicals and Solvents âÃâ¬Ãâ Profiling and Recovery at Academic Chemical Laboratories
- *Correspondence:
- Elzagheid MI
Department of Chemical and Process Engineering Technology
Education and Training Affairs Jubail Industrial College, Jubail Industrial City
Saudi Arabia
Tel: +966133425428
E-mail: elzagheid_m@jic.edu.sa
Received: February 03, 2019; Accepted: February 18, 2019; Published: February 20, 2019
Citation: Hanifa MR, Elzagheid MI. Waste Chemicals and Solvents – Profiling and Recovery at Academic Chemical Laboratories. Int J Chem Sci. 2019;17(1):301
Abstract
Accumulation of waste chemicals and solvents in college and university level laboratories are considerably high and cost effective. The disposal of those waste chemicals and solvents now-a-days need long procedures for separation and testing and this is very costly. A simple and cost-effective profile analysis method and recovery of solvents procedure will be very useful for any academic institution and this kind of straight forward procedure can even be assigned to college students where they will gain real time analysis experience and knowledge. In this manuscript, simple qualitative tests and precipitation procedures are described and standard physical property analysis methods are also used to identify the recovered organic solvents and the inorganic waste. Using a separatory funnel waste chemical were separated into organic and inorganic layers and stored in separate containers. Simple distillation was then carried out first to separate the lighter components faster and then fractional distillation was used to separate each component efficiently and purely. Pure fractions were further checked by the refractometer and density meter and the unknown separated components were compared with reference compounds. In addition to that, the inorganic waste was further investigated by flame photometer and the presence of barium, sodium and potassium in the inorganic waste was confirmed in the samples.
Keywords
Waste chemicals and solvents-profiling and recovery; Waste chemical mixture; Waste separation; Inorganic waste treatment; Organic solid waste; Distillate analysis
Introduction
Any substance or by-product arising from the application of or in the course of any chemical process can be considered as chemical waste. This may cause pollution or present a risk to health or pollution to the environment. Chemical wastes can be in the forms of liquid, semi-solid and solid wastes. Improper disposal of chemical waste has very serious impact on health and environment. Release into coastal waters causes damage to local marine life and creates a serious health hazard to the community. Uncontrolled disposal at proper waste facilities and into sewerage systems and sewage treatment facilities threatens the health and safety of the operatives. Recycling [1] is a better choice and may take several different forms. This can be done by returning chemicals that are found kept in labelled factory-sealed containers to the original supplier, or by donation to public/academic institutions that may have a legitimate need for them or by transformation into products for which there is a legitimate use.
Oil refineries produce polluted waste waters, containing chemical oxygen demand (COD) and biochemical oxygen demand (BOD) levels with many other pollutants including suspended matter [2]. According to the nature of the refinery waste water pollutants, combination of the treatment methods often applied before discharging. The treatment processes include the removal of the above-mentioned substances using clarification which is commonly accompanied by coagulation, flocculation, and sedimentation [3].
Many industries are associated with environmental pollution. Among those industries are the Leather industries. They produce a potentially toxic wastewater having a mixture of organic and inorganic pollutants [4]. Although many environment protection agencies have listed certain chemicals as hazardous and prevented their use in leather industry; many of them are still used and released in wastewater. The migration of brines from hydraulic fracture and conventional shale gas wells into drinking water or surface spills may have great threat and potential impacts on human health. Organic chemicals and branched alkanes that present in those wells have potential toxicity to multiple human organs [5].
Proper professional handling of chemical waste is very important issue. At the same time, improper handling of chemical waste may lead to critical harm to personal safety and institutional assets. So standard safety protocol is a must and should be followed in all chemical labs in any academic institution. In many institutions’ regulations mishandling of chemical substances can result in legal action and heavy fines. Some chemicals and items that one can casually discard at ones’ home are considered hazardous chemicals at academic institutions. Each academic staff must follow set guidelines for disposal of chemical waste and many hazards laboratory chemical disposal guides are available [6,7]. A useful document has been compiled to explain how operations concerning chemical waste will be handled at Eastern Kentucky University [8]. This document presents guidelines on how to handle the chemical waste at university premises. Those include an appropriate container with appropriate size should be chosen which has a compatible material for the chemical waste being collected for disposal. The amount of chemicals should be limited to the smallest quantity needed for project or even for the experiment or the lab session if possible. Chemical waste containers should be labelled and handled with caution and must be clearly marked with complete chemical information and each container should be kept closed except when adding more waste to the container. The types of the chemicals should be segregated into: Ignitable/ flammable-corrosive-oxidizer-non-chlorinated solvents-chlorinated solvents-irritant.
Another useful guide [9] was presented by Environmental Protection Department in Hong Kong. The aim of this guide is to have legislative controls over the management of chemical waste in Hong Kong and this apply to the possession, storage, collection, transport and disposal of chemical waste. Sansone also reported on how to Manage Hazardous Chemical Waste in Research Institutions [10]. Unknown (may be Hazardous) chemicals should not be poured down to the drain. Unknown waste materials must be considered as hazardous waste until testing is performed. A detailed procedure on waste management can be found in the laboratory chemical waste management guidelines published by environmental health and radiation safety, university of Pennsylvania [11]. Typically; the identity of unknown/unlabeled chemicals should be confirmed by laboratory analysis. Testing is very important if chemicals are opened, labels are missing and/or the original manufacturer’s seals are damaged.
Educational and industrial chemical laboratories produce considerable amount of waste chemicals in their day to day business [12]. Disposal of these waste chemicals are not easy now-a-days and is considerably cost effective. Generally, laboratories in educational institutions do not produce highly toxic or extremely dangerous waste chemicals like Arsenic, Antimony etc. But, accumulation of waste chemicals in these organizations is not well organized like industries. As these waste chemicals are produced by students during their laboratory sessions, they are not well segregated based on the chemical nature and accumulated together both organic and inorganic waste. Collecting and disposing of these waste chemicals are generally refused by companies who do incineration as these organizations do not maintain authenticated waste profile data.
The chemical waste produced by teaching and research in academic institutions and its environmental impact has been of great concern and discussion. Ashbrook and Reinhardt [13] stressed the need to implement a practice for the treatment of chemical waste in academic institutions as they contribute to the generation of small quantities of waste, many of them highly toxic.
The main idea of this work is to propose a simple and costless method to recycle the solvents and reduce the cost of disposal of inorganic wastes. Our chemical waste is not that big compared to large universities and chemical-petrochemical companies see TABLE 1 but handling this chemical waste in a proper way saves our time and money.
| Waste Type | Average annual consumption | Chemicals/Solvents in the waste |
|---|---|---|
| Organic waste | 250 litres | Ethanol |
| Methanol | ||
| Acetone | ||
| Hexane | ||
| Dichloromethane | ||
| Propanol | ||
| 2-propanol | ||
| Octanol | ||
| Iso-butanol | ||
| Toluene | ||
| Amino acids | ||
| Aniline | ||
| Petroleum products | ||
| Vegetable oils | ||
| Inorganic waste | 150 litres | Acids: Hydrochloric acid, Sulfuric acid, Phosphoric acid, Acetic acid |
| Bases: Sodium hydroxide, Potassium hydroxide, Sodium Carbonate, Sodium bicarbonate, Calcium hydroxide, Barium Hydroxide, Acetic anhydride, Ammonia | ||
| Salts: Sodium salts, Potassium salts, Calcium salts, Copper salts, Aluminum salts, Iron salts, Magnesium salts, Manganese salts |
Table 1. List of waste chemicals accumulate in the industrial chemistry laboratory at Jubail Industrial College.
Materials and Methods
Equipment and Apparatus: Heating mantle, thermometer, simple distillation setup, fractional column, glass beads-beakers, glass rod, reagent bottles, vials, flame refractometer, and density meter.
Separation of organic and inorganic waste
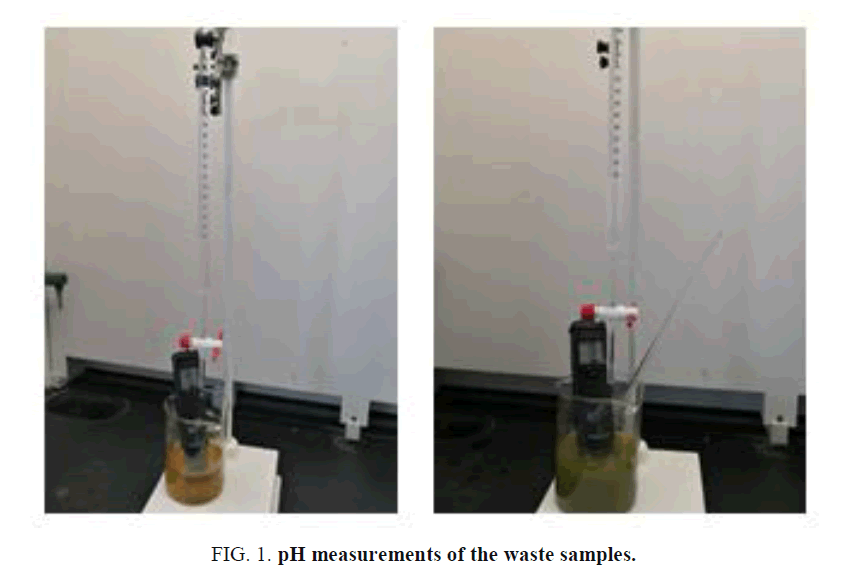
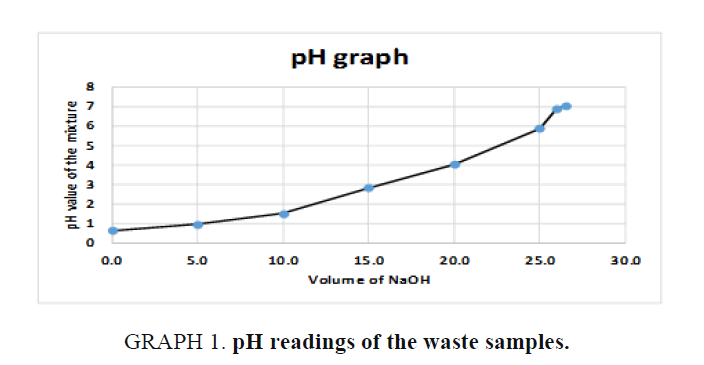
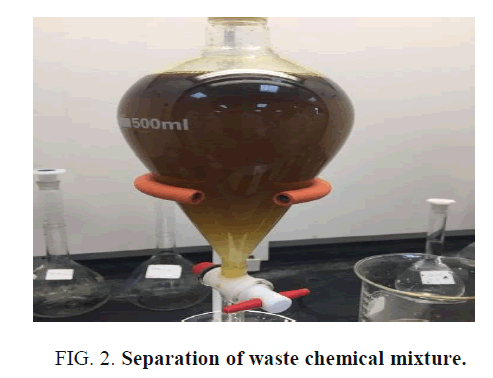
Using a separatory funnel, a 500 ml of waste chemicals were separated into organic and inorganic layers and stored in separate containers. Small volumes (5 ml each) from both layers were tested with pH paper and those were found to be acidic. Then small aliquots of both organic and inorganic layers were tested with 0.1M Sodium Hydroxide solution and they both formed two layers. Both separated layers were then treated with enough 0.1M NaOH slowly until the pH reached to almost neutral as shown in FIG 1, GRAPH 1, and TABLE 2. Resultant solutions were separated using the separatory funnel again as shown in FIG 2.
FIG. 1. pH measurements of the waste samples.
GRAPH 1. pH readings of the waste samples.
| Volume of 0.1 M NaOH in ml | Volume of the waste sample in ml | Total Volume in ml | pH of the final mixture measured by pH meter |
|---|---|---|---|
| 0.0 | 100 | 100.0 | 0.63 |
| 5.0 | 100 | 105.0 | 0.95 |
| 10.0 | 100 | 110.0 | 1.51 |
| 15.0 | 100 | 115.0 | 2.82 |
| 20.0 | 100 | 120.0 | 4.02 |
| 25.0 | 100 | 125.0 | 5.88 |
| 26.0 | 100 | 126.0 | 6.9 |
| 26.5 | 100 | 126.5 | 7.02 |
Table 2. pH readings of the waste samples.
FIG. 2. Separation of waste chemical mixture.
Distillation process to recycle and analyze the organic waste
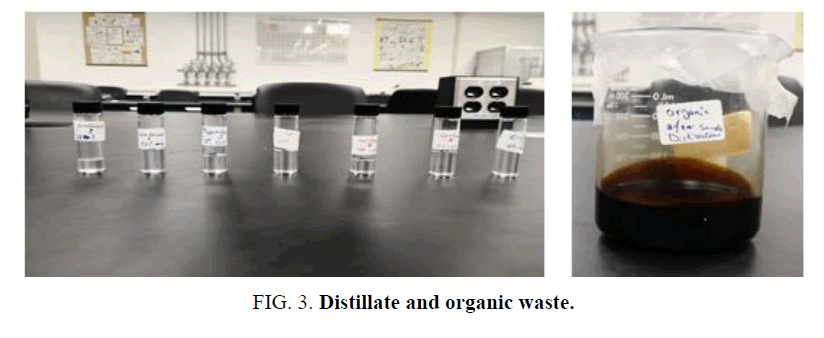
Simple distillation [14,15] was carried out first to separate the lighter components faster and then fractional distillation [16] was carried out to separate each component efficiently and purely. After the fractional distillation, components’ fractions were separated (5-10 ml) and labeled as 1-6 and fraction 7 was ignored because the temperature range was large. Their boiling points were recorded as shown in TABLE 3. At the end of the process, 7% of the waste was oily and the boiling point of the remaining fraction was above 270°C (FIG 3).
| Component | Boiling point (°C) | Component | Boiling point (°C) |
|---|---|---|---|
| 1 | 38-42 | 4 | 68-73 |
| 2 | 52-59 | 5 | 75-80 |
| 3 | 62-64 | 6 | 92-99 |
Table 3. Boiling points of separated components from the organic waste.
Fractions were further checked by the refractometer shown in FIG 4 to measure their refractive indices as described below.
The illuminating prism was opened, the face of the two prisms were cleaned by distilled water, then the collected samples were added, two drops on the surface of refracting prism, and the upper prism well was closed. The knob was rotated until the image was completely halved i.e., the sin X clearly at the middle between lower dark end upper light. The readings of the components were then taken and shown in TABLE 4.
| Components | Refractive Index | Components | Refractive Index |
|---|---|---|---|
| 1 | 1.43021 | 4 | 1.33550 |
| 2 | 1.36119 | 5 | 1.35170 |
| 3 | 1.33045 | 6 | 1.39281 |
Table 4. Refractive index of separated components.
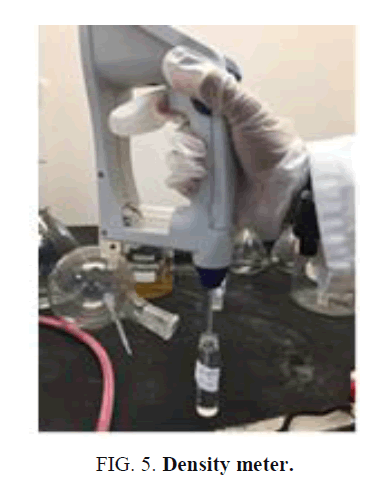
Samples 1-6 were further checked by the density meter, shown in FIG 5, after the calibration with standard sample. The density of collected samples (2 ml each) was measured and results are shown in TABLE 5.
| Component | Density (g/ml) | Component | Density (g/ml) |
|---|---|---|---|
| 1 | 1.251 | 4 | 0.6991 |
| 2 | 0.8522 | 5 | 0.7798 |
| 3 | 0.8583 | 6 | 0.8260 |
Table 5. Density of separated components.
The boiling points, density and refractive index analysis of the components 1, 2, 3, 4, 5, and 6 of the organic waste distillates were done. Based on the above analysis and by the comparison with available references the organic waste was strongly assumed to contain the following solvents: dichloromethane, acetone, methanol, hexane, ethanol, propanol as shown in detail in TABLE 6. These results were also double checked with the laboratory log book for the solvents that have been consumed by different experiments in the industrial chemistry laboratories.
| Component | Boiling point (°C) | Density (g/ml) | Refractive index | Reference value with compound |
|---|---|---|---|---|
| 1 | 38-42 | 1.251 | 1.43021 | Dichloromethane BP=39.8°C D=1.327 g/mole RI=1.4242 |
| 2 | 52-59 | 0.8522 | 1.36119 | Acetone BP=56.3°C D=0.790 g/mole RI=1.3587 |
| 3 | 62-64 | 0.8583 | 1.33045 | Methanol BP=64.7°C D=0.7913 g/mole RI=1.3284 |
| 4 | 68-73 | 0.6991 | 1.3355 | Hexane BP=68.7°C D=0.659 g/mole RI=1.3749 |
| 5 | 75-80 | 0.7798 | 1.3517 | Ethanol BP=78.3°C D=0.7894 g/mole RI=1.3614 |
| 6 | 92-99 | 0.826 | 1.3928 | Propanol BP=97.2°C D=0.804 g/mole RI=1.3856 |
Table 6. Comparison of the unknown separated components with reference compounds.
Inorganic waste investigation
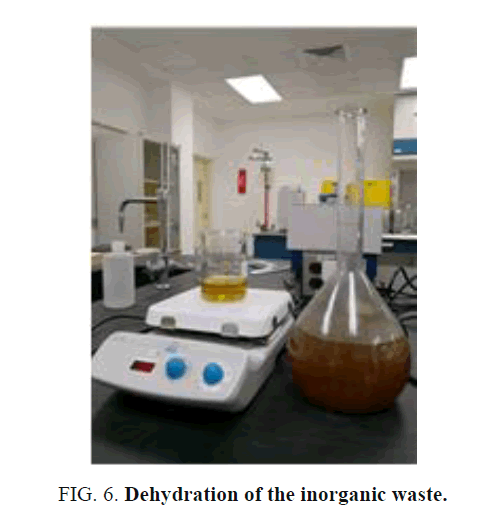
Total solids (TS) [17], total suspended solids (TSS) [18] and the total dissolved solids [18] (TDS) were used to further investigate the inorganic waste as followings: an empty beaker weight was measured. 100 ml of inorganic waste was added to the beaker, and then the weight of beaker with sample was measured. The inorganic waste was filtrated with filter paper. The filter paper with sample was dried and then weighed and this was the TSS. The filtrate solution was taken in a beaker and heated on hotplate for dehydration until the whole aqua evaporated to give the TDS as shown in FIG 6.
The balanced precipitate was dried in an oven at 115°C. The beaker with dry precipitate mass was measured. The Total dissolved solids and the total suspended solids were calculated as following:
Mass of dry filter paper=0.4462 g
Mass of filter paper with total suspended solids=1.2213
Total suspended solids (TSS)=1.2213g – 0.4462 g = 0.7751 g
Mass of empty beaker=50.0887 g
Mass of beaker with total dissolved solids=59.8188 g
Mass of total dissolved solids (TDS)=59.8188–50.0887=9.7304 g
Total Solid (TS)=Total Dissolved Solid (TDS) + Total Suspended Solid (TSS) = 0.7751 + 9.7304=10.5055 g (10.5055g/100 mL=10505.5 mg/0.1L=105055 ppm)
The inorganic waste was further investigated by photoelectric flame photometry [19] which is usually used for inorganic chemical analysis to determine the concentration of certain metal ions such as sodium, potassium, barium, lithium, and calcium. The species (metal ions) used in the spectrum are in the form of atoms.
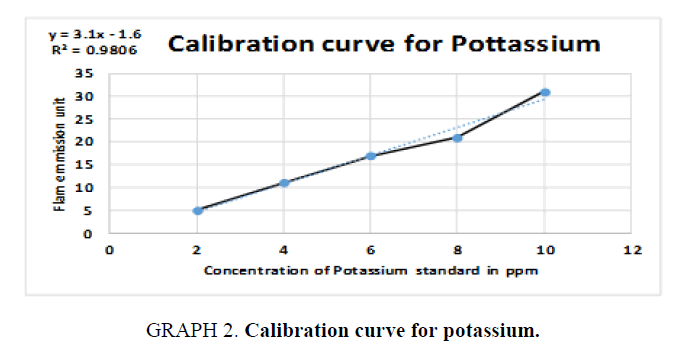
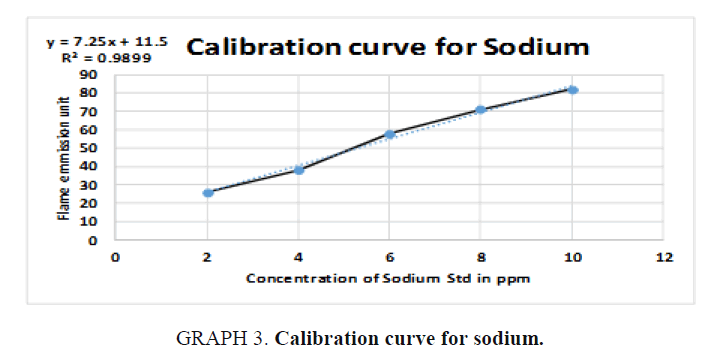
Therefore, standards of the five elements (sodium, potassium, barium, calcium, and lithium) were prepared in different concentrations (ppm) based on the top standard of each element stated in the of flame photometry catalog. The gas cylinder was opened, and the flame photometry was switched on. A small beaker (50 ml) was filled with distilled water and the reading was set to zero. The injector tube was put in each volumetric flask and the standards (25 ml) and diluted unknowns (25 ml) were measured and the readings were taken for the five elements. The calibration carves were drawn and the unknown concentrations were calculated.
For Potassium (K):
y = 3.1x – 1.6  15 = 3.1x – 1.6
  15 +1.6 = 3.1x

 , Total dilution = 4×100 = 400 times, x=5.355 × 400=2.142 ppm of K,
(TABLE 7).
| STD | Concentration (ppm) | Flame photometry emission unit |
|---|---|---|
| 1 | 2 | 5 |
| 2 | 4 | 11 |
| 3 | 6 | 17 |
| 4 | 8 | 21 |
| 5 | 10 | 31 |
| Unknown | 5.355 | 15 |
Table 7. Readings for Potassium (K).
For Sodium (Na):
y = 7.25x + 11.5  73 = 7.25x + 11.5
  73- 11.5 = 7.25x

 , From the diluted (100 times) was pipetted 10 ml and diluted in 100 ml, Dilution
factor=100/10=10 times, x=8.483 × 1000=8483 ppm of Na (TABLE 8).
| STD | Concentration (ppm) | Flame photometry emission unit |
|---|---|---|
| 1 | 2 | 26 |
| 2 | 4 | 38 |
| 3 | 6 | 58 |
| 4 | 8 | 71 |
| 5 | 10 | 82 |
| Unknown | 8.483 | 73 |
Table 8. Readings for Sodium (Na).
For Barium (Ba):
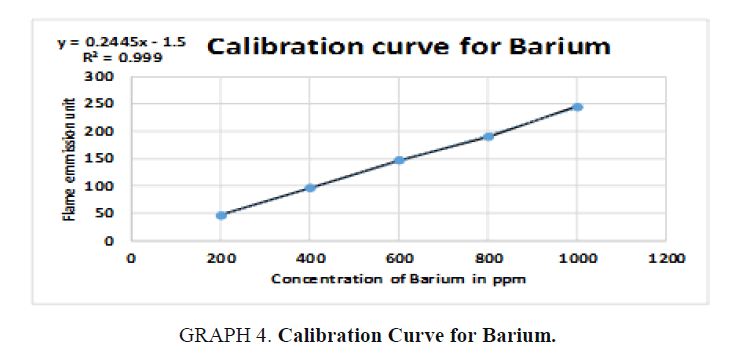
y = 0.24x – 2  50 = 0.24x – 2
  50 + 2 = 0.24x

Dilution factor = 250 / 10 = 25 times, x = 216.667 × 25 = 5416.675 ppm of Ba, (TABLE 9).
| STD | Concentration (ppm) | Flame photometry emission unit |
|---|---|---|
| 1 | 200 | 47 |
| 2 | 400 | 97 |
| 3 | 600 | 147 |
| 4 | 800 | 190 |
| 5 | 1000 | 245 |
| Unknown | 216.667 | 50 |
Table 9. Readings for Barium (Ba).
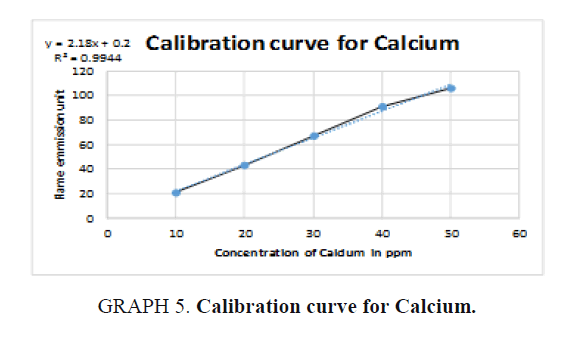
For Calcium (Ca): The unknown reading is zero because no calcium was detected in the sample (TABLE 10).
| STD | Concentration (ppm) | Flame photometry emission unit |
|---|---|---|
| 1 | 10 | 21 |
| 2 | 20 | 43 |
| 3 | 30 | 67 |
| 4 | 40 | 91 |
| 5 | 50 | 106 |
| Unknown | 0 | 0 |
Table 10. Readings for Calcium (Ca).
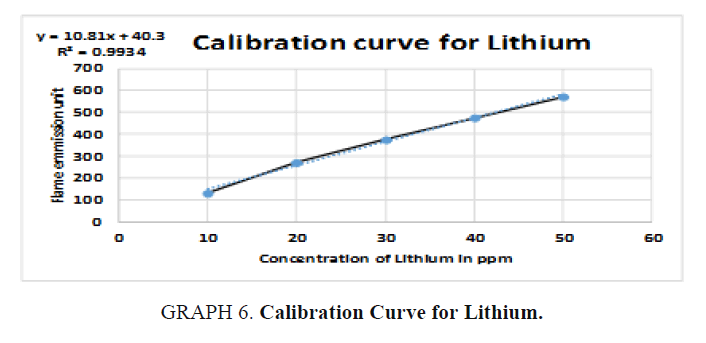
For Lithium (Li): The unknown reading is zero because no lithium was detected in the sample (TABLE 11).
| STD | Concentration (ppm) | Flame photometry emission unit |
|---|---|---|
| 1 | 10 | 131 |
| 2 | 20 | 272 |
| 3 | 30 | 375 |
| 4 | 40 | 475 |
| 5 | 50 | 570 |
| Unknown | 0 | 0 |
Table 11. Readings for Lithium (Li).
Strategies used to minimize chemical waste
In order to minimize the chemical waste in our lab we used the following practices:
➢ Excellent chemicals’ inventory is maintained. Only finished and urgently required chemicals are purchased.
➢ All used bottles are carefully labeled, dated and kept in good and suitable climate to maximize the use of those chemicals before disposal.
➢ Old ordered chemicals are used first.
➢ Solvents that can be recycled are reused again.
➢ Organic solvents are segregated into halo and non-halo.
➢ Acids and alkaline waste are kept in separate containers.
➢ Generated waste chemicals that cannot be recycled are sent for disposal immediately to avoid waste accumulation.
Benefits of this work
The use and implementation of this lab scale chemical waste treatment and recovery can achieve the following:
➢ Decrease the cost of chemicals disposal.
➢ Decrease the lab waste stream volume.
➢ Decrease operations and scheduling problems.
➢ Decrease accumulation and storage constraints.
➢ Increase the Recycling opportunity.
Conclusion
Simple qualitative tests and precipitation procedures were used above to separate organic waste from inorganic waste chemicals in the chemical waste mixture. Standard physical property analysis methods were also used to identify the recovered organic solvents and the inorganic elements. The presence of dichloromethane, acetone, ethanol, methanol, and hexane solvents in the organic waste was confirmed by boiling point, density, and refractive index methods. In addition to that, the presence of barium, sodium and potassium in the inorganic waste was detected by flame photometer. Calcium and lithium were not detected in the samples.
Acknowledgement
Authors of this article thank Jubail Industrial College (JIC) management team for encouragement and continuous support.
References
- Mann C. Guidelines for the safe handling and disposal of chemical used in the illicit manufacture of drugs. Laboratory and scientific section. New York, USA. 2006.
- El-Kareish GM, Hafez AI, Tera FM, et al. Improving Petroleum Industrial Waste Water Quality Using Cationic Modified Rice Starch. Int J Chem Sci. 2018;16(4):287.
- Rajendran R, Balachandra S, Sudha S, et al. Natural coagulants: An alternative to conventional method of water purification. Intern J Pharm Res and Biosci. 2013;2:306-14.
- Saxena G, Chandra R, Bharagava RN. Environmental pollution, toxicity profile and treatment approaches for tannery waste water and its chemical pollutants. Rev Environ Contam Toxicol. 2017; 240: 31-69.
- Crosby LM, Tatu CA, Varonka M, et al. Toxicological and chemical studies of wastewater from hydraulic fracture and conventional shale gas wells. Environ Toxicol Chem. 2018;37(8):2098-111.
- Armour MA. Hazardous Laboratory Chemicals Disposal Guide. Lewis Publishers CRC Press Company Boca Raton London New York Washington D.C., USA, 2003.
- Stricoff RS, Walters DB. Handbook of Laboratory Health and Safety. John Wiley & Sons. (2nd ed).1995.
- College of Arts and Science at Eastern Kentucky University. Chemical Waste Handling Guide for the Year, 2007.
- A guide to the chemical waste control. Environmental Protection Department Hong Kong. 2016.
- Sansone EB. Management of Hazardous Chemical Waste in Research Institutions: Proceedings of the NIH Research Safety Symposium Washington D.C., USA, 1981.
- Laboratory Chemical Waste Management Guidelines. Environmental Health & Radiation Safety. University of Pennsylvania, USA, 2018.
- Nascimento ES, Filho AT. Chemical waste risk reduction and environmental impact generated by laboratory activities in research and teaching institutions. Brazilian J Pharma Sci. 2010;46(2):187-98.
- Ashbrook PC, Reinhardt PA. Hazardous wastes in academia. Environ Sci Technol. 1985;19:1150-5.
- Allchin FR. "India: The Ancient Home of Distillation?” Man. 1979;14(1):55-63.
- Forbes RJ. A short history of the art of distillation from the beginnings up to the Death of Cellier Blumenthal. BRILL. 1970.
- Harwood LM, Moody CJ. Experimental organic chemistry: Principles and practice (Illustrated Ed.). Oxford: Blackwell Scientific Publications, UK. 1989.
- Zakaria MS. Determination of Total Solids (TS), Suspended Solids (SS) and Volatile Suspended Solids (VSS), CMT 565 course, water and wastewater technology, universiti Teknolgi Mara. 2017.
- Kagalwala F. At https://www.quora.com/What-is-the-difference-between-DS-TSS-in-a-water-system. 2017.
- Vlab.amrita.edu. Flame Photometry. 2012. vlab.amrita.edu/?sub=2&brch= 193&sim= 1351 & cnt=1. (Accessed 28 January 2019).
