Original Article
, Volume: 16( 15)Validated UV Spectroscopic Methods for Determination of Enzalutamide in Pure and Pharmaceutical Dosage Form
Zamir GK, Shwetal SP, Prashant KD and Praveen OP*
Department of Quality Assurance, H.R. Patel Institute of Pharmaceutical Education & Research, Karwand Naka, Shirpur, Maharashtra, India
- *Correspondence:
- Praveen OP, Department of Pharmaceutical Chemistry H.R. Patel Institute of Pharmaceutical Education & Research, Karwand Naka, Shirpur, Dhule 425405, Maharashtra, India, E-mail: rxpatilpravin@yahoo.co.in
Received: June 23, 2016; Accepted: July 18, 2016; Published: August 02, 2016
Citation: Zamir GK, Shwetal SP, Prashant KD, et al. Validated UV Spectroscopic Methods for Determination of Enzalutamide in Pure and Pharmaceutical Dosage Form. Anal Chem Ind J. 2016;16(15):111.
Abstract
Two simple, rapid, precise and novel spectrophotometric methods have been developed for the determination of Enzalutamide (EZA) in pure and pharmaceutical dosage form. A novel, non-steroidal antiandrogen agent EZA used in the treatment of metastatic castration resistant prostate cancer. No single UV spectrophotometric method is reported for estimation of EZA. Present study focused on the development of simple spectrophotometric method (Method I) based on the determination of EZA at 236 nm and area under curve (AUC) spectrophotometric method (Method II) involved determination of AUC in between 220.0 nm to 255.0 nm. The drug follows Beer-Lambert’s law in concentration range of 3 μg/mL to 15 μg/mL in solvent methanol (r2=0.999). The methods were validated according to ICH guidelines for accuracy, precision, sensitivity and ruggedness. There was no significant difference between performance of the proposed methods regarding mean values and standard deviation. The percent relative standard deviation was not more than 2%. The proposed method is suitable for routine quality control.
Keywords
Enzalutamide; UV spectroscopic methods; Area under curve; Method validation
Abbreviations
UV: Ultra Violet; EZA: Enzalutamide; AUC: Area Under Curve; Conc.: Concentrations; LOD: Limit of Detection; LOQ: Limit of Quantification; % RSD: Percent Relative Standard Deviation
Introduction
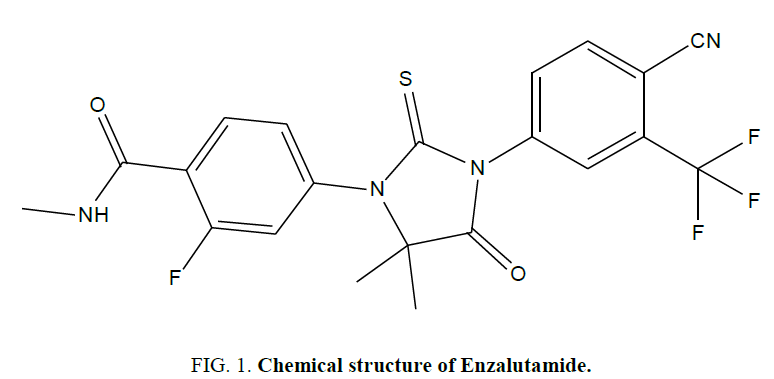
Enzalutamide is chemically, 4-{3-[4-cyano-3-(trifluromethyl) phenyl]-5,5-dimethyl-4-oxo-2-thioxoimidazolidin-1-yl}-2-fluoro-N-methylbenzamide (Figure 1) [1]. The therapeutic indication of EZA is treatment of adult men for metastatic castration resistant prostate cancer, who have received docetaxel therapy [2]. The malignant transformation of prostate epithelial tissue is due to altered pattern of gene expression by androgen receptor (AR) [3]. EZA is non-steroidal androgen inhibitor, acts by binding to the ligand-binding domain (LBD) of AR and diminished nuclear translocation, DNA binding and recruitment of AR co-activators also, suppress prostate cancer cell growth by activating the TGF-β pathway [4,5].
As the literature review suggested no single analytical method is reported for estimation of EZA by using UV spectroscopy. Fewer chromatographic, bio analytical methods involved determination of drug in human plasma by LC-MS/MS [6] and in rat plasma by LC- tandem MS are reported [7]. So, the aim of present work is to develop simple and AUC method for the estimation of EZA in bulk and in pharmaceutical formulation by using UV spectroscopy and validation of method according to ICH guidelines [8,9].
In the present work, methods involve use of spectroscopy as effective because of its simplicity, specificity and low cost.
Material and Methods
Chemicals and reagents
A gift sample of EZA was kindly provided by Zydus Cadila Ahmadabad, India; Pharmaceutical formulation of EZA (40 mg) soft capsule was formulated by in house preparation; Methanol (HPLC grade) was purchased from Merck (India) Ltd. Mumbai, India.
Instrumentation
UV – visible spectrophotometer; Double beam UV– Spectrophotometer (Shimadzu–1700) with 10 mm match quartz cell and UV probe-2.21software; Weighing balance: Shimadzu Aux 220.
Selection of solvent
Methanol was selected as solvent on the basis of solubility, stability and cost.
Preparation of standard solution
Stock standard solution of EZA was prepared by dissolving 10 mg in methanol in 100 ml volumetric flask and volume was made up to the mark with same to produced final concentration of 100 μg/mL.
Simple UV spectroscopic method (METHOD-I)
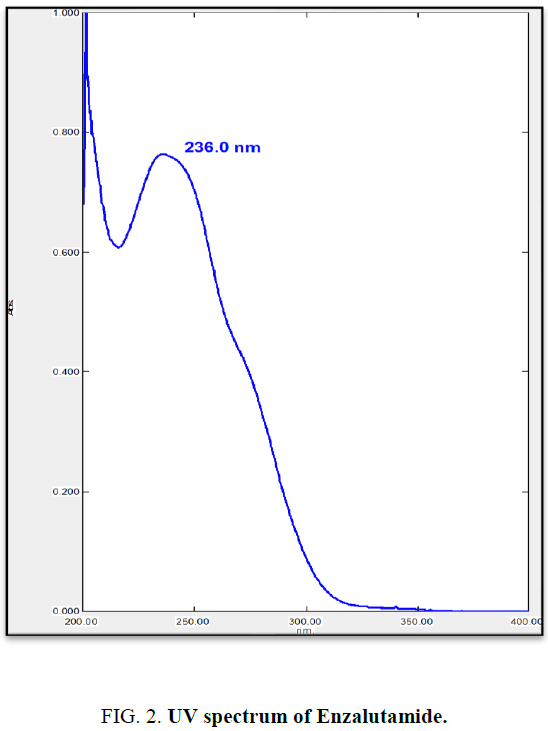
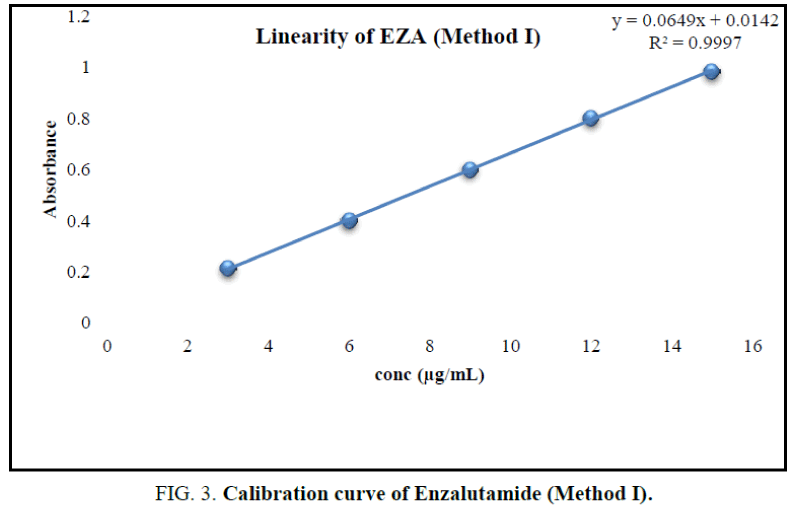
From stock solution aliquot was diluted to produce appropriate dilution. The solution was scanned in the UV range 200 nm to 400 nm against methanol as reagent blank. EZA has shown maximum absorption at 236 nm (Figure 2). Hence, this wavelength was selected for further experimentation. The linearity range was found to be 3 μg/mL to 15 μg/mL (Table 1). For the determination of linearity, concentrations in the range 3 μg/mL to 15 μg/mL were prepared and absorbance were measured at 236 nm. The calibration curve was plotted using concentration against absorbance (Figure 3) [10].
| Parameter | Method I | Method II |
|---|---|---|
| Linearity (µg/mL) | 3-15 | 3-15 |
| Linearity equation | y=0.0649x+0.0142 | y=0.1701x+0.1576 |
| Slope | 0.0649 | 0.1701 |
| Intercept | 0.0142 | 0.1576 |
| Correlation coefficient(r2) | 0.9997 | 0.9994 |
Table 1. Results of linearity study.
Area under curve (AUC) method (Method-II)
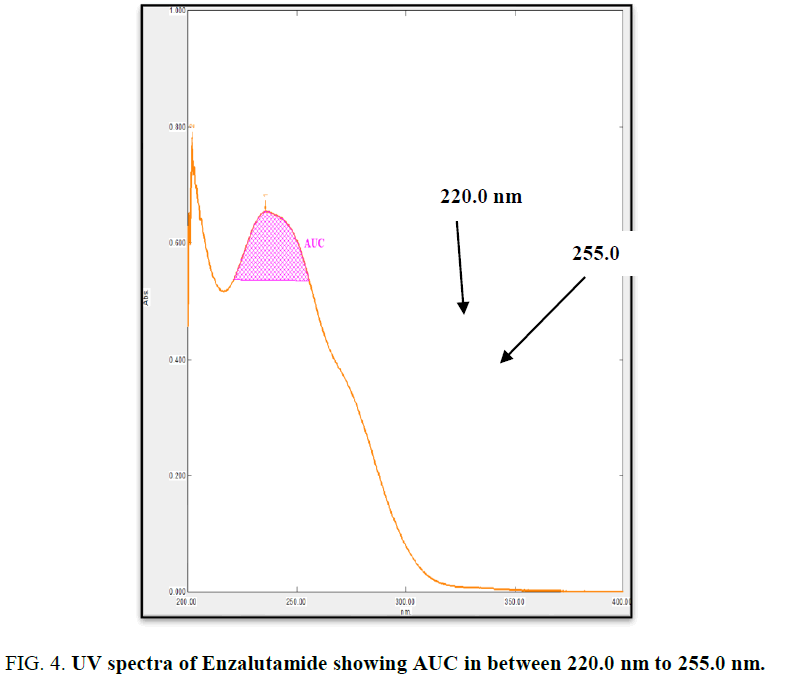
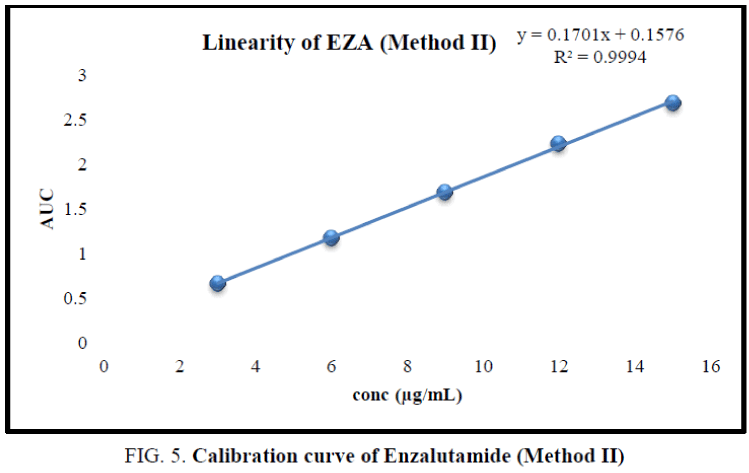
The working standard solution of 10 μg/mL was scanned in the UV range 200 nm to 400 nm. EZA has shown maximum absorbance at 236 nm. Two wavelengths 220 nm to 255 nm were selected to record area under curve (Figure 4). For the determination of linearity concentrations in the range 3 μg/mL to 15 μg/mL were prepared and AUC were determined by analyzing all concentrations in between 220.0 nm to 255.0 nm. The calibration curve was plotted using concentration against AUC (Figure 5).
Analysis of bulk material and pharmaceutical formulation
From the standard stock solution, working standard was prepared to produce 10 μg/mL & absorbance and AUC was measured at 236 nm and in between 220.0 nm to 255.0 nm. The concentration of EZA was determined (Table 2) by using equation:
| Method I | % Amount found, µg/mL (n=6) | %RSD | Method II | % Amount found, µg/mL (n=6) | %RSD |
|---|---|---|---|---|---|
| Bulk | 100.9 | 0.69 | Bulk | 99.8 | 0.11 |
| Formulation | 98.17 | 0.67 | Formulation | 99.4 | 0.002 |
Table 2. Results of analysis of bulk drug and pharmaceutical formulation.
y=mx+c (1)
Where, y is absorbance or AUC of standard solution, x is found concentration in 10 μg/mL solution, m and c are slope and intercept of line respectively.
The percent drug content was determined by using equation:
% drug content=[found conc.(μg/mL)/actual conc.(μg/mL)] × 100 (2)
Percentage recovery studies
To assess the accuracy of the proposed method, recovery study was carried out at three different levels i.e., 80, 100 and 120%. To the pre analyzed sample solution a known amount of standard drug solution was added at three different levels. The percent recovery found was satisfactory (Table 3).
| Level of recovery (%) | Amount of drug added (µg/mL) | Recovery % n=3 | |
|---|---|---|---|
| Method I | Method II | ||
| 80 | 4 | 99.36 | 98.36 |
| 100 | 5 | 100.10 | 99.86 |
| 120 | 6 | 98.20 | 99.35 |
Table 3. Results of recovery studies.
Precision
Precision of the method was studied as repeatability, intra-day and inter day precision. Repeatability was determined by analysing EZA (10 μg/mL) for six times (Table 4).
| Drug | Method | Amount found (µg/mL) (n=6) | % RSD |
|---|---|---|---|
| EZA | I | 99.50 | 0.10 |
| II | 99.81 | 0.41 |
Table 4. Results of Repeatability.
Intraday precision was determined by analyzing the 5, 10, 15 μg/mL of EZA for three times in a same day. Inter day precision was determined by analyzing the same concentrations of the solutions at three different days (Table 5).
| % RSD (n=3) | Method I | Method II | ||
|---|---|---|---|---|
| Interday | Intraday | Interday | Intraday | |
| 1.18 | 0.51 | 0.33 | 0.23 | |
Table 5. Results of inter day and intraday precision.
Sensitivity
Sensitivity of the proposed method was estimated in terms of LOD (Limit of Detection) which is the lowest amount of analyte to be detected and LOQ (Limit of Quantification) which is the lowest amount of analyte which can be measured (Table 6).
| Parameter | Method I | Method II |
|---|---|---|
| LOD | 1.29 | 0.22 |
| LOQ | 4.32 | 0.67 |
Table 6. Sensitivity.
Ruggedness
Ruggedness of the developed methods was determined by analysis of aliquots from homogenous slot by two analysts keeping same operational and environmental conditions (Table 7).
| EZA | Analyst | Method (n=6) | |
|---|---|---|---|
| I | II | ||
| % RSD | I | 0.33 | 0.08 |
| II | 0.29 | 0.15 | |
Table 7. Ruggedness.
Results and Discussion
In the experimental studies, UV and AUC spectra for EZA were recorded at 236.0 nm and 220.0 nm to 255.0 nm respectively (Figure 2 and 4). The drug follows linear relationship in 3 μg/mL to 15 μg/mL for both methods showing regression equations of calibration curves, y=0.0649x+0.0142 (R2=0.9997) for method I (Figure 3) and y=0.1701x+0.1576 (R2=0.9994) for method II (Figure 5). Both pure drug and pharmaceutical formulation analyzed and it was found that the percentage of drug content for method I 100.9% in bulk and 98.17% in formulation and for method II 99.73 % and 99.48% in bulk drug and formulation respectively (Table 2). The methods have been validated according to ICH guidelines and results were compared statistically. Accuracy was carried out by addition of standard drug solution at three different levels of sample solution and percentage of recovery was calculated and it ranges from 98.20% to 100.10% and 98.36% to 99.86% for method I and II respectively (Table 3). Precision was determined in terms of repeatability, intraday and inter day analysis shows variation not more than 2 (% RSD) (Tables 4 and 5). The sensitivity shows minimum amount to be measured and detected that was LOD and LOQ 1.29 and 4.32 for method I and 0.22 and 0.67 for method II respectively (Table 6). Proposed methods were unaffected due to change in operator and results were interpreted by calculating the % RSD value and found to be within range (Table 7).
Conclusion
It has been concluded that there has not been any spectrophotometric method developed so far for the estimation of EZA. Therefore, this novel approach has been described to develop simple, fast and reliable UV spectroscopic and area under curve method for the routine determination of EZA. The developed methods can be concluded as accurate, sensitive and precise and can be easily applied to quality control for routine analysis.
Acknowledgement
The authors are thankful to H.R. Patel Institute of Pharmaceutical Education and Research, Shirpur (MS), India for providing facilities to carry out this research work.
References
- Ashraf G. Heterologous expression of stress-responsive DUF538 domain containing protein and its morpho-biochemical consequences. Plant J. 2011;30(5):351-8.
- Takahashi S, Yoshikawa M, Kamada A, et al. The photoconvertible water-soluble chlorophyll-binding protein of Chenopodium album is a member of DUF538, a superfamily that distributes in Embryophyta. J Plant Physiol. 2013;170(17):1549-52.
- Ashraf G, Kohnehrouz SB.Identification ofDUF538cDNA clone from Celosia cristata expressed sequences of nonstressed and stressed leaves. RussJPlant Physiol. 2010;57(2):247-52.
- Nakagami H, Sugiyama N, Mochida K, et al. Large-scale comparative phosphoproteomics identifies conserved phosphorylation sites in plants. Plant Physiol. 2010;153(3):1161-74.
- Ashraf G, Kohnehrouz SB. ProtJ.2013;32:163.
- Ashraf G.Prediction of tertiary structure homology between bactericidal/permeability increasing protein of innate immune system and hydrolase enzymes. IntJBiosci. 2014;5(2):1-6.
- Ausubel FM, Brent R, Kingston RE, Moore DD, Seiolman JG, Smith JA, et al. Current Protocols in Molecular Biology. New York: John Wiley & Sons; 1991.
- Livak KJ, Schmittgen TD. Analysis of relative gene expression data using real-time quantitative PCR and the 2−ΔΔCT method. Methods. 2001;25(4):402-8.
- Rabbani MA, Maruyama M, Abe H, et al. Monitoring expression profiles of rice genes under cold, drought, and high-salinity stresses and abscisic acid application using cDNA microarray and RNA gel-blot analyses. Plant physiol. 2003;133(4):1755-67.
- Shinozaki K, Yamaguchi SK, Seki M, et al. Regulatory network of gene expression in the drought and cold stress responses.CurrOpinPlant Biol. 2003;6(5):410-7.
- Shinozaki K, Yamaguchi SK. Gene networks involved in drought stress response and tolerance. JExpBot. 2007;58(2):221-7.
- Yamaguchi SK, Shinozaki K. Organization of cis-acting regulatory elements in osmotic- and cold-stress-responsive promoters. Trends Plant Sci. 2005;10(2):88-94.
- Bartels D, Sunkars R. Drought and Salt Tolerance in Plants. CritRevPlant Sci. 2005;24(1):23-58.
- Seki M, Narusaka M, Abe H, et al. Monitoring the expression pattern of 1300 Arabidopsis genes under drought and cold stresses by using a full-length cDNA microarray. Plant Cell. 2001;13(1):61-72.
- Schimid M, Davison TS, Hens SR, et al. A gene expression map of Arabidopsis thaliana development. NatGenet. 2005;37(5):501-6.
