Original Article
, Volume: 12( 2)Talc Beneficiation Using Column Flotation
- *Correspondence:
- Murty MSN
Department of Chemical Engineering, GVPCOE (A)
Visakhapatnam-530048, India
Tel: +91-9440347614
E-mail: msnmurty@gvpce.ac.in
Received: August 17, 2017; Accepted: September 11, 2017; Published: September 15, 2017
Citation: Divya LJ, Sateesh KP, Murty MSN, et al. Talc Benificiation Using Column Flotation. Chem Technol Ind J. 2017;12(2):115
Abstract
Investigations have been carried out on the possibilities to improve talc quality by using flotation and determination of the optimum values of operating variables such as depressant dosage, frother dosage and solid concentration. Studies were focused to obtain good quality talc from mineral ore samples. Pine oil was used as frother and sodium hexametaphosphate was chosen as depressant. Optimum quantities of frother, depressant and feed concentrations were arrived at initially. Both continuous and batch column flotation studies were conducted. The actual ore contained 45 to 50 percent of talc. Recovery was good with the final product consisting about 90 percent of talc.
Keywords
Beneficiation; Talc; Flotation; Column flotation; Froth flotation
Introduction
Being naturally hydrophobic, talc is an industrial mineral that has been employed in a steadily increasing number of uses [1]. Talc is used as a filler, coating, pigment, dusting agent and extender in plastics, ceramics, paint, paper, cosmetics, roofing, rubber and many other products. Flotation is one of the most important physicochemical separation processes, used largely in mineral separation operations [2]. In flotation processes, the particles are suspended in aqueous solution with low surface wettability are linked to air bubbles and removed out of the process space in the form of foam [3]. Flotation cells usually perform the following functions: mixing and agitation of the slurry, aeration and promotion of particle-bubble collisions, continuous discharge of tailings and formation of a froth layer and its removal for product recovery. Column flotation offers many advantages over conventional flotation including: improved metallurgical performance, improved control, less energy consumption and reduced capital investment [4-6]. Kho and Sohn [7] carried out flotation of low grade talc and recovered 83% of talc with a whiteness of 84. Kursun and Ates [8] investigated the interaction of the anionic and cationic collectors and flotation recoveries for talc mineral. Feng and Aldrich [9] reported that there is a 30% decrease in talc recovery after 4 min of ultrasonic preconditioning due to the formation of the hydrophilic magnesium and silicon hydroxyl species on the particle surfaces. Kursun and Ulusoy [10] reported that talc particles possessing higher elongation and flatness were recovered better during column flotation.
Since there are no moving parts in the column flotation cell, the main operating variables are the flow rates of feed air, wash water, product and tailings. Column dimensions, bubble size, air holdup and the reagent dosages are the other important variables. To normalize the effect of flow rates in different sizes of columns, the superficial velocities, defined as the volumetric flow rates per unit area of cross section, are used in the present investigation.
Experimental
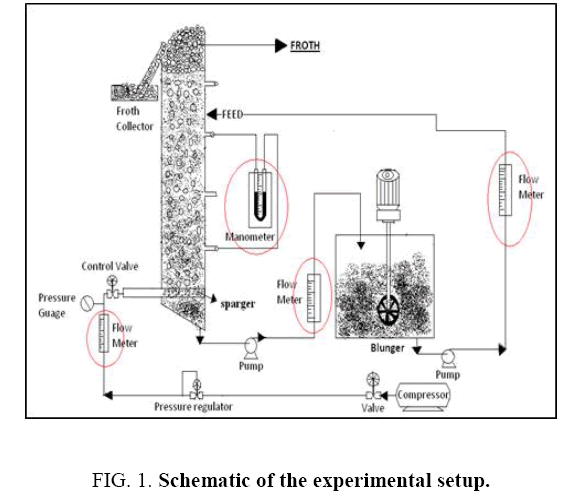
The schematic of the experimental set up employed in the present study is shown in Figure 1. The flotation column was made of 1.5 m long plastic pipe, with inner and outer diameters being 15 cm and 16 cm respectively, so that the height to diameter ratio is 10. The inlet and outlet valves were used to maintain the required slurry flow rate. The setup is equipped with an air compressor and an air receiver. The operating pressure in the column is kept between 0.5 to 1 bar for maintaining uniform bubble size. The bubbles of 3 mm to 5 mm diameter are generated in the flotation column using sparger of 10 cm diameter with a hole size of 0.5 mm.
The flotation experiment was carried out using sodium hexametaphospate as selective depressant and pine oil as frother. Hydrochoric acid was used for acid solubility test which gives the dolomite and talc percentage. The chemical analysis of samples was done by XRF machine. Sieve analysis was carried out by air jet sieve.
Feed sample was mixed in a blunger. For the resulting slurry the density and pH were measured using density cup and a pH meter. The depressant i.e., sodium hexametaphosphate was added at the end of the initial conditioning period and was allowed to condition for 2 min with the slurry. Then frother was added and further 1 min of conditioning was allowed.
In case of batch column studies, the slurry is fed to the column using the inlet feed valve. The air supply valve was gradually opened. The required slurry level was maintained constant. Whole experiment was run for 2 hours. For every two minutes froth was collected.
In case of continuous flotation studies, the slurry is fed continuously into the column by an inlet feed valve at a flow rate of 95 liters-100 liters per hour. Simultaneously the compressed air is opened at the bottom of the column. A few minutes later outlet valve is adjusted to give a flow rate of 90 liters -95 liters per hour. Whole experiment was run on continuous mode about 2 hours. For every two minutes the froth was collected.
After 2 hours of the operation, the valve of compressed air was closed. The heavy particles are allowed to settle in the column and collected as the bottom sludge. After processing is finished, the products (concentrate and tailings) were dried, weighed, and chemically analyzed.
Results and Discussion
Effect of depressant dosage
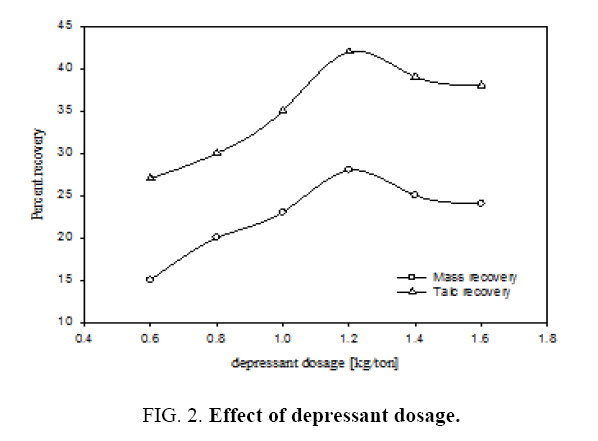
The effect of different depressant dosages on percentages of mass and talc recovery in the continuous flotation cell is shown in Figure 2. Examination of the plot A reveals that by increasing the depressant dosage from 0.6 kg/ton to 1.6 kg/ton the mass recovery exhibited a maximum of 28% corresponding to the depressant dosage of 1.2 kg/ton. It can be seen from the plot B that the talc recovery was also maximum 42% for the same depressant dosage. The mechanism for this behaviour has been explained in detail by Ahmed et al [11]. Since talc is a hydrated magnesium sheet silicate, the concentration of SiO2 and MgO (main constituents of talc) are at their lowest levels in the tailings and CaO, Al2O3 and Fe2O3 (the waste in the talc) are at their highest values at the depressant dosage of 1.2 kg/ton. Therefore in the recovered talc or mass, these substances are at highest and lowest levels respectively. This is due to the capacity of sodium hexametaphosphate to isolate calcium cations and to form a strong hydrophilic complex compound. The variation in concentration of other species can be attributed to the interaction of sodium hexametaphosphate anions.
Effect of frothing agent concentration
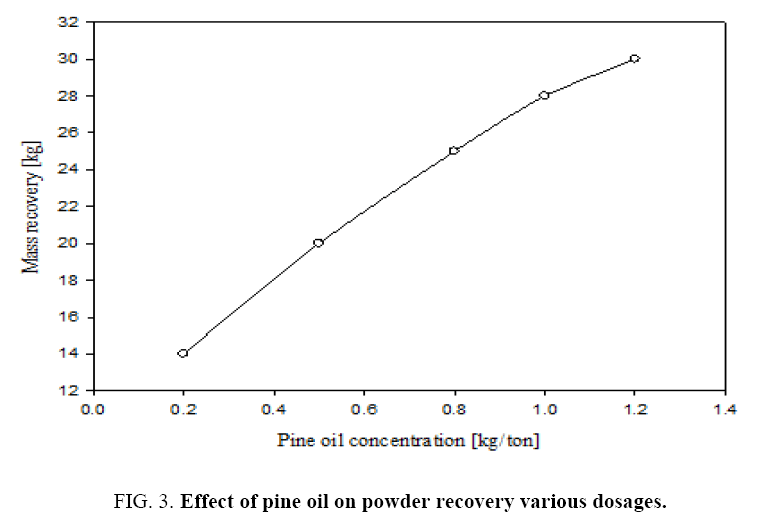
Figure 3 gives the percentage mass recovery in the continuous flotation cell at different dosages of frothing agent i.e., pine oil. It can be seen that by increasing the pine oil dosage from 0.2 to 1.2 kg/ton the mass recovery increased from 14% to 30%. Also increasing the pine oil increases the coarser particles percentage in the collected froth, which is a mixture of pure talc and dolomite particles. Therefore the optimum conditions of these experiments may be obtained for the pure mineral grade talc powder recovery from given feed characteristics at a depressant dosage of 1.2 kg/ton and pine oil dosage of 1 kg/ton. Even though mass recovery increases with frothing agent concentration, but impurities like CaO, Al2O3 and Fe2O3 were increased in product recovered. It is important to optimize the dosages of frothing agent and depressant considering recovered mineral talc purity.
Effect of solid concentration in the feed slurry
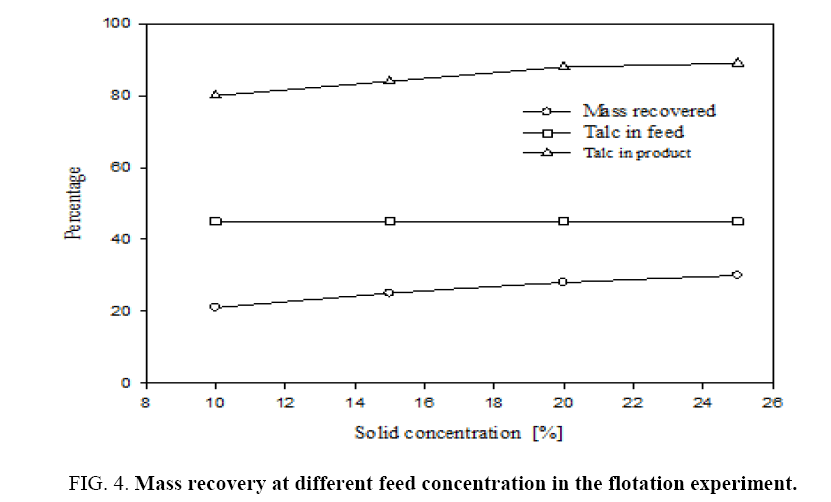
For this flotation experiment different feed concentrations viz., 10%, 15%, 20% and 25% were taken. Pine oil at 1 kg per ton of feed and sodium hexametaphospate at 1.2 kg/ton of feed were added in these experiments. The feed material has particle size 100 μm; the oversize particles were then ground in a ball mill for 30 min, so that particle size was reduced to 45 μm. Figure 4 shows that the percentage mass recovery at different solid concentrations in the flotation. Recovery of the product is increased from 21% to 30% with increasing of feed concentration as seen from plot A. Plot B shows talc content in the feed slurry which is 45%. Plot C shows talc content in the recovered mass. The recovered mass contains 80% to 90% of talc and the remaining was dolomite. This shows that talc content of recovered froth increases with increasing feed concentration, with the 25% of feed concentration had highest talc content. Hence, for subsequent experiments the feed slurry concentration was taken as 25%. The recovery is only 6% for the same feed slurry in the batch flotation at the end of the 2-hour period.
Effect of particle size distribution (Rosin-Rambler size distribution)
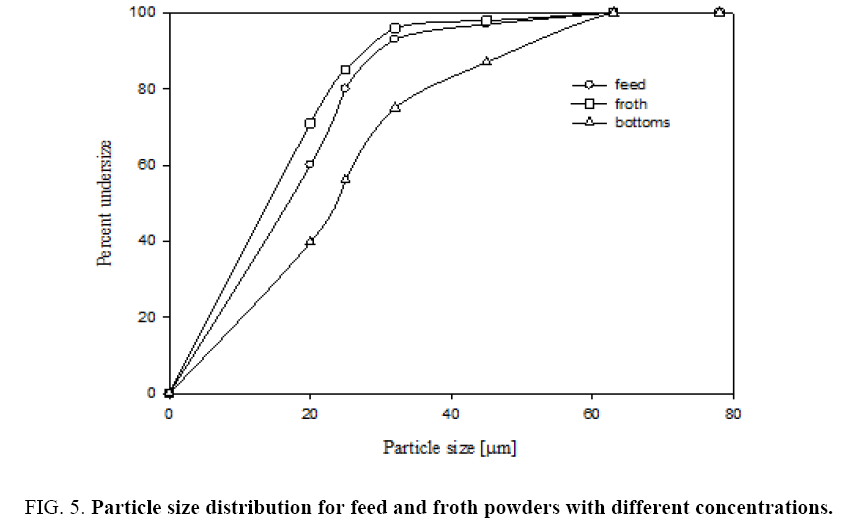
Figure 5 shows that sieve analysis data for both feed and froth by air jet sieve with sieve sizes of 20 μm, 25 μm, 32 μm, 45 μm and 63 μm. This figure shows that cumulative under size of particles in both feed and recovered powder and bottom samples. The particle size of collected froth with different feed concentrations is shown in Figure 5. From the plots we can observe that collected powders with different concentrations have a high cumulative under size percentage. After grinding the feed sample the feed particle size got reduced from 24 microns to 16 microns.
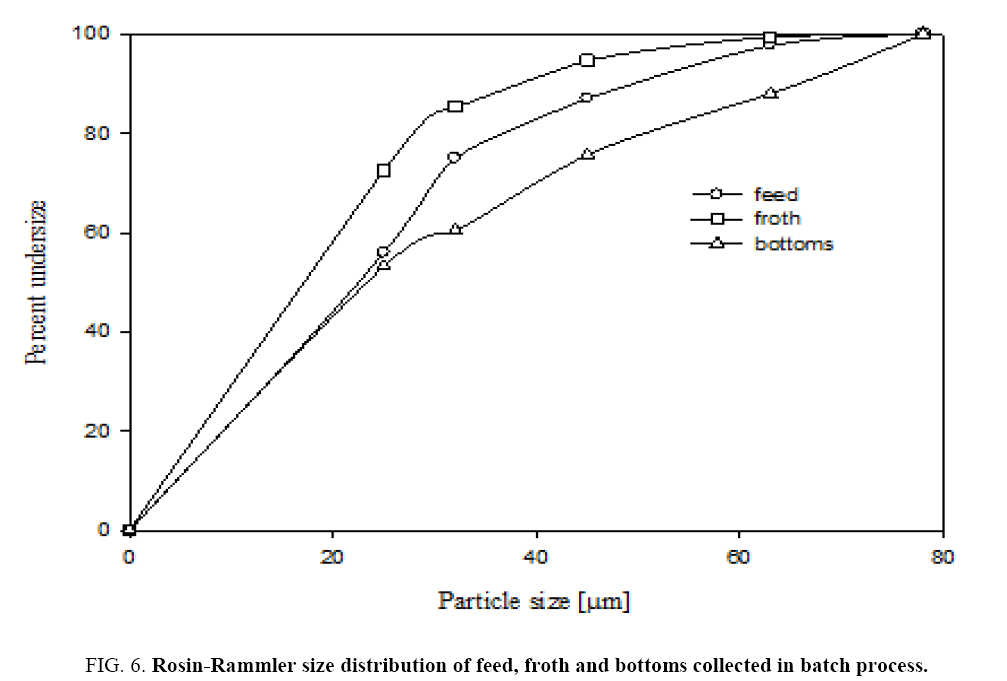
Figure 6 shows that sieve analysis data for both feed and froth by dry air jet sieve with sieve sizes of s 25 μm, 32 μm, 45 μm and 63 μm. This figure shows the cumulative under size of particles in both feed, recovered powder and bottom gangue samples. Figure 6 gives that Rosin-Rammler particle size distributions for feed and product collected powders. Rosin-Rammler particle size distributions represent particle size distributions generated by grinding, milling and crushing operations. It is log-normal distribution and often used to approximate the particle size distribution of aquatic particles and pulverized material. From Figure 6 It can be inferred that the collected particles from froth is having higher number of fine particles as 50% particles are below 16 μm size and feed particles having 28 μm. It can be observed that there is a good amount of fine particle in froth from the current flotation column.
Colour measurement
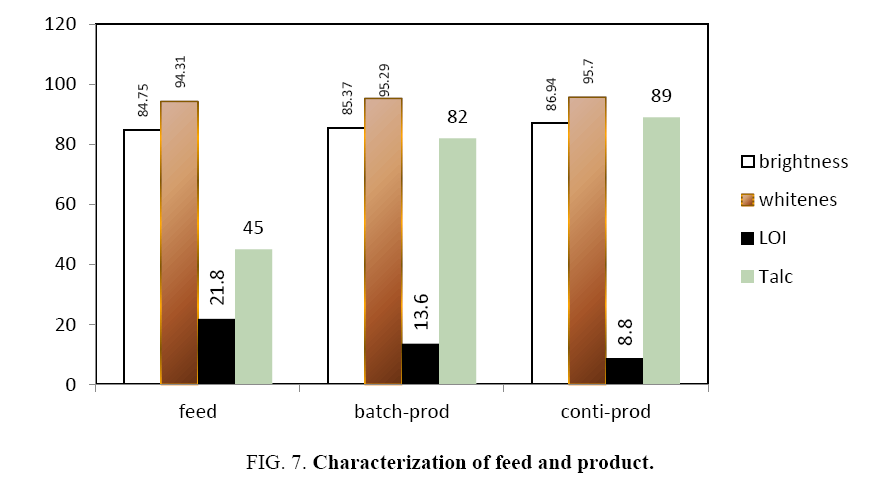
Figure 7 shows the brightness and whiteness of the collected powders measured in the present study. It is observed that the brightness and whiteness increased after flotation. From the colour measurement data, in the continuous flotation cell, the collected powder has higher brightness than feed (86.94 against 84.75 percent) and whiteness is also more (88.53 against 86 percent). Similarly, in the case of batch flotation also higher values of brightness (85.37 against 84.75 percent) and whiteness (95.29 against 94.31 percent) were reported.
Loss of ignition (LOI) percentage
A decrease in the LOI percentage indicates that the collected powder has fewer impurities (dolomite and calcite). This shows the LOI value of the feed, the products from both continuous and batch column flotation units. An examination of the data from the plots reveals that the froth has fewer impurities than the feed. This argument can be substantiated from XRF analysis, which is shown in Table 1. From the table the CaO value is decreased from 19.11 to 6.02 percentage, MgO is increased from 23.48 to 29.24 percentages, SiO2 is also increased from 41.03 to 56.76 percentage. Fe2O3 value does not change in feed and collected powder. It is believed that most of the Fe2O3 is present in solid solution in the talc crystal structure. Since talc contains MgO and SiO2, from Table 1 it can be inferred that the collected powder has high talc percentage.
| Compound | Feed | CCF | BCF |
|---|---|---|---|
| CaO (%) | 19.11 | 6.02 | 8.02 |
| Fe2O3 (%) | 2.715 | 2.78 | 2.79 |
| MgO (%) | 23.48 | 29.24 | 28.28 |
| SiO2 (%) | 41.033 | 56.76 | 55.85 |
Table 1: XRF analysis of constituents in the flotation of experiments.
PC analysis
Table 2 shows that powder characterization for the feed and collected powder and bottom sludge. It is observed that the surface area of the powder in froth increased when compared with feed. Similarly, the tap density of the powder in froth decreased from 1193 kg/m3 to 850 kg/m3. When compared with feed, the AOR value has also decreased from 50° to 38°. These observations indicate that froth particles have better free flowing properties than feed.
| S.No | Properties of powder | Feed | Froth | Gangue |
|---|---|---|---|---|
| 1 | Specific surface area, (cm2/g) | 2615.4 | 6504.7 | 2043.1 |
| 2 | Bulk density, (kg/m3) | 714.2 | 457.5 | 909.0 |
| 3 | Tapped density, (kg/m3) | 1193.1 | 848.1 | 1357.2 |
| 4 | Hauser ratio | 1.67 | 1.85 | 1.49 |
| 5 | AOR (degrees) | 50 | 37 | 42 |
Table 2: Powder characteristic analysis data for feed, froth and bottom powder.
Conclusion
The mass recovery was up to 30% and talc recovery was up to 90 percent. For good powder and talc recovery the slurry concentration should be 25% with present setup. The depressing power of sodium hexameta phosphate is good till the optimal dosage of 1.2 kg/ton, and pine oil is 1 kg/ton. The product exhibited better flow and optical properties.
References
- Ahmed MM, Ibrahim GA, Hassan MMA. Beneficiation of Talc Ore. Al-Azhar University, Qena, Egypt, 1985; 241-71.
- El-Rahiem FH. Investigation of the effective parameters for enrichment of egyptian talc with column. The Journal of Ore Dressing. 2005;7(13):14-7.
- Pokrajcic Z, Harbort GJ, Lawson V, et al. Benefits of high intensity flotation at the head of base metal flotation circuits. Greg Harbort.
- Özkan A, Yekeler M. A New microscale flotation cell: Combination of Canadian column and Partridge-Smith cell. 2001;975:395-417.
- Sateesh KP. Beneficiation of talc from pulverized talc mineral by using column flotation. M.Tech dissertation, GVP College of Engineering(A), Visakhapatnam, India 2013.
- Divya Lakshmi J. Influence of talc particle size in paint formulation. M. Tech dissertation, GVP College of Engineering(A), Visakhapatnam, India 2013.
- Kho CJ, Sohn HJ. Column flotation of talc. Int J Miner Process. 1989;27:157-67.
- Kursun H, Ates A. Adsorption and column flotation studies on talc using anionic and cationic collectors. Korean J Chem Eng. 2010;27(6):1922-7.
- Fend D, Aldrich C. Effect of ultrasonication on flotation of talc. IndEngChem Res. 2004;43:4422-27.
- Kursun H, Ulusoy U. Influence of shape characteristics of talc mineral on the column flotation behaviour. Int J Miner Process. 2006;78(4):262-68.
- Ahmed MM, Ibrahim GA, Hassan MMA. Improvement of Egyptian talc quality for industrial uses by flotation process and leaching. J Eng Sci. 2007;83(3):132-45.
