Original Article
, Volume: 16( 2) DOI: 10.21767/0972-768X.1000269Synthesizing Graphene Oxide as a Working Electrode for Decreasing pH with Alkaline Water Electrolysis
- *Correspondence:
- Aldwin Amireza, Chemistry Department, Mathematics and Natural Science Faculty, State University of Surabaya, Jl. Ketintang, Surabaya 60231, Indonesia, Tel: +62-318280009; E-mail: aldwinamireza@gmail.com
Received: May 20, 2018; Accepted: May 28, 2018; Published: June 02, 2018
Citation: Setiarso P, Amireza A. Synthesizing Graphene Oxide as a Working Electrode for Decreasing pH with Alkaline Water Electrolysis. Int J Chem Sci. 2018;16(2):269.
Abstract
This research has been done with synthesizing graphene oxide (GO) using Hummer method as a working electrode in a part of alkaline water electrolysis. The aim of this research is to know the optimum composition between GO and paraffin as an adhesive material, and so on to be used for electrolyzing the alkaline water. The sample that will be analyze is a water that has pH value 8; 8.5; and 9. Composition for working electrode that will be tested by cyclic voltammetry are 5:5, 6:4, 7:3, 7.5:2.5, 8:2. Cyclic voltammetry test is run by scan rate at 100 mV/s and deposition time at 10 s. The result of cyclic voltammetry test described that 8:2 has the optimum composition and optimum pH was given to pH 9. This result later used for working electrode of alkaline water electrolysis that reached decreasing value 0.01 for each 20 minute gradually from pH 9.00 to 8.40.
Keywords
Cyclic voltammetry; Alkaline water electrolysis; Graphene oxide
Introduction
Graphene oxide (GO) is a new form of synthesized graphite. GO is an oxidized multilayer because chemical reaction that involved using oxidizing agent, potassium permanganate [1]. The difference between graphite and graphene oxide shown by layer structure that formed, thereby graphite is a hexagonal monolayer carbon with sp2 hybridization. Graphene is defined by the International Union for Pure and Applied Chemistry (IUPAC) as “a single carbon layer of graphite structure, describing its nature by analogy to a polycyclic aromatic hydrocarbon of quasi-infinite size”.
Producing graphite to graphene oxide has been done with involving chemical synthesizing, where the reaction by adding some acidic using Hummer method. This oxidation process which happened to graphite that has been added oxidizing agent then sonicated so its formed exfoliated and producing a few layers called graphene oxide (GO). One of the advantages of GO is its easy dispersability in water and other organic solvents, as well as in different matrixes. This is due to the presence of the oxygen functionality groups. This remains a very important property in mixing the material with ceramic or polymer matrixes
when trying to improve their electrical and mechanical properties [2,3]. On the other hand, in terms of electrical conductivity, GO is often described as an electrical insulator, due to the disruption of its sp2 bonding networks [4]. Tendency of working electrode of GO for being substituted very possible because conductivity properties is higher than common carbon. This is due to exist of changing structure that formed from synthesized result and so the bond that formed is much stronger than graphite.
Voltammetry has some advantage from other method, one of them has a good selectivity. This advantage for voltammetry examine is not necessary to do some long sample preparation, like splitting between major and minor elements and concentration before analysis [5]. A solid electrode has a wide potential anode and cathode range and often used is carbon paste electrode. Carbon paste electrode is a cheap electrode and easy to renew and produced in a small shape. To enhance the working of carbon paste electrode thus do modification with material that advance of accomplished for analyzing some metal. Modifier that used to enhance selectivity of carbon paste electrode is a complex compound [6]. GO synthesis result has been used as a working electrode on alkaline water electrolysis’s circuit. This process has a purpose to decreasing pH value with some electrical voltage. The change of pH value caused by discharge of hydrogen and oxygen gas dispersed closest to pH 7.
Materials and Methods
Equipment and material
Material that used in this research is graphite powder 300 mesh, sulfuric acid 98%, phosphoric acid 65%, solid potassium permanganate, hydrogen peroxide 30%, chloric acid 37% and 1 M, zinc powder, aquademineral, aquadest, ethanol p.a. Equipment that used are glassware, electrolyzing circuit, pH meter, oven, set of Voltammetry Instrument VA737, XRD Phillips PANalytical, FTIR, SEM-EDX JEOL JSM 6510 LA. Instrumental test is done at The State University of Surabaya, Institute Technology of Sepuluh November Surabaya, and National Nuclear Power Agency (BATAN).
Synthesizing process of graphene oxide
First step of synthesis is by mixing 1 g graphite powder with sulfuric acid and phosphoric acid in 9:1 ratio on 100 mL total volume. The mixture then stirred above hot plate stirrer in medium speed with no temperature for 6 hours. After 6 hours of stirring, the mixture that still stirring condition added by 6 g of KMnO4 and continued for 18 hours by changing the mixture turned into condense brown mixture. The mixture then added by 1 mL H2O2 along with stirring. All the mixture finally filled with 400 mL aqua DM, and the mixture changed into purple brown. Then, the mixture deposited a few days until the residue can be used as a graphite oxide during decantation. Residue then washed with centrifuge in 4000 rpm speed. The washer for residue in centrifuge process is aqua DM, hydrochloric acid 1 M and ethanol p.a. After the residue has been washed, then heated by oven in temperature 70°C for 24 hours.
Graphite oxide then mixed with scaling 50 mg over 50 mL aqua DM in ultrasonic bath for 2 hours. Sonication stopped and adding 10 mL solution of hydrochloric acid 37%, 0.8 g of zinc powder and 10 mL solution again with stirring time 30 minutes for each addition gradually. While stirring in constant speed using hot plate stirrer was done, the mixture would be formed as a thin layer called graphene oxide after washed by aqua DM until reached neutral pH and dried over heat in temperature 100°C by using oven for 24 hours.
Cyclic voltammetry
In this experiment of using voltammetry, the electrode is prepared by mixing GO and paraffin for insulator for examine the optimum composition. The compared composition between GO: paraffin are 5:5, 6:4, 7:3, 7.5:2.5, and 8:2. Alkaline water that become test sample are mineral water that has pH value above 7, which is 8; 8.5; 9. Electrode that has been made by sticking in single wire cable with 15 cm length tested by voltammetry. The test run in condition current potential -2V until 2V, scan rate 100 mV/s and deposition time for 10 s.
Alkaline water electrolysis
Electrolysis that has been run in this research is started with making 12 V current electronical circuit, alligator claws, pH meter, and mineral water that has pH value above 7, which is 8; 8.5; 9. Sample poured inside beaker glass for 100 mL with additional of 1 drop potassium hydroxide 0.025 M. Working electrode for electrolysis then connected with electronic circuit of electrolysis and alligator claws and the electricity is on as long as the stopwatch is on. The pH meter dipped during the electrolysis is on.
Results and Discussion
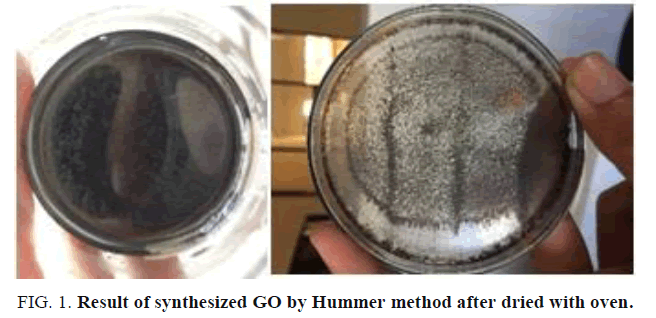
The result of GO synthesized in this research is black hydrophilic solid after washed by aqua DM and ethanol p.a. then dried on heat with oven (FIG. 1).
Characterization of graphite, graphite oxide and GO
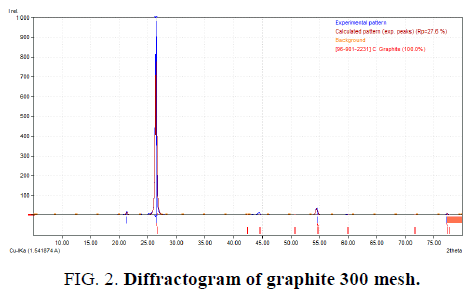
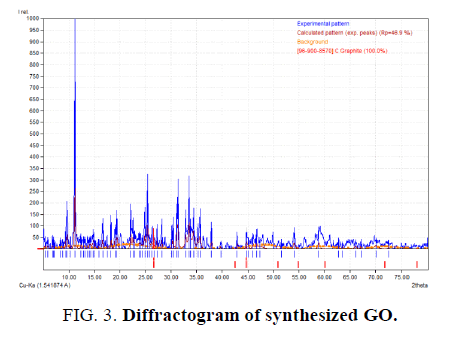
Characterization from synthesis has been done with using XRD PANalytical instrument at National Nuclear Power Agency (BATAN), Serpong. The experiment has been tested using Cu-Kα anode in wavelength 1.54 ? on angle degree 2θ 10° 80°. The results obtained by comparing precursor (graphite) with GO that shown in figure below.
Analyzing with using Match! 3 software (trial) shown that sample of graphite has a peak that formed maximum intensity at 2θ degree 26.43°, has FWHM value 0.2625 and d-spacing 3.3722. GO as a compared result has 2θ degree at angle 11.22 with FWHM value 0.21 and d-spacing 7.8870. Each difractogram has been analyzed in FIG. 2 and FIG. 3.
These results later counted with using Debye-Scherer method to know crystalline size that expected as a nanomaterial. Based on calculation at each angle that produced by diffractogram, the changes of crystalline size happened at closure angles. At same angle, which 26.4° (graphite) and 26.6° (GO), the crystalline size changed after synthesizing treatment. Crystalline size at angle 26.4° is 5.89 whereas at angle 26.6° is 3.707. Angle shift that happened caused by preparation sample and sample size that produce not actually even. This impact for the angle which being strike from X-ray instrument.
Scanning electron microscope characterization
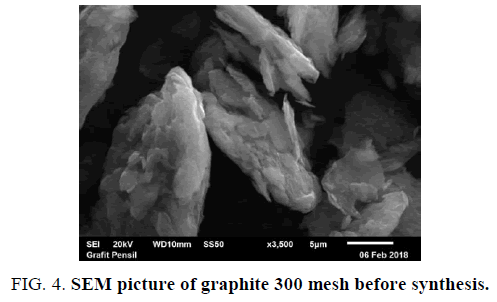
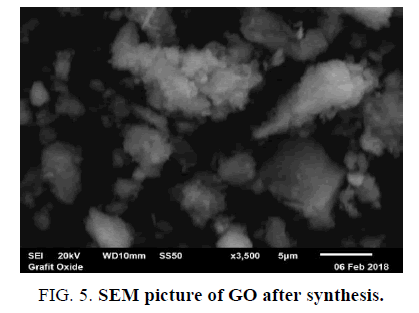
Characterization testing using SEM is to know the surface morphology of graphite that has been changed before and after synthesis. Magnification that used in each test is 3.500X, respectively. The test is done at PSTBM-BATAN with instrument series SEM-EDS JEOL JSM 6510LA (FIG. 4 and FIG. 5).
FTIR characterization
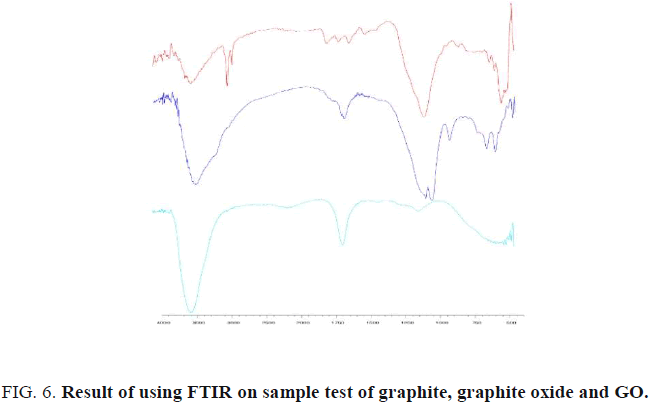
Characterization FTIR is used to know functional groups that can be shown at sample test before and after synthesis. The result on FTIR test shown that graphite, graphite oxide and GO describe in this figure below (FIG. 6).
Based on the result, there are some shifting wavenumber on each step of synthesis. First, shift occurred at peak number 100 cm-1 to 1003 cm-1 respectively for graphite and graphite oxide. Whereas on the same wavenumber cannot be shown at GO. Same wavenumber peak has shown on 1624 cm-1 until 1654 cm-1 (graphite) with 1633 cm-1 (graphite oxide) and 1635 cm-1 (GO). Nevertheless, this peak that caused shifting effect occurred at 3450 cm-1 (graphite), 3392 cm-1 (graphite oxide) and 3446 cm-1 (GO).
Cyclic voltammetry result
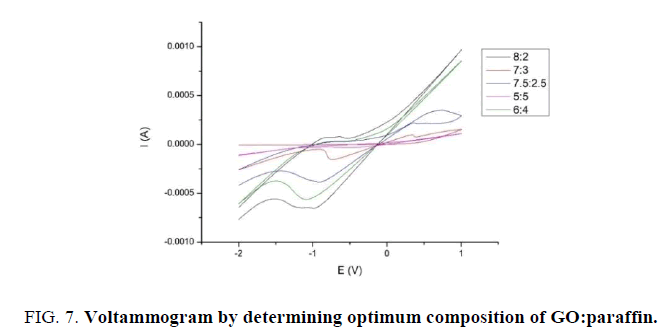
Cyclic voltammetry run to determining optimum pH value (8; 8.5; 9) and optimum composition from varied ratio of GO: paraffin 5:5, 6:4, 7:3, 7.5:2.5, and 8:2. The test running in current potential at -2 V until 2 V, with deposition time 10 s and scan rate 100 mV/s. The result that obtained is voltammogram with deliver redox current then choosing the optimum result. The following figure are the result of choosing optimum comparison electrode (FIG. 7).
From following figure above, it seems that optimum composition is located in 8:2. This observed from peak that formed at cathode direction is sharper than other composition. Much like 8:2, composition of 6:4 has a peak in sharp reverse flow but reduction tends to have a slope (TABLE 1). These are the following from running voltammetry test (FIG. 8).
| Composition | Ipc (mA) | Epc (V) | Ipa (mA) | Epa (V) |
|---|---|---|---|---|
| 5:5 | -0,0137 | -0,883 | -0,033 | -0,547 |
| 6:4 | 0,0297 | -0,744 | -0,563 | -1,089 |
| 7:3 | 0,0984 | 0,338 | -0,154 | -0,738 |
| 7,5: 2,5 | 0,00261 | -0,720 | -0,385 | -0,91 |
| 8:2 | 0,0804 | -0,637 | -0,653 | -0,988 |
Table 1: Current peak at optimum composition.
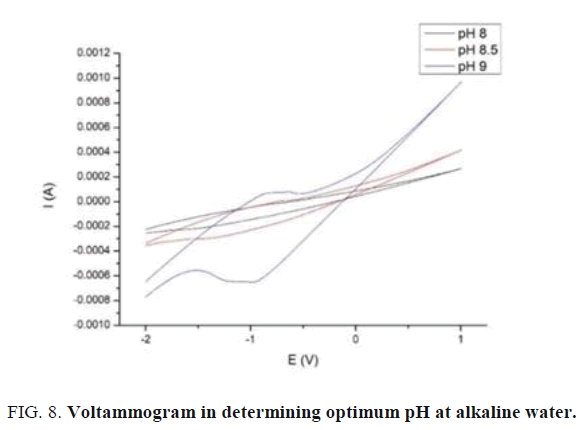
From figure above based on running test, optimum pH of alkaline water is pH 9. The test has been done based on optimum composition of electrode 8:2 with scan rate 100 mV/s at deposition time 10s. The peak result at pH 9 tends to low level and there is no sharp peak when scanning from toward current to back current. The result of the figure above has been shown on this table below (TABLE 2).
| pH | Ipc (mA) | Epc (V) | Ipa (mA) | Epa (V) |
|---|---|---|---|---|
| 8 | -0,0217 | -0,836 | -0,22 | -1,575 |
| 8,5 | 0,00403 | -0,729 | -0,299 | -1,44 |
| 9 | 0,0807 | -0,64 | -0,653 | -0,988 |
Table 2: Current peak at optimum pH.
Alkaline water electrolysis
This last step on this research is done by connecting electrical circuit with working electrode from synthesized steps. After combining the circuit, pH meter is dipped inside beaker glass which already poured by 100 mL alkaline water with addition of 5 drops NaOH 0.025 M [7]. The solvent then mixed on top of hot plate stirrer to be homogeny. The result of timing process by doing electrolysis has been reached by decreasing value of 0.01 per 20 minutes. Decreasing of this sample has occurred at 12 V/1A current voltage. This happened caused by releasing of hydrogen and oxygen gas to be decomposed and reached pH value close to neutral.
Conclusion
Based on research result, GO working electrode that has been used for alkaline water electrolysis can be decreasing pH value with additional electrolyte of NaOH 0.025 M. Using optimum composition between GO:paraffin at 8:2 is considered as a working electrode. Optimum of pH value after cyclic voltammetry test is 9. Average time for decreasing pH value of alkaline water using GO working electrode is 0.01 per 20 minutes gradually from 9.00 to 8.40.
References
- Ambrosi A, Chua CK, Bonanni A, et al. Electrochemistry of graphene and related materials. Chemical Reviews. 2014;114(14):7150-88.
- Cao Y, Feng J, Wu P. Preparation of organically dispersible graphene nanosheet powders through a lyophilization method and their poly (lactic acid) composites. Carbon. 2010;48(13):3834-9.
- Yoo D, Kim J, Kim JH. Direct synthesis of highly conductive PEDOT: PSS/graphene composites and their applications in energy harvesting systems. Nano Res. 2014;7:717-30.
- Eluyemi MS, Eleruja MA, Adedeji AV, et al. Synthesis and characterization of graphene oxide and reduced graphene oxide thin films deposited by spray pyrolysis method. Graphene. 2016:5:143-154.
- Eko Y, Pirim S. Producing Modified Carbon Paste Electrode for Cr (VI) Analyzing with Cyclic Stripping Voltammetry. State University of Surabaya: Indonesia. 2014.
- Ardi dan Setiarso R. Use zeolite as modifier carbon electrode pasta for analysis Cd (II). In: Cyclic Stripping Voltammetry. State University of Surabaya: Indonesia. 2016;5(3).
- Yuvaraj AL. A Systematic Study on Electrolytic Production of Hydrogen Gas by Using Graphite as Electrode. India: SR Engineering College. 2014;83-7.
