Original Article
, Volume: 16( 1)Synthesis, Optical and Morphological Studies of ZnO Nanoparticles Capped with PVP as a Surfactant
- *Correspondence:
- Viswanathan K Department of Physics, Kalasalingam University, Kalasalingam Academy of Research and Education, Anand nagar, Krishnankoil, Tamil Nadu, India
Tel: 04563289042; E-mail: kvnooty@gmail.com
Received Date: December 13, 2017 Accepted Date: January 16, 2018 Published Date: January 20, 2018
Citation: ZnO nanoparticles; PVP; Optical; Morphological
Abstract
ZnO nanoparticles have been successfully synthesized by a chemical precipitation method using non-ionic surfactants such as PVP in aqueous medium. The particles were prepared in air atmosphere at 80°C. X-ray Diffraction (XRD), Scanning electron microscope (SEM), Fourier transform infrared spectrometer (FT-IR), UV-visible and photoluminescence (PL) studies were used to investigate the effect of capping agent on the size, morphology and optical properties of the ZnO nanoparticles.
Keywords
ZnO nanoparticles; PVP; Optical; Morphological
Introduction
ZnO is a semiconducting material which has a wide band gap of 3.27 eV in bulk. This makes it a very useful material for nano electronics and photonics applications. Its high exiton binding energy of 60 meV, breakdown strength and its multifunctional (piezoelectric, ferroelectric an ferromagnetic) properties make this material more advantageous over other materials for electronic applications [1,2]. Compared to common semiconductor materials such as Si, GaAs and CdS, ZnO is much more resistant to radiation damage. ZnO finds a lot of applications in UV-emitting diodes, cathode-ray phosphors, transparent conductors, varistors, chemical sensors, UV-protection films and ultrafast nonlinear optical devices [1]. Due to their enhanced optical and electrical properties, polymer capped nanoparticle composites are studied extensively. Polymers can interact with metal ions by complex or ion pair formation and can be designed to certain physical properties of semiconductor nanoparticles. This makes it a good choice for stabilizers [3]. The polymeric PVP capping molecule, when added to the reaction mixture, simply attach to surface of growing particles, preventing further growth of the particles, either by electrostatic or steric repulsion. For the role of PVP, the surface regulating polymer is believed to play a key role in preventing the flocculation of particles, controlling the particle size and its morphology [4,5]. PVP, which contains nitrogen (N) and oxygen (O), attaches easily to the ZnO surface reducing the surface free energy. This slows down the growth of the crystal facets. As a kinetic controller, PVP adsorbed on specific crystalline surfaces, significantly decreases their growth rate leading to nanosized particles. PVP capped ZnO nanoparticles blended with poly (3-hexylthiophene) are also used for hybrid solar cell applications [6].
Several expensive methods such as chemical vapor deposition, metal organic vapor-phase epitaxy, molecular beam epitaxy, spray pyrolysis and wet-chemistry approaches, are available for the growth of ZnO nano particles. These methods have their own attractions, as they can be synthesized easily, with low cost and without specific equipments. Co-precipitation method is considered to be one of the potentially advantageous and best techniques, to produce pure phase compounds, due to low temperature preparation, high purity and high yield of nano-powders [7,8]. The present work is an attempt to synthesize ZnO nanoparticles by a chemical precipitation method using non-ionic surfactants such as PVP in aqueous medium. The nanoparticles are characterized by UV, PL SEM and FT-IR.
Materials and Methods
Materials
The following materials were used, to synthesize ZnO and surfactant capped ZnO nanoparticles. All the glass-wares used in this work were acid-washed. The chemical reagents used were of analytical reagent grade, without further purification. Ultrapure water was used for dilution and sample preparation. Zinc acetate Zn(C2H3O2)2, NaOH and polyvinyl pyrolidone (PVP-40,000) were obtained from Loba Chemie Pvt. Ltd., Mumbai. All the chemicals are of>98% purity.
Synthesis of ZnO nanoparticles
ZnO nanoparticles were synthesized by chemical precipitation method, where the synthesis reaction was carried out in aqueous medium. Solutions of 0.5M Zn(C2H3O2)2 and 0.6 M NaOH were prepared separately in 50 ml de-ionized water. First of all, the Zn(C2H3O2)2 solution was stirred very well for 25-30 minutes at 80°C. Then, 50 ml of NaOH solution was added drop by drop to the above solution. Suddenly, at a point, a white precipitate appeared. The precipitate was collected from the solution by adding known volume of acetone. Then flocculation of nanoparticles had occurred. To remove the last traces of adhered impurities, the particles were washed thrice using de-ionized water, ethanol and acetone. The washed particles were dried at 120°C in air for 2 hours.
Synthesis of surfactant capped ZnO nanoparticles
The surfactant capped ZnO nanoparticles were prepared with zinc acetate, sodium hydroxide and soluble surfactant as stabilizing agent. Different concentrations of soluble surfactant were prepared separately in 50 ml distilled water, using a magnetic stirrer to dissolve the sample completely.
Following the same procedure (section 2.2), newly prepared surfactant was added into zinc acetate before adding NaOH, with continuous stirring. Then, following the other steps continuously (in section 2.2), surfactant capped ZnO nanoparticles were synthesized, which were washed three times using distilled water, to remove the by-products and the excessive surfactant, that were bound to the nanoparticles. The nanoparticles were dried at 80°C for 2 h, after washing, during which, complete conversion of surfactant capped ZnO takes place.
Characterization
The synthesized particles were characterized using scanning electron microscopy (SEM) and X-ray diffraction (XRD). SEM was used to obtain morphological information and XRD was used to identify the crystalline phases and to estimate the size of the particles. The presence of different functionalities on the capping agent and their retention on nanoparticles functionalization could be characterized by Fourier transform infra-red spectrometer (FT-IR). The UV-Vis spectrum was used to measure the excitation and band gap of the samples. The emission spectra were recorded by photoluminescence (PL).
Results and Discussion
UV absorption
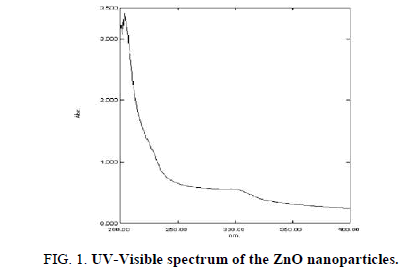
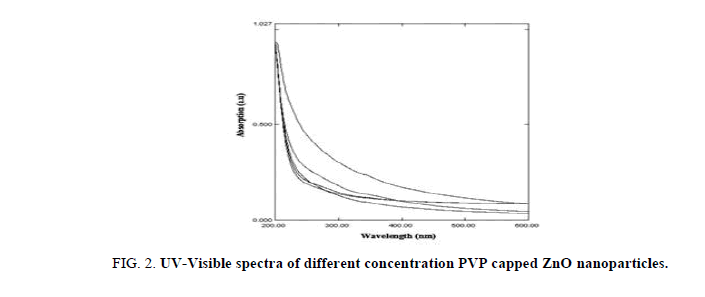
Room-temperature UV-Vis absorption spectra of the as-prepared uncapped and different concentrations (0.25-1.25%) of PVP capped ZnO particles, are shown in Figure 1 and Figure 2. The absorption was observed between 200 nm and 600 nm. There is no change in the peak positions of all capped samples compared to PVP concentration, but there is variation in the intensities. As seen in Figure 2, strong UV absorption is characteristic of all measured PVP capped and uncapped ZnO samples, centered at 297 nm and 330 nm, respectively. The peak of PVP capped samples is more (blue) shifted from the uncapped ZnO nanoparticle (Figure 1) and bulk ZnO, due to quantum confinement effect. This indicates the formation of small ZnO particle assembly and finally formation of hexagonal ZnO nanorods, by adding PVP as a surfactant. Therefore, the branching rods are suggested to be twinned crystals rather than random aggregates of independently grown rods.
Photoluminescence
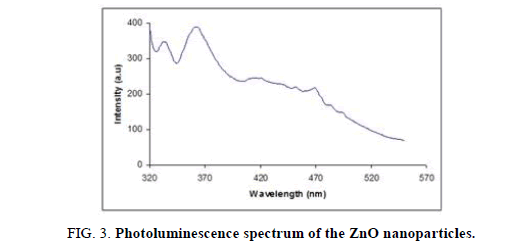
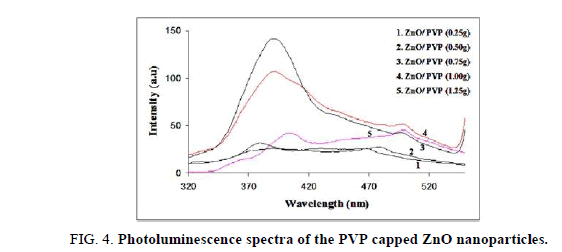
The photoluminescence spectra of uncapped and different concentrations of PVP capped ZnO, are shown in Figure 3 and Figure 4, respectively. Figure 3 shows the Photoluminescence spectra of unmodified (uncapped) ZnO nanoparticles at room temperature. It shows two emission peaks, the first one is centered in the UV region at 365 nm and another one appeared in the visible region at 500 nm. In addition, a strong peak centered at 490 nm (curve 1 and 2) and a weak band centered at 500 nm, are observed, attributed to the recombination of excitonic centers and optical recombination of defects in the crystal as seen in Figure 4, respectively. Further, the PL spectrum of PVP-modified ZnO samples (curve 3 and 4) reveals the existence of two emitting bands.
One is a strong ultraviolet emission at around 392 nm, which has a slight red shift compared with the PL spectrum of ZnO with modified PVP, at lower concentration (curve 1 and 2). It might be attributed to the defect passivation on the surface region of ZnO nanorods due to the conjugation of PVP. The strong ultraviolet peaks come from the recombination of excitonic centers. The emission peaks centered at ~ 500 nm comes from nanoparticles, referred to the near band-edge free excitonic emission and the deep level or trap state emission. Both these peaks are generally attributed to the special structure of the prepared nanocrystals, especially singly ionized oxygen vacancies from the surface of the nanostructure. Moreover, weak blue emission at 470 nm, 480 nm and 500 nm, are observed, which may be in correlation with ionized oxygen defects or others on the surface of the nanoparticles. At lower concentration of PVP, nano-ZnO rods display an intensive ultraviolet emission peak centered at 380 nm. It is well known that the UV emission peak usually originates from a near-band edge transition of the wide band gap [9,10].
XRD
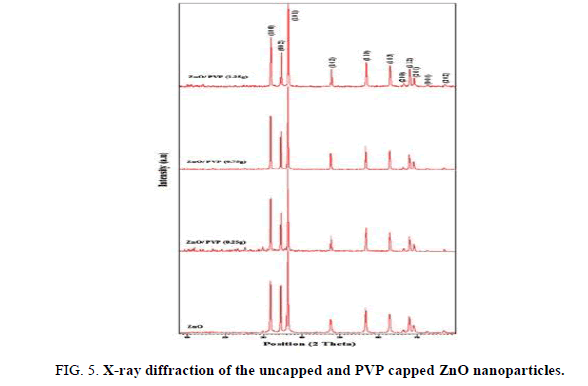
X-ray diffraction spectrometer is used to characterize the structure and size of the nanoparticles. The XRD spectra of uncapped and selected concentration (1, 3 and 5%) of PVP capped ZnO nanorods are shown in Figure 5. A series of characteristic peaks at 2θ=31.73° (100), 34.73° (002), 36.21° (101), 47.48° (102), 56.53° (110), 62.79° (103), 66.34° (200), 67.88° (112), 69.03° (201), 72.46° (004) and 76.86° (202) are observed and they are in accordance with the hexagonal phase of ZnO (International Center for Diffraction Data, JCPDS 89-1397). In addition, no peaks of impurity are observed suggesting high purity of ZnO and it indicates no disturbance to the hexagonal ZnO nanorods by adding the PVP as a surfactant. However, the intensity varies. The significant improvement in crystallinity is due to sintering of nanocrystals into effectively larger crystal size. Further, the peak is widened implying that the particle size is very small according to the Debye–Scherrer formula (equation 1).
D=kλ/(βcosθ) (1)
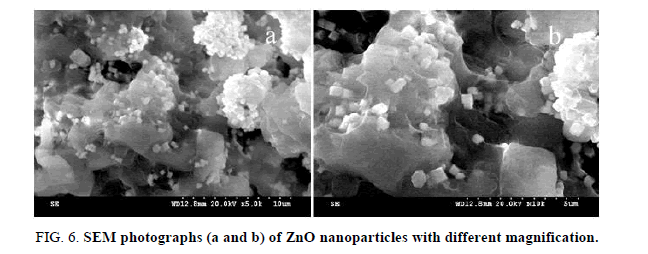
where k is the shape factor (=0.9) Scherrer constant, λ is the X-ray wavelength, β is the peak width of half-maximum and θ is the Bragg diffraction angle. The average crystallite (thickness of the nanorods) size D is 40 nm, as calculated using the Debye–Scherrer formula. However, the shape of the products was obviously influenced by the preparation route (Figure 6).
Scanning electron microscope (SEM)
Scanning Electron Microscope images of the synthesized samples were recorded in a powder form. The morphology of the particles obtained by annealing at 120°C, was studied by using SEM. Figure 6 (a and b) show the results. We could not measure the actual particle-size from the SEM micrographs due to its poor resolution.
The surface to volume ratio (i.e., aspect ratio) for nanoparticles is higher than their bulk counterpart. As more atoms/molecules are arranged on the surface of nanoparticle, the surface chemistry of these materials is of immense interest [11]. In order to quickly establish the presence or absence of the various vibrational modes present in ZnO nanoparticles and to probe the effect of the surfactant, FT-IR spectra of ZnO nanoparticles were recorded.
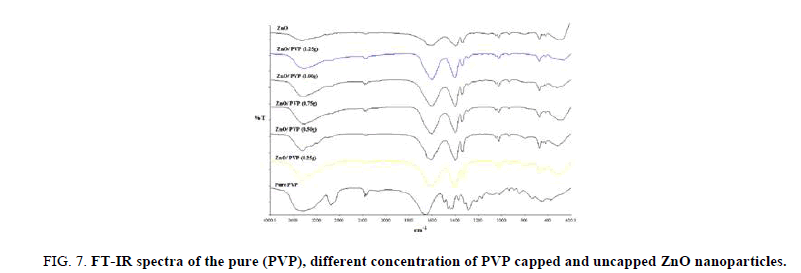
IR spectroscopy gives qualitative information about the way in which the adsorbed PVP molecules are bound to the surface of ZnO nanoparticles. Figure 7 compares the IR spectra of ZnO nanoparticles in the absence and presence of adsorbed PVP with different concentrations. The peak between 3200 cm-1 and 3600 cm-1 suggests the presence of hydroxyl group. The strong absorption band of hydroxyl group of the PVP capped ZnO shifts towards low wave number and its transmittance increases when increasing PVP concentrations on the hexagonal ZnO, which indicates hydrogen bond, formed at the ZnO/polymer interface. The type and number of surface groups in ZnO nanoparticles may also determine the extent of polymer adsorption. Hydrogen bonding is the primary adsorption mechanism for non-ionic polymer.
Figure 7: FT-IR spectra of the pure (PVP), different concentration of PVP capped and uncapped ZnO nanoparticles.
The concentrations of these groups (-ZnOH2+, –ZnOH, –ZnO–) depend on the pH of the solution. In the present case, on decreasing the pH value, the concentrations of –ZnOH2+ group and –ZnOH group increase markedly, while that of the –ZnO– group decreases [10,11]. Such behavior makes more polymers adsorbed on the surface of ZnO nanoparticles because more availability of –OH group bound directly to Polymer segments. Another IR peak at 1400 cm-1 results from OH– absorption of hydrogen-related defects.
Compared with the pure ZnO, the intensity of the peaks at 3445 cm-1, 1640 cm-1 and 14 00 cm-1 is enhanced when the increasing of capping concentration on ZnO surface. It indicates that the concentration of surface hydroxyl groups and active hydrogen-related defects of samples is related to the capping content, which affects the photo catalytic activity. The band at 435 cm-1–490 cm–1 is correlated to Zinc oxide [12]. The presence of other bands at ~878, ~1380 and 2359 cm–1 are probably due to the carbonate moieties which is generally observed when FT-IR samples are measured in air [13]. It seems, from these curves, that the nature of the bonds in sols changes with higher concentration of PVP.
Conclusion
Nanocrystals of pure and PVP encapsulated ZnO were synthesized through chemical precipitation methods. The formation of single phase hexagonal ZnO structure was confirmed from the XRD analysis. Using Scherrer’s formula, the particle sizes were estimated to be in the range of 40 nm. The functional groups of PVP and ZnO were identified by FT-IR analysis. The transformation of spherical particles into rod shaped on PVP capping, was confirmed using the SEM studies. The UV absorption peaks were blue shifted which confirmed Quantum Confinement effect. The PL emission peaks pointed out the defect oriented emission.
References
- Look DC. Recent advances in ZnO materials and devices. Mater Sci Eng B. 2001;80:383-7.
- Muthukumar S, Shen H, Zhong J, et al. Selective MOCVD growth of ZnO nanotip. IEEE Trans Nanotechnol. 2003;2:50-8.
- Wang C, Guan L, Mao Y, et al. Optical nonlinearity of ZnS–polyvinyl pyrrolidone nanocomposite suspension. J. Phys D: Appl Phys. 2009;42:45403.
- Wang CE, Shen E, Gao WL. Controllable synthesis of ZnO nanocrystals via a surfactant-assisted alcohol thermal process at a low temperature. Mater Lett. 2005;59:2867-71.
- Ajji Z. Grafting of poly (vinyl pyrrolidone) with citric acid using gamma irradiation. Nucl Instrum. Methods Phys Res B. 2007;265:179-82.
- Yuliah Y, Bahtiar A. Synthesis and characterization of PVP-capped ZnO particles and its blend with poly (3-hexylthiophene) for hybrid solar cells application. Padjadjaran Int Phys Symp. (PIPS-2013) AIP Conf Proc. 2013;1554:139-42.
- Kim JH, Choi WC, Kim HY, et al. Preparation of mono-dispersed mixed metal oxide micro hollow spheres by homogeneous precipitation in a micro precipitator. Powder Technol. 2005;153:166-75.
- Yu ZJ, Rajesh Kumar M, Sun DL, et al. Large scale production of hexagonal ZnO nanoparticles using PVP as a surfactant. Mater Lett. 2016;166:284-87.
- Cao JM, Wang J, Fang BQ, et al. Microwave-assisted synthesis of flower-like ZnO nanosheet aggregates in a room-temperature ionic liquid. Chem Lett. 2004;33:1332-3.
- Chen SJ, Liu YC, Shao CL, et al. Structural and optical properties of uniform ZnO nanosheets. Adv Mater. 2005;17:586-90.
- Cao G. Nanostructures and nanomaterials: Synthesis, properties and applications. Imper Coll Press. London. 2006.
- Nagao M. Physisorption of water on zinc oxide surface. J Phys Chem. 1971;75:3822-8.
- Lili WU, Youshi WU, Yuanchang SHI, et al. Synthesis of ZnO nanorods and their optical absorption in visible-light region. Rare Metal. 2006;25:68-73.
