Research
, Volume: 19( 1) DOI: 10.37532/0974-7419.2019.19(1).147Stability Indicating RP-HPLC for Simultaneous Estimation of Metoprolol and Ranolazine and Quantification in Marketed Formulations
- *Correspondence:
- Vennapu DR Department of Pharmaceutical Chemistry KLE's University College of Pharmacy, Belagavi, 590001, India, E-Mail: dushyanthreddy233@gmail.com
Received: September 11, 2018; Accepted: January 28, 2019; Published: February 04, 2019
Citation: Vennapu DR, Palled MS. Stability Indicating RP-HPLC for Simultaneous Estimation of Metoprolol and Ranolazine and Quantification in Marketed Formulations. Anal Chem Ind J. 2019;19(1):147.
Abstract
A simple, rapid, precise and accurate RP-HPLC method has been developed for estimation of newer Anti-anginal drugs Metoprolol and Ranolazine through single as well as simultaneous estimation. HPLC instrumentation used was AGILENT (1100), CHEMSTATION software, column used was PRIMESIL (C18, 4.6 × 250 mm length, 5µm). Mobile phase used was Methanol: 0.05% and 0. 1% OPA Water (40:60, 50:50 and 45:55) at flow rate of 0.7 ml/min and 1.0 ml/min wavelength was selected at 224nm, 225nm and 230nm. The recovery studies of the method gave good results in the range of 99.89% to 100.48% with less than 2% of RSD.
Keywords
Metoprolol; Ranolazine ; RP-HPLC; Simultaneous estimation; Validation
Introduction
Metoprolol is a cardio selective β1-adrenergic blocking agent used for acute myocardial infarction (MI), heart failure, angina pectoris and mild to moderate hypertension. It may also be used for supra ventricular and tachyarrhythmia’s and prophylaxis for migraine headaches. Metoprolol selectively blocks cardiac β1-adrenergic receptors with little activity against β2-adrenergic receptors of the lungs and vascular smooth muscle. Metoprolol possesses a single chiral Centre and is administered as a racemic mixture. Ranolazine is an antianginal medication (FIG. 1).
Mobile phase
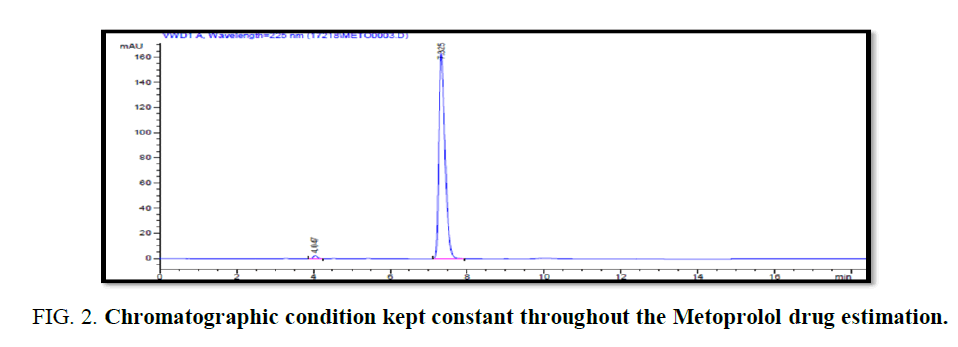
Methanol: 0.05% OPA WATER 40:60 with 225 nm at 0.7 mL/min at 20μl size. The peaks were well defined with good resolution. Therefore the following chromatographic condition kept constant throughout the Metoprolol Drug estimation (FIG. 2).
Assay methodology: Peak Area of Internal Standard/Peak Area of API (or) Analyte=F (Conc of Internal Standard/Conc of API (or) Analyte.
Alternatively a known quantity of API/Analyte is spiked and the standard sample and sample of interest is compared with the peak area. The developed method is so robust that both single API as well as simultaneously the sample can be assayed using standard addition method or variant of peak area analysis [1-8].
Preparation of diluents: Methanol and 0.5% OPA Water in the ratio of 40:60 is used.
Preparation of standard solution: Standard Metoprolol 10 mg in 10 ml Methanol solution=1000 μgm/mL Metoprolol solution-Stock-1. Serial dilutions of 20 μgm/mL, 30 μgm/mL, 40 μgm/mL, 50 μgm/mL and 60 μgm/mL Metoprolol from stock.
Preparation of sample solution: Total weight of 20 t Powder weight=3.134 gms. Average Powder Weight=0.1567 gms/t. Equivalent Weight for 10 mg=10 × 156.7/50=31.34 mg. Take 31.34 mgs in 10 ml methanol i.e.=1000 μgm/mL Metoprolol.
Ranolazine Drug Estimation
Chromatographic conditions of trials
Mobile phase was MeOH: 0.05% OPA 50:50 with 225 nm at 0.7 mL/min at 20 μl size, peaks well defined.
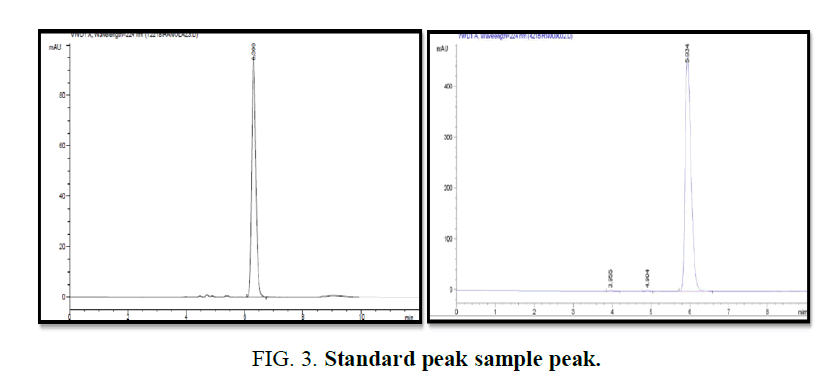
Preparation of mobile phase: Mixture of Methanol and 0.05% OPA Water is used in the ratio 50:50. Preparation of standard solution Standard Ranolazine 10 mg in 10ml of Methanol=1000 μgm/mL Ranolazine-Stock-1. Hence serial dilutions of 2 μg/ml, 5 μg/ml, 10 μg/ml, 15 μg/ml, 20 μg/ml, 25 μg/ml and 30 μg/ml Ranolazine respectively from stock. Preparation of sample solution Total weight of 20 t Powder weight=15.3240 gms Average Powder Weight=0.7662 gms/t. Equivalent weight for 10 mg=10 × 766.2/500=15.32 mg Take 15.32 mgs in 10 ml Methanol=1000 μgm/mL Ranolazine (FIG. 3).
Metoprolol and Ranolazine Drugs Simultaneous Estimation
Mobile phase methanol
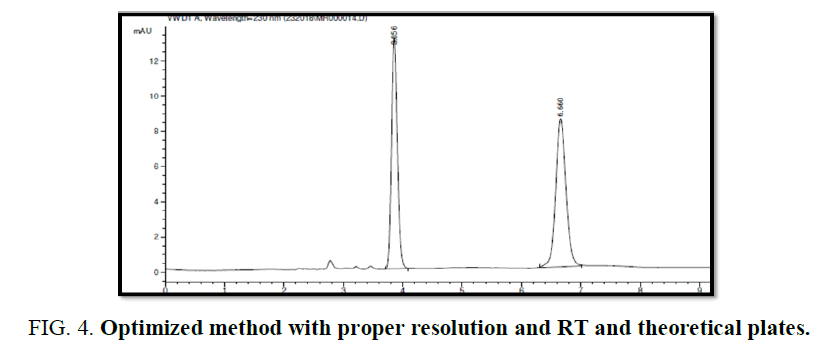
0.1% OPA WATER 45:55 with 225 nm at 1 mL/min at 10 μl size.
Chromatographic condition Trail 1 and 2 (FIG. 4).
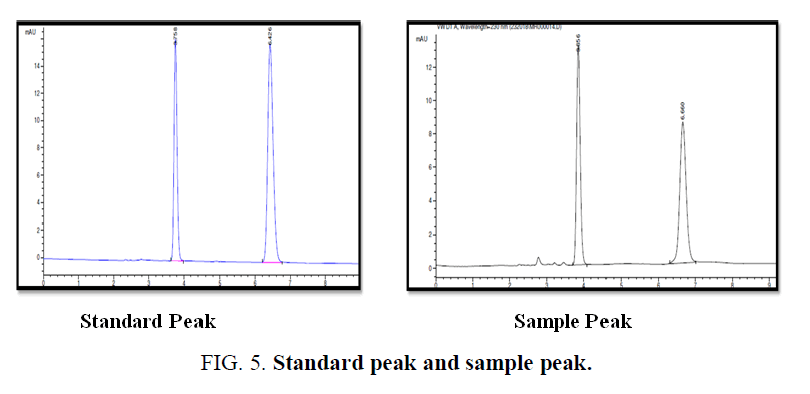
Preparation of mobile phase mixture of methanol and 0.1% OPA water in ratio 4:55 (FIG. 5).
Metoprolol Drug Estimation
Precision
Precision (system precision) was determined by inter day precision and intraday precision. Relative Standard Deviation (RSD) was calculated for both six injections and found in 2% (TABLE 1).
| Intraday Precision | |||||||
|---|---|---|---|---|---|---|---|
| Conc. µgm/ml | Area | II | Mean | Amt found | % Amt found | SD | % RSD |
| 10 | 360.5 | 359.44 | 359.97 | 10.10 | 101.02 | 0.75 | 0.21 |
| 30 | 1119.11 | 1120.04 | 1119.58 | 30.49 | 101.65 | 0.66 | 0.06 |
| 60 | 2231.61 | 2230.47 | 2231.04 | 60.01 | 100.02 | 0.81 | 0.04 |
| Inter day Precision | |||||||
| 10 | 359.9 | 359.33 | 359.61 | 10.09 | 100.90 | 0.40 | 0.11 |
| 30 | 1118.63 | 1116.21 | 1117.42 | 30.43 | 101.43 | 1.71 | 0.15 |
| 60 | 2220.91 | 2230.47 | 2225.69 | 60.07 | 100.12 | 6.76 | 0.30 |
TABLE 1. Precision of Metoprolal drug.
Conclusion
The parametric value not to true value on repeated experimentation. The inter day and intraday precision studies were conducted in three different concentrations of the standard (initial, medium and final concentrations) 10 μgm/ml, 30 μgm/ml and 60 μgm/ml in triplicate in a day and on three consecutive days, analysis of sample and standard are in accordance with ICH 21 CFR guidelines and the method is robust. The value of RSD for Metoprolol drug found to be less than 2% assay was 100% to 103%.
Accuracy
Accuracy was determined by the assay 80%, 100% and 120% in the accuracy the amount of drug at each concentration was calculated and the % recovery was determined by using the formula.
% Recovery=(Amount Recovered)/(Amount added) × 100 (TABLE 2).
| 80% | |||||
|---|---|---|---|---|---|
| Conc. µgm/ml | Spiked conc. | Area | Amount | % Recovered | |
| found | recovered | ||||
| 10 | 8 | 650.96 | 17.91 | 7.91 | 98.93 |
| 10 | 8 | 651.87 | 17.93 | 7.93 | 99.23 |
| Mean | 17.92 | 7.92 | 99.08 | ||
| SD | 0.01 | 0.01 | 0.21 | ||
| % RSD | 0.05 | 0.13 | 0.21 | ||
| 100% | |||||
| 10 | 10 | 722.94 | 19.84 | 9.84 | 98.46 |
| 10 | 10 | 725.99 | 19.92 | 9.92 | 99.28 |
| Mean | 19.88 | 9.88 | 98.87 | ||
| SD | 0.06 | 0.06 | 0.58 | ||
| % RSD | 0.3 | 0.6 | 0.59 | ||
| 120% | |||||
| 10 | 12 | 798.66 | 21.87 | 11.87 | 98.99 |
| 10 | 12 | 79928 | 21.89 | 11.89 | 99.13 |
| Mean | 21.88 | 11.88 | 99.06 | ||
| SD | 0.01 | 0.01 | 0.1 | ||
| % RSD | 0.05 | 0.09 | 0.1 | ||
TABLE 2. Accuracy.
Conclusion: The measurement of true value on repeated experimentation. The interday/intraday precision studies were conducted by using three different concentrations of the standard (initial, medium and final concentrations) 10 μgm/ml, 30 μgm/ml and 60 μgm/ml in triplicate in a day and on three consecutive days. Analysis' of sample and standard are in accordance with ICH 21 CFR guidelines the mean % Recovery of Metoprolol was found to be 98% to 103.
Robustness
A study was conducted in change in flow rate, wavelength change, and mobile phase ratio variation. The system study parameters were evaluated (TABLE 3).
| Flow Rate 0.6 mL/min | Flow Rate 0.8 mL/min | ||||
|---|---|---|---|---|---|
| Sr No | Conc. µgm/ml | Area | Sr No | Conc. µgm/ml | Area |
| 1 | 60 | 2569.62 | 1 | 60 | 1952.85 |
| 2 | 60 | 2574.23 | 2 | 60 | 1951.27 |
| Mean | 2571.93 | Mean | 1952.06 | ||
| SD | 3.26 | SD | 1.12 | ||
| % RSD | 0.13 | % RSD | 0.06 | ||
| Mobile Phase 39+61 ml water | Mobile Phase 41+59 ml Water | ||||
| 1 | 60 | 2257.13 | 1 | 60 | 2262.39 |
| 2 | 60 | 2251.28 | 2 | 60 | 2254.54 |
| Mean | 2254.2 | Mean | 2258.47 | ||
| SD | 4.14 | SD | 5.55 | ||
| % RSD | 0.18 | % RSD | 0.25 | ||
| Wavelength Change 224 nm | Wavelength Change 226 nm | ||||
| 1 | 60 | 2299.37 | 1 | 60 | 2292.36 |
| 2 | 60 | 2299.1 | 2 | 60 | 2292.86 |
| Mean | 2299.2 | Mean | 2292.61 | ||
| SD | 0.19 | SD | 0.35 | ||
| % RSD | 0.01 | % RSD | 0.02 | ||
TABLE 3. Robustness.
Conclusion: Robustness studies emphasis any changes in the analysis parameters say mobile phase composition, change in flow rate and detection wavelength. During initial stages of development of method, the method was subjected to small changes and the effect of small changes in method on the detection of analyte with regards to theoretical plates, RT values and stability etc. The % RSD for peak areas of all chromatograms of change in flow rate, mobile phase ratio and wavelength is found to be less than 2% and it is under acceptance criteria. The method is robust to analyse the analytes of interest with acceptable fudicial limits as per the ICH 21 CFR guidelines.
Specificity
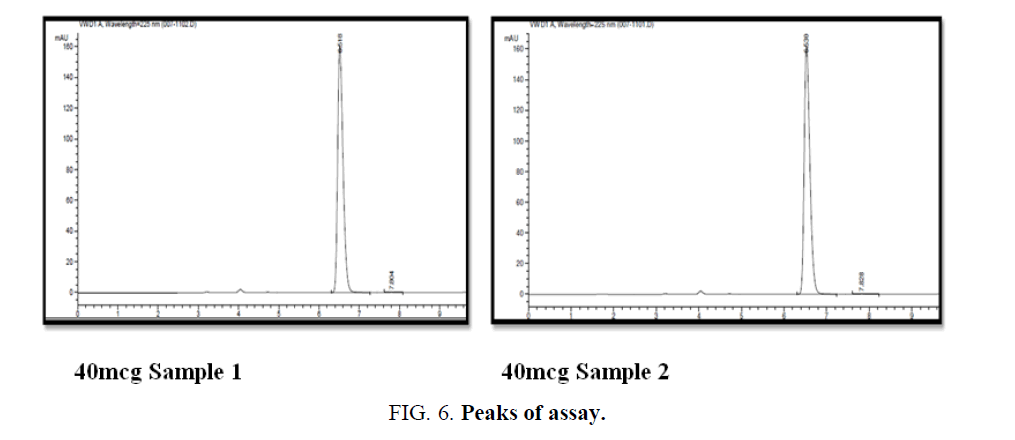
Standard solutions was prepared and injected in HPLC system as per the test method (TABLE 4 and FIG. 6).
| Conc. | Area | Amt. found | % Claim |
|---|---|---|---|
| 40 | 1501.89 | 40.75 | 101.88 |
| 40 | 1504.82 | 40.83 | 102.08 |
| Mean | 1503.36 | 39.67 | 101.98 |
| SD | 2.07 | 0.06 | 0.01 |
| % RSD | 0.14 | 0.14 | 0.01 |
TABLE 4. Specificty.
Specificity: The measurement of specificity in the presence of invariant excepients in the formulations were studied in the marketed formulations as well as API's the method is specific and selective for the analyte of interest with triplicate data analysis following. The % claim mean was found to 101.98%, and it is under criteria as per ICH 21 CFR guidelines within the permissible limits of interest.
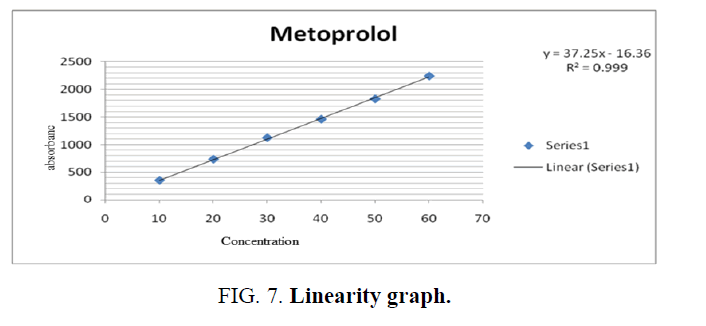
Linearity and range: Linearity is calculated in 6 concentrations of the analyte under test conditions.(10 mcg, 20 mcg, 30 mcg, 40 mcg, 50 mcg, 60 mcg). The graph was plotted between the peak area and concentration in ppm and the correlation coefficient was calculated (TABLE 5 and FIG. 7).
| Sr. No . | Conc. | Area I | Area II | Mean | SD | % RSD |
|---|---|---|---|---|---|---|
| 1 | 10 | 350.42 | 351.03 | 350.72 | 0.43 | 0.12 |
| 2 | 20 | 731.47 | 732.59 | 732.03 | 0.79 | 0.11 |
| 3 | 30 | 1123.78 | 1123.67 | 1123.725 | 0.08 | 0.01 |
| 4 | 40 | 1457.58 | 1458.84 | 1458.21 | 0.89 | 0.06 |
| 5 | 50 | 1824.51 | 1824.26 | 1824.385 | 0.18 | 0.01 |
| 6 | 60 | 2235.9 | 2236.56 | 2236.23 | 0.47 | 0.02 |
Avg SD 0.47
TABLE 5. Linearity and range.
Conclusion: Linearity graph showed a straight line and correlation coefficient was found to be greater than 0.9950.
Limit of detection (LOD): As per Linearity chart
Average standard deviation=0.47 and Slope=37.25 LOD=0.0416.
Limit of Quantification (LOQ): As per Linearity chart
Average standard deviation=0.47 and Slope=37.25 LOQ=0.1261.
Conclusion: LOD and LOQ were in range of acceptance criteria.
Ruggedness
It is calculated by same concentration of the analyte by different analyst. using the operational and environmental conditions that may differ but are in the specified parameters of the assay (TABLE 6).
Conclusion: The expertise of ruggedness or endurance to the developed method to sustainability upon multiple users/analyst. The difference shown in the result of different analyst is showing less than 2%. and it is under criteria as per ICH 21 CFR guidelines within the permissible limits of interest.
Forced degradation
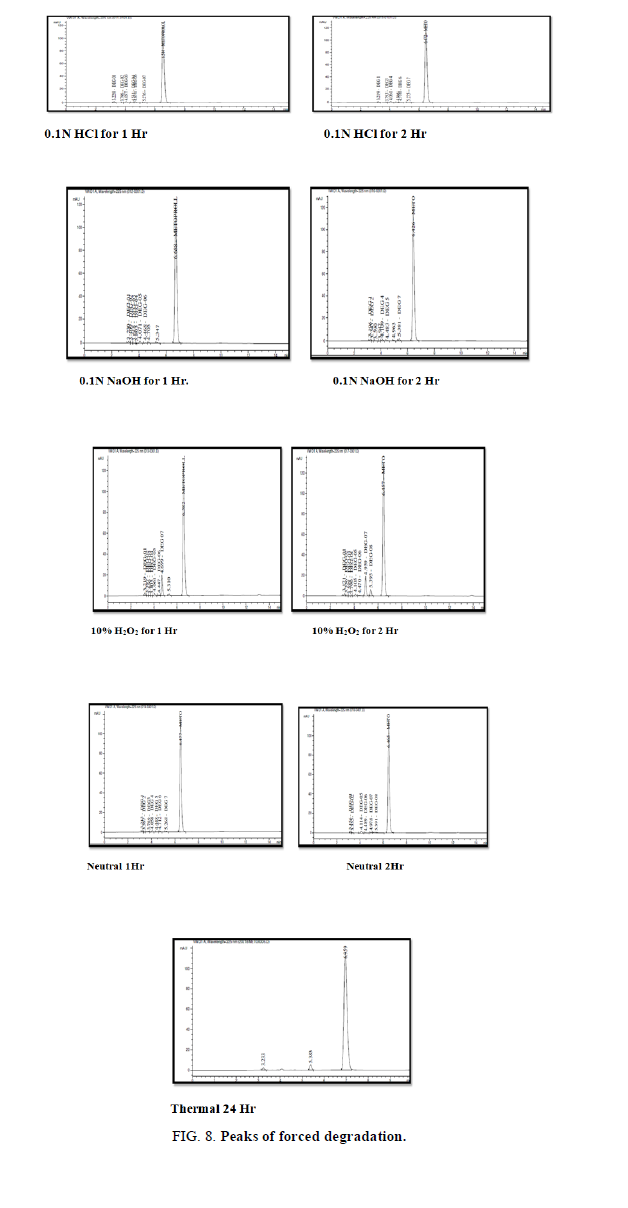
It is studied under treatment of analyte solution with 0.1N HCl, 0.1N NaOH, 10% H2O2, neutral and thermal conditions (TABLE 7 and FIG. 8).
(The small peaks or signals are the Related Substance Impurity) as per the Pharmacopeia however the lack of Pure standards the same is not quantified and specified in the data set. Percentage Degradation of the drug Metoprolol was found in acceptance criteria.
Ranolazine Drug Estimation
Precision
Conclusion
The value of RSD for Ranolazine drug found to be less than 2, in acceptance criteria. The values found for % assay was 98% to 103%, in acceptance criteria (TABLE 8).
Accuracy
Accuracy was determined by the assay 80%, 100% and 120% in the accuracy the amount of drug at each concentration was calculated and the % recovery was determined by using the formula (TABLE 9).
% Recovery=(Amount Recovered)/(Amount added) × 100
Conclusion: The mean % Recovery of Ranolazine was found to be 97% to 103% which falls under acceptance criteria.
Robustness
A study was conducted in change in flow rate, wavelength change, mobile phase ratio variation. The system study parameters were evaluated (TABLE 10).
Conclusion: The % RSD for peak areas of all chromatograms of change in flow rate, mobile phase ratio and wavelength is found to be less than 2% and it is under acceptance criteria.
Specificity
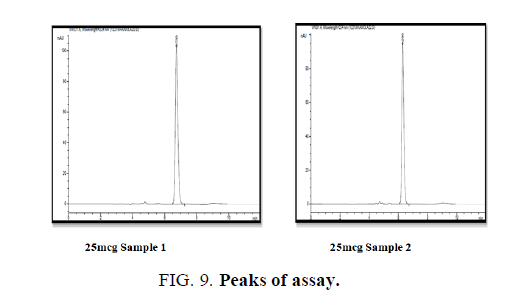
Standard solutions was prepared and injected into the HPLC system as per the test method. % assay calculated (TABLE 11).
Conclusion: The % claim mean of Ranolazine was found to 99.08%, and it is under acceptance criteria (FIG. 9).
Linearity
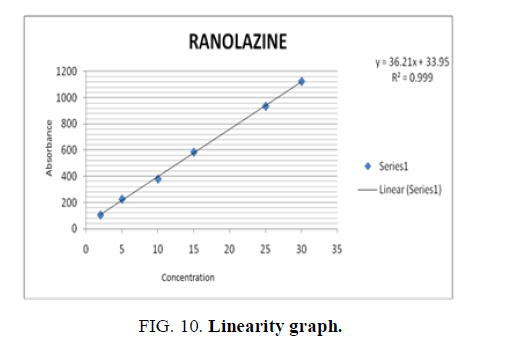
Linearity is calculated in 6 concentrations of the analyte under test conditions. (2 mcg, 5 mcg, 10 mcg, 15 mcg, 25 mcg, 30 mcg). The graph was plotted between the peak area and concentration in ppm and the correlation coefficient was calculated (TABLE 12 and FIG. 10).
Conclusion: Linearity graph showed a straight line and correlation coefficient was found to be greater than 0.9950.
Limit of detection (LOD): As per linearity,
Average standard deviation=0.51 and Slope=33.95 LOD=3.3× 0.51 / 33.95=0.0827.
Limit of quantitation (LOQ): As per linearity,
Average Sd=0.51 and Slope=33.95 Therefore LOQ=10 × Avg.sd / Slope LOQ=0.1516.
Conclusion: LOD and LOQ were in range of acceptance criteria.
Ruggedness
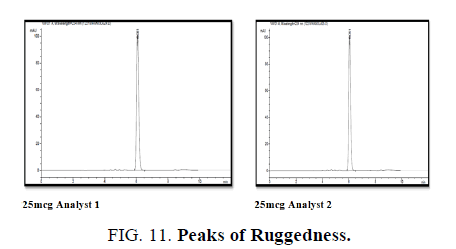
It is calculated by same concentration of the analyte by different analyst. Using the operational and environmental conditions that may differ but are in the specified parameters of the assay (TABLE 13 and FIG. 11).
Conclusion: The difference shown in the result of different analyst is showing less than 2%.
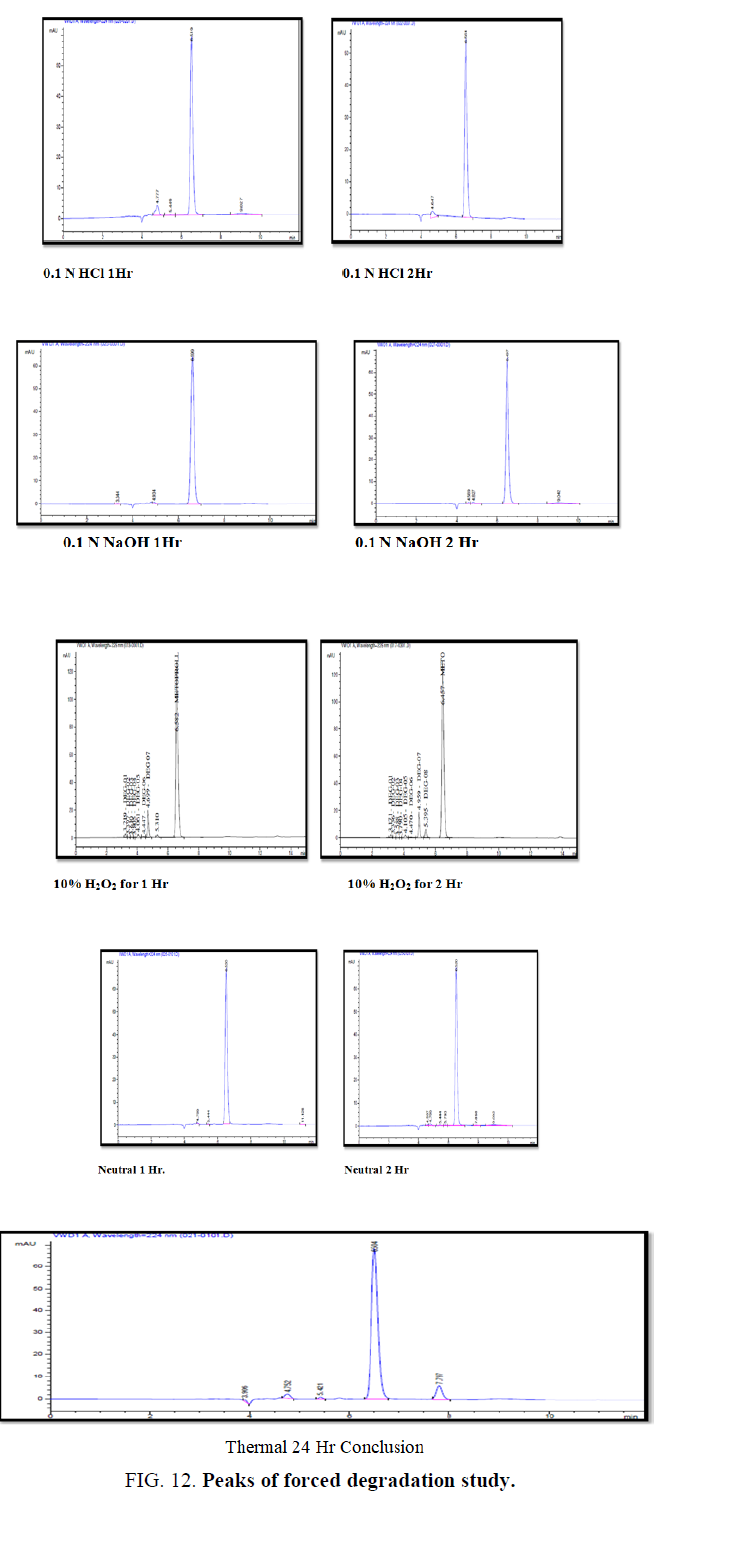
Forced degradation
% Degradation of the drug Ranolazine was found in acceptance criteria (TABLE 14 and FIG. 12).
Metoprolol and Ranolazine Simultaneous Estimation
Mobile phase of methanol
0.1% OPA Water (45:55) with a flow rate of 1.0 mL/min on PRIMESIL 5μm (250 mm × 4.6 mm) Column at ambient temperature at 230 nm (TABLE 15).
Precision
Conclusion
The value of RSD for both the drug found to be less than 2, in acceptance criteria. The values found for % assay was 98% to 103%, in acceptance criteria.
Accuracy of metoprolol
Conclusion: % Recovery of both drugs was found to be 97% to 103% which found in acceptance criteria (TABLES 16 and 17).
Specificity
Assay was performed as per test condition (TABLE 18).
Conclusion: The mean % claim of both drugs was found to be 100% in acceptance criteria.
Linearity
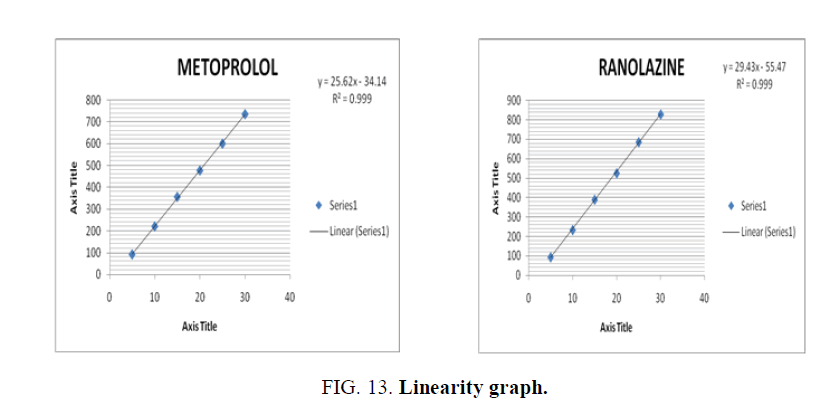
Linearity is calculated in 6 concentrations of the analyte under test conditions.(5 mcg, 10 mcg, 15 mcg, 20 mcg, 25 mcg, 30 mcg). The graph was plotted between the peak area and concentration in ppm and the correlation coefficient was calculated (FIG. 13).
Linearity graph showed a straight line and correlation coefficient was found to be greater than 0.9950.
Limit of detection (LOD): As per Linearity, METOPROLOL and RANOLAZINE
Average standard deviation=0.6, 0.59 and slope=25.62, 29.43, LOD=0.77. and 0.066.
Respectively,
Limit of quantification (LOQ): As per linearity,
Metoprolol: Average Standard deviation=0.6 and slope=25.62 LOQ=0.23.
Ranolazine: Average Standard Deviation=0.59 and slope=29.43 LOQ=0.2004.
Inference LOD and LOQ were in range of acceptance criteria.
Conclusion
The developed method for analyzing the Ranolazine and Metoprolol individually as simultaneously adhering to ICH guidelines developed analytical method is robust in Quantification of API's.
References
- Tsvetkova BG, Peikova LP. Determination of metoprolol tartarate and hydrochlorothiazide in t dosage form by High Performance Liquid Chromatography. J Chem Pharm Res. 2013;5:168-71
- Jain N, Sharma BK, Jain R, et al. RP-HPLC method development and validation for quantitative estimation of metoprolol succinate and telmisartan in bulk drug and their dosage forms. J Pharm Biomed Sci. 2012;24:102-6.
- Tsvetkova BG, Pencheva IP, Peikov PT. Development and validation of RP-HPLC method for simultaneous determination of Metoprolol and Aspirin in fixed dose combinations. Der Pharma Chemica. 2012;4:1512-6.
- Shaikh B, Ushasri S, Nissankarao S, et al. A new RP-HPLC method development and validation for simultaneous estimation of Metoprolol Tartrate and Telmisartan in pharmaceutical tablet dosage form. IJRRPAS. 2013;633-45.
- Jasti V, Murukutla V, Nekkalapu SS. Rapid RP-HPLC method for simultaneous separation and estimation of Metoprolol and Amlodipine in combination t formulation. Int Res J Pharm. 2013;160-5.
- Durga BK, Mounika NI, Shajan SK, et al. RP-HPLC method for the estimation of Metoprolol in Bulk Drug. IJSID. 2011;1:151-7.
- Rao VL, Vardhan SVM, Rao VVS, et al. Validated RP-HPLC method for estimation of Metoprolol Succinate in dosage formulations. Am J Pharm Tech Res. 2013;3:329-34.
- Palled PJ, Dushyanth Reddy V, Mannor VS. Validated isocratic/gradient RP-HPLC for simultaneous estimation of paracetamol ibuprofen and caffeine in marketed formulations using diclofenac as internal standard. Anal Chem Ind J. 2017;17:116.

