Original Article
, Volume: 16( 14)Simultaneous Determination of Metronidazole and Furazolidone in Combined Tablet Dosage Form: Development and Validation of a Stability Indicating HPLC Method
- *Correspondence:
- Murali D, Department of Biochemistry, Acharya Nagarjuna University, Guntur, Andhra Pradesh 522510, India, E-mail: murali.dadi@gmail.com
Received: 16 May, 2016; Accepted: 20 June, 2016; Published: 25 June, 2016
Citation: Murali D, Rambabu C. Simultaneous Determination of Metronidazole and Furazolidone in Combined Tablet Dosage Form: Development and Validation of a Stability Indicating HPLC Method. Anal Chem Ind J. 2016;16(14):101.
Abstract
A sensitive, precise and accurate stability-indicating HPLC with ultra violet detection method has been developed for simultaneous determination of metronidazole and furazolidone. Chromatographic separation was achieved on a Purospher® Star RP-18 column (250 mm × 4.6 mm; 5 μm particle size) by a mobile phase consisted of acetonitrile and water (90:10, v/v) with a flow rate of 0.8 mL/min. The detection wavelength was set at 332 nm. Metronidazole and furazolidone was subjected to different forced degradation conditions. In all the conditions, the degradation products were well resolved from the peaks of metronidazole and furazolidone. The method was linear at a concentration range of 30 μg/mL to 90 μg/mL (R2=0.9999) and 10 μg/mL to 30 μg/mL (R2=0.9996) for metronidazole and furazolidone, respectively. The limit of quantitation was 0.793 μg/mL and 0.230 μg/mL for metronidazole and furazolidone, respectively. The precision of the method was satisfactory; the relative standard deviations values did not exceed 1%. The accuracy of the method was proved; the mean recovery of metronidazole and furazolidone was in the range of 99.66% to 100.28%. The developed and validated method was applied successfully for the assay of metronidazole and furazolidone in combined tablet dosage with good precision and accuracy.
Keywords
Metronidazole; Furazolidone; Stability indicating; HPLC; Tablet; Quantification
Introduction
Metronidazole is a synthetic derivative of nitroimidazole with antibacterial and antiprotozoalactivities [1,2]. Chemically it is known as 2-(2-methyl-5-nitroimidazol-1-yl) ethanol. Metronidazole is used in the treatment of trichomoniasis, amebiasis, giardiasis, anaerobic bacterial infections, Crohn's disease, antibiotic-associated diarrhea and rosacea [3].
Furazolidone is a derivative of nitrofuran with antibacterial and antiprotozoal activities [4-6]. Chemically it is described as 3-[(E)-(5-nitrofuran-2-yl) methylideneamino]-1,3-oxazolidin-2-one. Furazolidone is prescribed to treat cholera, diarrhea and enteritis caused by susceptible bacteria or protozoa [7]. In children, it is often used in the treatment of giardiasis [8].
The combination of metronidazole and furazolidone is available in the market as tablet dosage form or as oral suspension [9]. This combination is effective in the treatment of amoebiasis, trichomoniasi, giardiasis, bacterial vaginosis, cholera, bacterial or mixed origin of bacillary dysentery. Few techniques are found in the literature for the simultaneous determination of metronidazole and furazolidone in bulk and pharmaceutical dosage forms. Kale et al. [10], Chemate et al. [11] and Basu and Mahalanabis [12] have determined metronidazole and furazolidone simultaneously using UV spectrophotometry. Though the spectrophotometric methods are simple, they suffer from lack of selectivity.
Elena and Milea [13] have developed an isocratic HPLC procedure for quantitative determination of metronidazole and furazolidone. The chromatographic separation was done using Kromasil C18 (250 mm × 4.6 mm; 5 μm particle size) analytical column with mobile phase consisted of methanol and 0.1% phosphoric acid (20:80 v/v), run at flow rate of 1 mL/ min. The detection was at 317 nm. A stability-indicating HPLC method for the analysis of metronidazole, furazolidone and its degradation products was developed by Kumar et al. [14]. Separation of metronidazole and furazolidone from its degradation products was achieved by using a mobile phase consisting of acetonitrile, methanol and phosphate buffer (10:40:50 v/v/v) through an XTerra C18 column (150 mm × 4.6 mm; 5 μm particle size) at a flow rate of 1 mL/min with UV-detection at 270 nm.
The present study describes the development and validation of a stability indicating HPLC method for quantitative determination of metronidazole and furazolidone simultaneously in the presence of its degradation products. The applicability of the proposed method was evaluated by the determination of metronidazole and furazolidone in tablet formulations. The summary of reported and proposed HPLC methods is summarized in Table 1. From the data, it was found that the proposed method has the advantages of being more sensitive, precise and accurate than the reported HPLC methods [13,14]. The use of less flow rate and binary solvent system make the proposed method economical [13,14]. Furthermore, the method reported by Kumar et al. [14] is not applied to combined formulation and Elena and Milea [13] method is not stability indicating.
| Drug | Flow rate (ml/min) | LOD (μg/ml) | LOQ (μg/ml) | Recovery (%) | RSD (%) | Reference |
|---|---|---|---|---|---|---|
| Metronidazole | 1.0 | 0.8 | 2.7 | 102.75 | 1.658 | 13 |
| Furazolidone | 0.7 | 2.3 | 88.41 | 0.894 | ||
| Metronidazole | 1.0 | 4.637 | 14.053 | 99.98 | 0.1 | 14 |
| Furazolidone | 1.7798 | 5.3935 | 98.34 | 1.3 | ||
| Metronidazole | 0.8 | 0.262 | 0.793 | 99.96 | 0.193 | proposed |
| Furazolidone | 0.076 | 0.230 | 100.02 | 0.058 |
Table 1: Comparison between the reported and proposed methods.
Materials and Methods
Instrumentation
HPLC apparatus consisted of Shimadzu HPLC class LC series equipped with two LC-10 AT, VP pumps and variable wavelength programmable UV detector. Peak areas were integrated using a Shimadzu LC solution software program. The chromatographic separation and quantification were performed on Purospher® Star RP-18 (250 mm × 4.6 mm; particle size 5 μm) analytical column maintained at room temperature. The mobile phase, drug standard solutions, tablet sample solutions and forced degradation samples were filtered through a millipore membrane filter before injection into the HPLC system.
Drugs, chemicals and solvents
The reference standards of metronidazole and furazolidone were obtained from Remedix Pharmaceuticals (Bangalore, India) as gift samples. Dependal M tablets (Glaxo Smithkline Pharmaceuticals Ltd. India) claimed to contain 100 mg of furazolidone and 300 mg of metronidazole were used in this study. Hydrochloric acid, sodium hydroxide and hydrogen peroxide of analytical reagent grade were from Sdfine-Chem limited (Mumbai, India). Acetonitrile of HPLC grade was from Merck India Limited (Mumbai, India). Milli-Q-water was used throughout the analysis.
Chromatographic conditions
Mobile phase : Acetonitrile: Water (90:10 v/v)
Flow rate : 0.8 mL/min
Detection wavelength : 332 nm
Column temperature : Room temperature
Injection volume : 20 μL
Run time : 12 min
Standard drug solution
The mobile phase was used as solvent for the preparation of standard solutions. Standard stock solution of metronidazole (600 μg/mL) and furazolidone (200 μg/mL) was prepared by dissolving an accurately weighed amount of metronidazole (30 mg) and furazolidone (10 mg) in 25 mL of mobile phase in 50 mL volumetric flask. The flask was then made up to the mark with mobile phase. The stock solution was diluted aptly with mobile phase to prepare the working standard solutions of metronidazole (30, 45, 60, 75 and 90 μg/mL) and furazolidone (10, 15, 20, 25, and 30 μg/mL).
Tablet sample solution
Ten tablets were weighed and finely powdered. Stock solution (metronidazole 600 μg/mL and furazolidone 200 μg/mL) was prepared by dissolving tablet powder equivalent to 30 mg metronidazole and 10 mg furazolidone in 25 mL of mobile phase in a 50 mL volumetric flask and sonicated for 5 min. The solution was filtered using millipore membrane filter and the resulting solution was diluted to the mark with mobile phase. The stock solution was diluted appropriately with mobile phase to obtain concentration equal to 60 μg/mL of metronidazole and 20 μg/mL of furazolidone for analysis.
Calibration curve
Calibration curves of the proposed method were prepared over concentration ranges of 30 μg/mL to 90 μg/mL for metronidazole and 10 μg/mL to 30 μg/mL for furazolidone. Each solution was prepared in triplicate and 20 μl of each solution was injected onto the column. The peaks were determined at 332 nm. The calibration curves of metronidazole and furazolidone were constructed by plotting the peak area vs concentration.
Assay of metronidazole and furazolidone in tablets
Twenty μl of the tablet sample solution (metronidazole 60 μg/mL and furazolidone 20 μg/mL) was injected into the HPLC system thrice. The peak areas of the drugs were determined at 332 nm. The concentration of drugs in the tablet was determined either from the corresponding calibration curve or from the corresponding regression equation.
Stress degradation studies
Stress degradation studies was carried out using different ICH prescribed stress conditions such as acidic, basic, oxidative, thermal and photolytic stresses [15].
Acid degradation
Tablet powder equivalent to 60 mg of metronidazole and 20 mg of furazolidone was taken in 100 mL volumetric flask. Five mL of 0.1 N HCl was added to the flask and kept at 80°C reflux condition for 2 h. After completion of the stress, the solution was neutralized by using 0.1 N NaOH and completed up to the mark with mobile phase.
Base degradation
Tablet powder equivalent to 60 mg of metronidazole and 20 mg of furazolidone was taken in 100 mL volumetric flask. Five mL of 0.1 N NaOH was added in the flask and kept at 80°C reflux condition for 2 h. After completion of the stress, the solution was neutralized by using 0.1N HCl and completed up to the mark with mobile phase.
Oxidative degradation
Tablet powder (equivalent to 60 mg of metronidazole; 20 mg of furazolidone) and 5 mL of 20% H2O2 were added in 100 mL volumetric flask. The flask was kept at 80°C reflux condition for 2 h. After completion of the stress, the flask was completed up to the mark with mobile phase.
Thermal degradation
For this, tablet powder (equivalent to 60 mg of metronidazole; 20 mg of furazolidone) was taken in glass petri dish and placed in hot air oven at 105°C for 2 h. After specified time, the tablet powder was transferred to a 100 mL volumetric flask and made up to the mark with mobile phase.
Photolytic degradation
For photolytic degradation study, tablet powder equivalent to 60 mg of metronidazole and 20 mg of furazolidone was transferred into a glass petri dish and placed in the direct sunlight for 2 h. After completion of the stress, the tablet powder was transferred to a 100 mL volumetric flask and made up to the mark with mobile phase.
Results and Discussion
Optimization of HPLC conditions
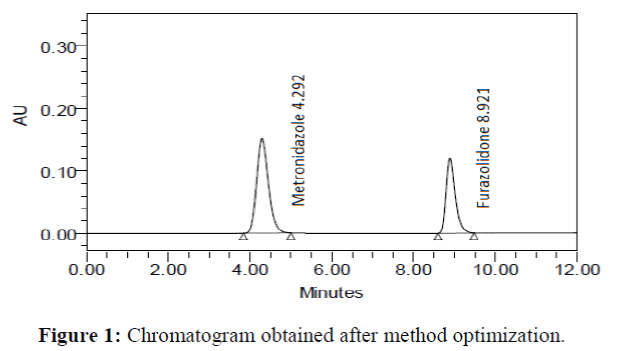
The chromatographic conditions were optimized to separate all the possible degradation products from the peak of metronidazole and furazolidone. During the process of HPLC method optimization, several trials were taken using a different column, different organic phase and different flow rates. Good peak shape was observed when using Purospher® Star RP-18 (250 mm × 4.6 mm; particle size 5 μm) analytical column and acetonitrile: water (90:10 v/v) as the mobile phase at a flow rate of 0.8 mL/min. The effluents were monitored at 332 nm. The retention times for metronidazole and furazolidone were 4.292 min and 8.921 min, respectively (Figure 1).
Method validation
System suitability, linearity, sensitivity, precision, accuracy, selectivity, specificity, robustness and ruggedness were performed as the method validation parameters as per ICH guidelines [16].
System suitability
The system suitability studies were performed using the working standard solution containing metronidazole (60 μg/mL) and furazolidone (20 μg/mL) by five repeated injections with the optimized method. The results are summarized in Table 2. These results met the method requirements for separation and quantification of metronidazole and furazolidone simultaneously.
| Parameters | Value | Recommended limits | |
|---|---|---|---|
| Metronidazole | Furazolidone | ||
| Retention time | 4.274(%RSD – 0.876) | 8.931(%RSD – 0.401) | RSD ≤2 |
| Peak area | 6690755(%RSD – 0.608) | 4211712(%RSD – 0.167) | RSD ≤2 |
| USP plate count | 13709.6 | 6683.4 | >2000 |
| USP tailing factor | 1.094 | 1.094 | ≤ 2 |
| Resolution | - | 11.694 | > 3 |
Table 2: System suitability.
Linearity and range
Under the optimized experimental conditions, a linear relationship was established by plotting the peak area of drug against the drug concentration (μg/mL). The concentration range was found to be 30 μg/mL to 90 μg/mL for metronidazole and 10 μg/mL to 30 μg/mL for furazolidone. Linear regression analysis of the data gave the following equations:
y = 11151x + 855.3 (R2 = 0.9999) for metronidazole
y = 21064x - 4041.0 (R2 = 0.9996) for furazolidone
Where: y = peak area, x= concentration of the drug (μg/mL) and R2 = Regression coefficient. The high values of regression coefficients with small intercept indicate the good linearity of the calibration curves.
Sensitivity
The sensitivity of the proposed method was assessed by calculating limit of quantitation (LOQ) and limit of detection (LOD). The LOD and LOQ were calculated as follows:
LOQ=10Sd/b; LOD=3.3Sd/b
Where Sa = standard deviation of the drug response and b = slope of the calibration curve. LOD values were found to be 0.262, 0.076 μg/mL while LOQ values were found to be 0.793, 0.230 μg/mL for metronidazole and furazolidone, respectively. These values demonstrate the satisfactory sensitivity of the proposed method for the analysis of selected drug combination.
Precision
The precision was established by analyzing metronidazole and furazolidone at a concentration of 60 μg/mL and 20 μg/mL, respectively. The system precision was tested by applying the proposed method for the determination of metronidozole and furazolidone in pure form for five successive times. The method precision was tested by repeated analysis of metronidozole and furazolidone in tablet sample for five successive times. The results are summarized in Table 3. The %RSD values for system precision and method precision were <0.7%, indicating that the proposed method has good precision in the simultaneous analysis of metronidazole and furazolidone.
| Method precision | System precision | ||
|---|---|---|---|
| Peak area | Statistical analysis | Peak area | Statistical analysis |
| Metronidazole (60 μg/mL) | |||
| 6697550 | Mean: 6696261 SD: 3067.75 %RSD: 0.045 |
6631137 | Mean: 6690755 SD: 40682.82 %RSD: 0.608 |
| 6699886 | 6683003 | ||
| 6695684 | 6682018 | ||
| 6691533 | 6732905 | ||
| 6696655 | 6724711 | ||
| Furazolidone (20 μg/mL) | |||
| 4218364 | Mean: 4214005 SD: 3227.91 %RSD: 0.076 |
4191873 | Mean: 4211712 SD: 18111.28 %RSD: 0.430 |
| 4210488 | 4204426 | ||
| 4215986 | 4200566 | ||
| 4211498 | 4228756 | ||
| 4213692 | 4232941 | ||
Table 3: Results of precision studies.
Accuracy
To the pre analysed tablet sample solutions, a known amount of standard solution was added at three different levels, i.e., 50%, 100% and 150%. The solutions were reanalyzed by the proposed method. The results of recovery studies (Table 4) showed that the % recovery was between 99.66% and 100.17% with % RSD<0.6%. The results indicate good accuracy of the method. The selectivity of the method was demonstrated by the noninterference of the excipients with the analysis of the analytes.
| Spiked level (%) | Amount of drug | % Recovery | Statistical Analysis | |
|---|---|---|---|---|
| Added (µg/mL) | Found (µg/mL) | |||
| Metronidazole | ||||
| 50 | 15 | 14.93 | 99.53 | Mean: 100.17 SD: 0.585 %RSD: 0.584 |
| 15 | 15.05 | 100.33 | ||
| 15 | 15.10 | 100.67 | ||
| 100 | 30 | 29.98 | 99.93 | Mean: 100.05 SD: 0.273 %RSD: 0.272 |
| 30 | 30.11 | 100.37 | ||
| 30 | 29.96 | 99.87 | ||
| 150 | 45 | 45.06 | 100.13 | Mean: 99.91 SD: 0.194 %RSD: 0.194 |
| 45 | 44.89 | 99.76 | ||
| 45 | 44.93 | 99.84 | ||
| Furazolidone | ||||
| 50 | 5 | 4.96 | 99.20 | Mean:99.66 SD:0.503 %RSD: 0.505 |
| 5 | 5.01 | 100.20 | ||
| 5 | 4.98 | 99.60 | ||
| 100 | 10 | 9.97 | 99.70 | Mean: 99.83 SD: 0.321 %RSD: 0.321 |
| 10 | 9.96 | 99.60 | ||
| 10 | 10.02 | 100.20 | ||
| 150 | 15 | 14.97 | 99.80 | Mean: 99.84 SD: 0.402 %RSD: 0.403 |
| 15 | 15.04 | 100.27 | ||
| 15 | 14.92 | 99.47 | ||
Table 4: Results of recovery studies.
Ruggedness
The ruggedness of the method is determined for 60 μg/mL and 20 μg/mL concentration of metronidazole and furazolidone, respectively by analysis of aliquots by two analysts, two columns and two systems using same experimental conditions. The results are given in Table 5. The low %RSD values (<0.7%) demonstrated the ruggedness of the proposed method for the simultaneous analysis of the selected drug combination.
| Parameter | Metronidazole (60 μg/mL) | Furazolidone (20 μg/mL) | ||||
|---|---|---|---|---|---|---|
| Found (µg/mL) | % Recovery | %RSD | Found (µg/mL) | % Recovery | %RSD | |
| Analyst I | 60.05 | 100.08 | 0.259 | 19.94 | 99.70 | 0.521 |
| Analyst II | 59.98 | 99.97 | 0.315 | 19.86 | 99.30 | 0.263 |
| Column I | 59.95 | 99.92 | 0.628 | 20.10 | 100.50 | 0.158 |
| Column II | 60.10 | 100.17 | 0.125 | 20.06 | 100.30 | 0.254 |
| System I | 59.94 | 99.90 | 0.458 | 19.95 | 99.75 | 0.168 |
| System II | 59.89 | 99.82 | 0.264 | 20.03 | 100.15 | 0.627 |
Table 5: Results of method ruggedness.
Robustness
In order to assess the method robustness, the effect of small and deliberate variation of experimental conditions on the peak areas of the analytes was examined. The robustness of the method was checked for 60 μg/mL and 20 μg/mL for metronidazole and furazolidone, respectively. The results are summarized in Table 6. The results revealed that the peak areas of the drugs were unaffected (RSD<1%) by small changes in flow rate, composition of mobile phase, temperature and detection wavelength indicating significant robustness of the method.
| Parameter | Value | Peak area | |
|---|---|---|---|
| Metronidazole (60 µg/mL) | Furazolidone (20 µg/mL) | ||
| Flow rate (mL/min) | 0.7 | 6686924 | 4226384 |
| 0.8 | 6697550 | 4215628 | |
| 0.9 | 6685291 | 4205391 | |
| Mean | 6689922 | 4215801 | |
| SD | 6656.596 | 10497.57 | |
| RSD | 0.099 | 0.249 | |
| Temperature (oC) | 25 | 6656321 | 4238164 |
| 27 | 6697550 | 4215628 | |
| 29 | 6686324 | 4224862 | |
| Mean | 6680065 | 4226218 | |
| SD | 21315.23 | 11329.03 | |
| RSD | 0.319 | 0.268 | |
| Mobile phase ratio (v/v) | 88:12 | 6684136 | 4203628 |
| 90:10 | 6697550 | 4215628 | |
| 92:08 | 6695175 | 4203951 | |
| Mean | 6692287 | 4207736 | |
| SD | 7158.16 | 6836.869 | |
| RSD | 0.106 | 0.162 | |
| Wavelength (nm) | 330 | 6659318 | 4226017 |
| 332 | 6697550 | 4215628 | |
| 334 | 6662846 | 4216059 | |
| Mean | 6673238 | 4219235 | |
| SD | 21128.58 | 5877.625 | |
| RSD | 0.316 | 0.139 | |
Table 6: Results of method robustness.
Specificity
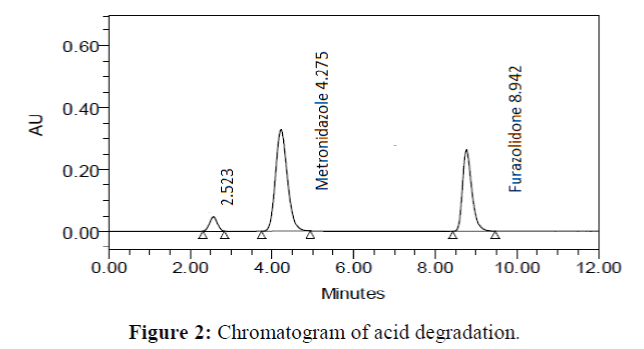
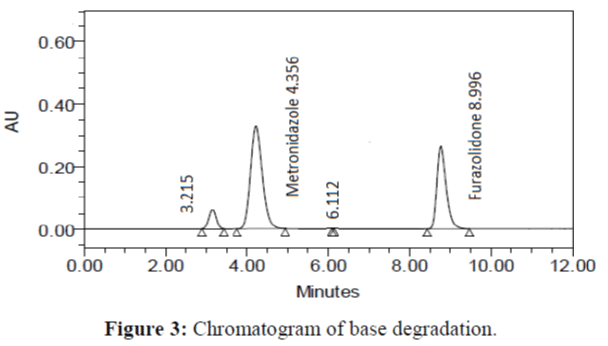
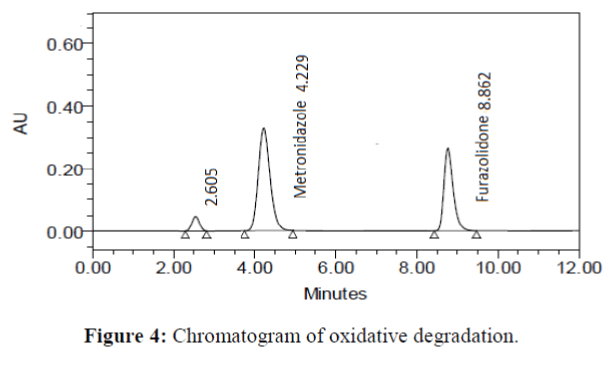
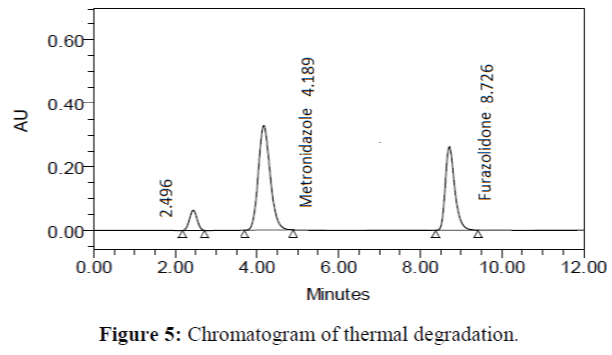
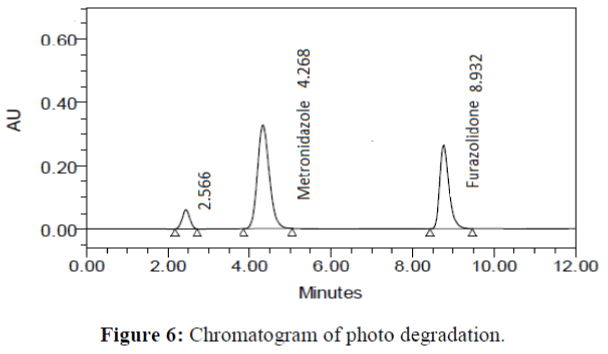
The specificity of the proposed method was investigated using the forced degradation study. The degradation study was done to make sure that the proposed method was able to separate metronidazole and furazolidone from the possible degradation products generated during the forced degradation study. Acid, base, oxidative, photolytic and thermal degradation studies were performed with the tablet sample at a concentration of 60 μg/mL and 20 μg/mL of metronidazole and furazolidone, respectively. The results of degradation studies are presented in Table 7. The chromatograms are shown in Figure 2-6. More percentage of degradation occurred under alkaline conditions for both the drugs. The percentage of metronidazole degradation is less in thermal degradation whereas for furazoline in photolytic condition. In all the degradation conditions, except base degradation, one degradation product peak is observed. The degradation products produced due to stress did not interfere with the detection of metronidazole and furazolidone, and the method can therefore be regarded as stability- indicating.
| Type of degradation | Metronidazole (60 ug/mL) | Furazolidone (20 µg/mL) | ||
|---|---|---|---|---|
| % Recovery | % Degradation | % Recovery | % Degradation | |
| Undegraded | 100.02 | 0.000 | 99.97 | 0.000 |
| Acid | 98.459 | 1.541 | 98.842 | 1.158 |
| Base | 94.372 | 5.628 | 96.517 | 3.483 |
| Oxidative | 95.179 | 4.821 | 96.289 | 3.711 |
| Photolytic | 98.114 | 1.886 | 99.131 | 0.869 |
| Thermal | 98.882 | 1.118 | 99.075 | 0.925 |
Table. 7. Results of forced degradation studies.
Application of the method
The application of the method was evaluated by assay of commercially available tablets (Dependal M tablets, Glaxo Smithkline Pharmaceuticals Ltd. India; claimed to contain 100 mg of furazolidone and 300 mg of metronidazole). The percent assay was found to be 99.96% ± 0.193% for metronidazole and 100.02 ± 0.058 for furazolidone (Table 8). The good %Recovery and %RSD values indicated that the proposed method was accurate and precise, respectively for the analysis of metronidazole and furazolidone in the combined tablet dosage form.
| Analyte | Labeled claim(mg/5mL) | Found (mg) | Mean | %Recovery | %RSD |
|---|---|---|---|---|---|
| Metronidazole | 300 | 299.84 | 299.90 | 99.96 | 0.193 |
| 300 | 299.75 | ||||
| 300 | 300.12 | ||||
| Furazolidone | 100 | 99.95 | 100.02 | 100.02 | 0.058 |
| 100 | 100.04 | ||||
| 100 | 100.06 |
Table 8. Assay of metronidazole and furazolidone in tablets.
Conclusion
The developed and validated stability indicating HPLC method for the simultaneous quantification of metronidazole and furazolidone is simple, accurate, precise, sensitive, specific, rugged and robust. The proposed method can thus be applied for routine analysis of metronidazole and furazolidone in combined tablet dosage form.
Acknowledgements
The authors are thankful to authorities of Acharya Nagarjuna University, Guntur and Chalapathi College of Pharmacy, Guntur for providing facilities to carry out the present work.
References
- Metronidazole. The American Society of Health-System Pharmacists. Retrieved July 31, 2015.
- Brayfield A. ‘Metronidazole’, ‘Martindale: The Complete Drug Reference’, Pharmaceutical Press. Retrieved 3 April, 2014.
- Löfmark S, Edlund C,Nord CE, et al. Metronidazole is Still the Drug of Choice for Treatment of Anaerobic Infections. Clin Infec Dis. 2010;50(Supplement 1):S16-23.
- Ali BH. Pharmacological, Therapeutic and Toxicological Properties of Furazolidone: Some Recent Research. Vet Res Commun. 1999;23(6):343-60.
- Timperio AM, Kuiper HA, Zolla L, et al. Identification of a furazolidone metabolite responsible for the inhibition of amino oxidases. Xenobiotica. 2003;33(2):153-67.
- Meng J, Mangat SS, Grudzinski IP, et al. Drug Metabol Drug Interact. 1998;14(4):209-19.
- McEvoy GK. American Hospital Formulary Service-Drug Information 2002. Bethesda, MD: American Society of Health-System Pharmacists, Inc. (Plus Supplements);2002. 861 p.
- Hardman JG, Limbird LE, Molinoff PB, et al. Goodman and Gilman's the Pharmacological Basis of Therapeutics. 9th ed. New York: McGraw-Hill;1996. 1098 p.
- http://www.mims.com/india/drug/info/dependal-m
- Kale AA, Rasane AB, Bhatiyani AK. Int J Pharm Tech 2012;4(3):4805-13.
- Chemate SZ, Dongare US, Jadhav SA, et al. Validated spectrophotometric methods for simultaneous estimation of metronidazole and furazolidone in pure and in tablet dosage form. Int Res J Pharm 2012;3(5):461-64.
- Basu D, Mahalanabis KK. Anal Chim Acta. 1991;249(2):349-52.
- Elena GO, Milea B. Medicamentul Veterinar 2014;4(2):1-4.
- Kumar MS, Anjaneyulu A, Mangilal T, et al. World J Pharm Pharma Sci 2015;4(5):1944-46.
- ICH. Stability Testing of New Drug Substances and Products, Q1A (R2). International Conference on Harmonisation of Technical Requirements for Registration of Pharmaceuticals for Human Use;2003.
- ICH. Validation of analytical procedures; Text and methodology; Q2 (R1). International Conference on Harmonisation of Technical Requirements for Registration of Pharmaceuticals for Human Use;2005.
