Original Article
, Volume: 14( 2)Rhodamine B and Acid Orange 7 Adsorption onto Activated Carbon from Deinked Pulp Waste Sludge: Adsorption and Kinetics studies
- *Correspondence:
- Meenakshi S , Department of Chemistry, The Gandhigram Rural Institute-Deemed University, Tamil Nadu, India, E-mail: sankaranmeenakshi2014@gmail.com
Received: March 28, 2017; Accepted: April 4, 2018; Published: April 11, 2018
Citation: Rajeshkanna P, Nagarajan NS, Meenakshi S. Rhodamine B and Acid Orange 7 Adsorption onto Activated Carbon from De-inked Pulp Waste Sludge:Adsorption & Kinetics studies. Environ Sci Ind J. 2018;14(2):169
Abstract
De-inked Pulp waste Sludge Activated carbon (DIPSAC) has been found to be a promising material for adsorptive removal of Rhodamine B (RhB) and Acid Orange 7 (AO7) from aqueous solutions. Physico-chemical parameters like dye concentration, adsorbent dosage, solution pH, temperature and contact time have been varied to study the adsorption phenomenon. Favorable adsorption of RhB occurs at around pH 3.9 and for AO7 is pH 2.0. The maximum adsorption capacity of the DIPSAC for RhB and AO7 has been calculated to be 11.51 and 12.88 mg/g, respectively. The adsorption process is in conformity with Freundlich isotherm for both RhB and AO7. In both the cases, adsorption occurs very fast initially and attains equilibrium within 60 min. Kinetic results suggest that the adsorption of RhB and AO7 onto DIPSAC followed pseudo-second-order kinetic model.
Keywords
Isotherm; Adsorption; Sludg; Rhodamine B; Acid Orange 7
Introduction
Effluents of textile, pulp and paper, paint, printing and cosmetic industries must be treated to reduce the dye concentration present in it to permissible limit before discharging into water as required under environmental regulation act [1-3]. The intensity of the colour in wastewater by these dyes is causing reduced photosynthesis of aquatic plants by inhibition of the sunlight penetration [4]. The removal of toxic dyes from industrial wastewater has been done by several conventional physico-chemical methods such as chemical precipitation, electroplating, liquid-liquid extraction through membrane technology [5,6], photo-catalytic degradation [7-14], evaporation and resin ionic exchange which are usually too expensive and sometimes not effective also. Therefore, there is a need for an alternative technique which is efficient and cost effective. Bio sorption, based on living or non-living micro-organisms or plants, is a promising potential alternative to conventional processes for the removal of dyes [15]. Activated carbons have shown great potential for dye removal due to their properties such as large surface area, micro porous structure and high adsorption capacity [16]. The high cost of activated carbon induces the search for cheap material mainly from biological origin or waste material. It has been proved that ligno-cellulosic biomasses are attractive resources for the preparation of carbonaceous materials implemented in adsorption processes [17]. The eco-friendly nature of ligno-cellulosic biomasses, their availability and low cost are the main advantages of these resources, which makes them a suitable pre-cursor for activated carbon preparation. Various ligno-cellulosic biomasses such as coconut coir pith [18], Bagasse pith [19], sawdust and sugarcane [16] have been used naturally or in the form of activated carbon to remove Rhodamine B and Acid Orange 7 from aqueous phase through the adsorption process.
The Deinked pulp sludge is a waste material originating in recycling of waste papers such as Sorted Office Paper (SOP), Coated Book Stock (CBS), Sorted White Ledger (SWL), Printer Off Cutting paper (POC), Old Magazine Grade paper (OMG) for the production of bleached pulp and to avoid the cutting action of trees. Therefore, this material can be utilised as a potential carbonaceous source for the preparation of activated carbon. The aim of this paper is to report the utility of waste DIP sludge derived activated carbon as adsorbent for the removal of a cationic dye, Rhodamine B and anionic dye, Acid Orange 7 from the aqueous solution. The effect of various operational parameters (dye concentration, solution pH, contact time, adsorbent concentration, and interference of other anions) on dye removal efficiency was examined. Also, several adsorption isotherms and kinetic models were used to interpret the experimental data.
Materials and Methods
Adsorbate and adsorbent
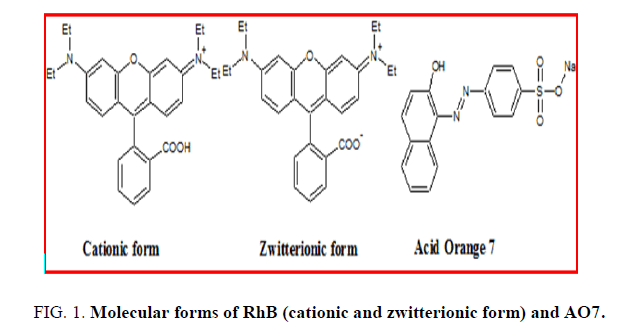
DIP sludge, as an adsorbent, was collected from local paper mill deinking plant, Karur, Tamil Nadu. The collected material was dried in oven at 105°C and powdered by using pulveriser. Then the powder was modified as activated carbon and used for adsorption studies. Phosphoric acid (H3PO4) (Merck) 85% (wt) solution was used as the chemical activating agent. Rhodamine B and Acid Orange 7 were procured from Merck with analytical grade. The chemical structures of the dyes were shown in FIG. 1. All other chemicals were of analytical grade and obtained from Chemical Drug House (CDH) Ltd., India. The double distilled water (DD) was used to prepare all the aqueous solutions.
Preparation of activated carbon
DIP sludge was chosen as precursor for the production of activated carbon by one-step chemical activation. The crushed DIP sludge was soaked in a ratio of 1:1.5 wt of DIP sludge/wt of H3PO4 solution to cover it completely, slightly agitated to ensure penetration of the acid throughout, then the mixture was heated to 80°C for 1 h and left overnight at room temperature to help appropriate wetting and impregnation of the precursor. The impregnated mass was dried in an air oven at 80°C overnight, then, carbonized in a closed stainless steel reactor placed in a programmable Muffle Furnace. The temperature was raised at the rate of (50°C/10 min.) to the required end temperature. The carbonization process was carried out at 500°C for 30 min in limited air. The product (DIPSAC) refers to H3PO4 treatment was thoroughly washed with warm distilled water (70°C) until pH of the solution came close to the initial pH of the rinsing water. Finally, the activated carbon was dried at 105°C for 24 h and sieved to different particle size by using ASTM mesh and accepted particle size of 40 μ was kept for use [19].
Characterization of activated carbon
Activated carbons are a widely used adsorbent due to their high adsorption capacity, high surface area, and micro porous structure, high chemical and mechanical stability. The chemical nature and pore structure usually determined the sorption activity. The activated carbons employed in the present study were characterized by determination of various physico-chemical properties and tabulated in TABLE 1. Various properties like pH, moisture content, density, water insoluble matter, ion exchange capacity, surface area of the prepared carbon was determined by using the standard methods and the details are given below.
| Properties | Activated carbon DIPSAC |
|---|---|
| Density (g/cc) | 0.2488 |
| Moisture content (%) | 7.82 |
| Water insoluble matter (%) | 83.2 |
| pH of aqueous solution | 6.7 |
| pHzpc | 7.2 |
| Ion exchange capacity (meq/g) | 0.007 |
| Surface area (m2/g) | 1523.7 |
Table 1: Characteristics of the adsorbents
pH
The adsorbent (100 mg each) was mixed with 50 mL of distilled water and equilibrated for 1 h by agitating in a thermostat controlled shaker at 120 rpm. The pH of the supernatant was measured using a pH meter. The pH meter was calibrated with 4.0 and 9.2 buffers.
Moisture content
About 1g of carbon was weighed in a Petri dish. The dish was placed in an electric oven maintained at 110 ± 5°C for 2 h. It was covered and cooled in desiccators. The process of heating, cooling and weighing was repeated at 30 min intervals until the difference between two consecutive weighings was less than 5 mg. The loss in weight gives the moisture content [20].
 (1)
(1)
where, M is the mass of the DIPSAC taken for the test (g) and X is mass of the DIPSAC after drying (g).
Apparent density
For the determination of apparent density, a graduated cylinder was weighed accurately. Sufficient amount of carbon was poured with constant tapping and filled in the graduated cylinder. After filling graduated cylinder with carbon, it was weighed accurately. The apparent density was calculated by dividing the weight of carbon by volume of the carbon used [20].
Matter insoluble in water
One gram of adsorbent was added to 100 mL of distilled water and was shaken thoroughly for about 30 min and filtered. The residue in the adsorbent was dried, cooled and weighed.
Ion exchange capacity
About 2 g of the carbon was weighed and taken in a beaker and sufficient amount of distilled water was added to cover the carbon. The slurry was then transferred to the burette. The column was never allowed to drain completely and the level of the liquid was maintained at about 1 cm above the carbon bed. 250 mL of 0.25 M Na2SO4 was allowed to drip into the column at a rate of 2 mL/min and the effluent was titrated against 0.1 N NaOH solution using phenolphthalein as indicator [21].
 (2)
(2)
where, N is the normality of the NaOH solution, V is the Volume (mL) and W is the weight of the carbon (g).
Determination of surface area
About 1 g of carbon was taken in a series of 300 mL stoppered bottles. Acetic acid solutions in the range of 0.015 to 0.15 M were added. To another bottle, 100 mL of 0.03 M acid alone was added which in the absence of carbon served as a control. The flasks were tightly closed and then shaken in a rotary mechanical shaker for 60 min. At the end of equilibration period, the samples were filtered through fine filter paper (Whattman No.40) the first 10 mL of filtrate was rejected. From the remaining filtrate, 25 mL aliquots were withdrawn and titrated against 0.1 N NaOH solution using phenolphthalein as indicator.
The final concentrations of acetic acid were calculated for each sample. By noting the difference in initial and final concentrations of acetic acid, the number of moles of acetic acid adsorbed by the carbon was calculated. The number of moles of acid adsorbed per gram of carbon was then computed which is designated as ‘N’.
The concentration of acetic acid remaining in each instance (C) was divided by the number of moles of acid adsorbed per gram (N) of the carbon. A plot of C/N versus the concentration of acetic acid remaining in the containers after adsorption process (C) was made. A straight line plot was obtained. The reciprocal of the slope of the straight line gives the number of moles of acetic acid required per gram to form a monolayer which is designated as ‘Nm’ by assuming that the molecular cross sectional area of acetic acid as 21 Å2, the area available in square meters per gram of the carbon was calculated from the following equation [22].
 (3)
(3)
where, No is the Avogadro’s number. Nm, S and Å are the number of moles per gram required to form a monolayer, Molecular cross sectional area given in square angstroms and Specific area in square meters/g respectively.
Zero point of charge (pHzpc)
The pHzpc of the sorbent was measured using the pH drift method [23]. The pH of background electrolyte was adjusted between 2 and 12 by addition of 0.01 M HCl/NaOH. About 0.15 g of the adsorbent was added to 50 mL of 0.01 M NaCl solution. After stabilizing the pH the final pH was recorded after 24 h of reaction. The graphs of initial pH versus final pH was plotted to determine the points at which initial pH and final pH were equal.
Preparation of dye solutions
The stock solution of each dye was prepared by dissolving 1g of analytical grade dyes in 1000 mL of distilled water and diluted to get desired concentration of the dyes. All experiments were carried out at room temperature (29 ± 1°C) using a constant agitation speed of 100 rpm. The pH of each solution was adjusted to the required value with diluted or concentrated and hydrochloric acid (HCl), sodium hydroxide (NaOH) solutions before contacting the adsorbent. Experimental solutions of the desired concentrations were prepared by successive dilutions. All the experiments were carried out in a batch system in order to evaluate the effects of different operational variables.
Characterization
The surface morphology and elemental analysis of DIPSAC were carried out by scanning electron microscope equipped with an energy dispersive X-ray analyzer (SEM-EDX, VEGA3 TESCAN). The functionality present in the prepared DIPSAC adsorbent before and after treatment with dyes were characterized using Fourier transform infrared Spectroscopy (FTIR) (JASCO-60 plus). The DIPSAC (0.01 g) and KBr (0.1 g, IR Grade, Merck, India) were thoroughly mixed and this mixture was pressed to form a tablet which was used for FTIR analysis.
Batch experiments
The batch experiments were performed in a 250 mL conical flask in which 0.1 g of the activated carbon was added to 50 mL of dye solutions. Then, the mixture was kept at room temperature (30℃) for the desired time under shaking at 300 rpm. After the desired time, the material was filtered through filter paper. The dyes concentrations were determined using absorbance values measured before and after the adsorption by UV-spectrophotometer (Pharo 300 Merck) at the wavelength corresponding to the maximum absorbance of 452 and 554 nm for AO7 and RhB, respectively. The maximum wavelength (λmax) for both adsorbents was recorded by UV-vis spectrophotometer. In all cases, a proper dilution was necessary to obtain a well measurable absorption. The pH of the solutions during the studies was determined by a pH meter.
To optimize the conditions for dye removal, and also to evaluate the adsorption capacity of DIPSAC, the adsorption reactions were conducted at a wide pH range (pH 2-10), contact time (15-90 min), initial concentration (10-50 mgL-1), and adsorbent dose (0.020-0.140 g). The working solution pH was adjusted by adding 0.1M of HCl/NaOH. For isotherm studies, the experiments were carried out at three different temperatures with four different concentrations of dyes viz., 10, 20, 30 and 40 mgL-1. Thermodynamic parameters such as standard free energy change (ΔG0ads), standard enthalpy change (ΔH0ads) and standard entropy change (ΔS0ads) were determined using equilibrium data. Kinetic data were obtained by conducting experiments at 303 K with three different concentrations of both the dyes. While doing the experiment, the samples were withdrawn at pre-determined time interval and analyzed for the dye concentration. The percent dye removal by DIPSAC was computed using the following equation.
 (4)
(4)
where, C0 and Ce are the initial and final concentration of dye, respectively). The sorption capacity of the activated carbon was calculated according to the following mass balance Eqn. (5):
 (5)
(5)
where, q is the adsorption capacity of the composite (mg/g), V is the volume of the sample (mL), C0 is the initial concentration of dye solution (mg/L), Ce is the final concentration of dye solution (mg/L) and M is the mass (g) of the activated carbon.
Results and Discussion
Characterization of activated carbon
FTIR spectra
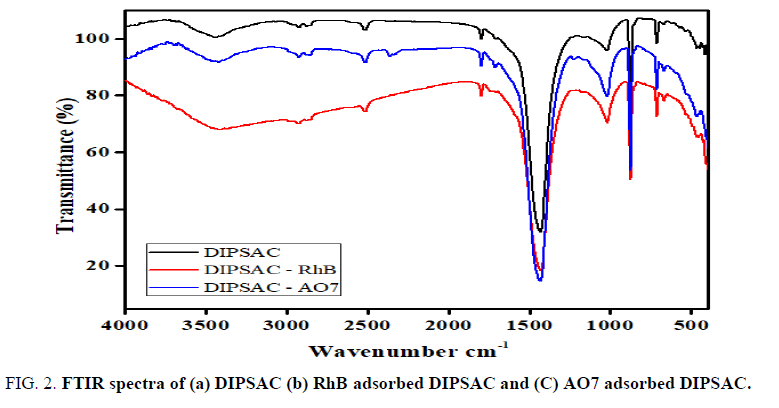
FTIR spectra of (A) DIPSAC, (B) RhB adsorbed DIPSAC and (C) AO7 adsorbed DIPSAC over the wavelength range of 4000 to 400 cm-1 are shown in FIG. 2. A broad band observed in the range from 3300 to 3500 cm-1 in all the stages is corresponded to stretching vibration of OH including hydrogen bonding. The peaks in the range of 2925 and 2845 cm-1 indicate the presence of aliphatic C-H stretching. The band between 1430 to 1440 cm-1 may be due to the presence of bending vibration of O-H groups and/or bending vibration of C-H [24-30]. Moreover, after adsorption of RhB dye, a slight shifting of the band from 3451 to 3429 cm-1 while the adsorption of AO7, shifting of the band from 3451 to 3415 cm-1, has been occurring and this may be taken as an indicative of electrostatic interaction between the DIPSAC and RhB and AO7 dyes. This feature confirmed the adsorption of RhB and AO7 on to DIPSAC.
Surface morphology and elemental analysis
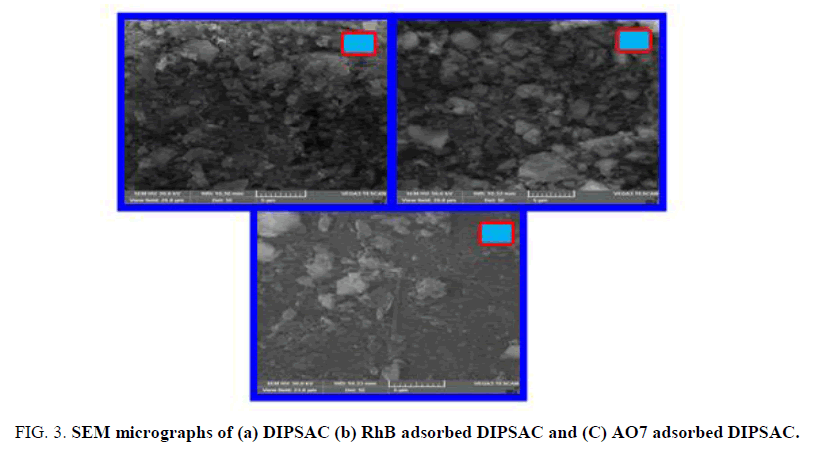
The SEM images of (A) DIPSAC (B) RhB adsorbed DIPSAC and (C) AO7 adsorbed DIPSAC are displayed in FIG. 3. It was observed that the image (B) and (C) have shown after adsorption of RhB and AO7 and the surface morphology of the DIPSAC has also been significantly altered, which revealed the structural changes in DIPSAC during the adsorption of RhB and AO7.
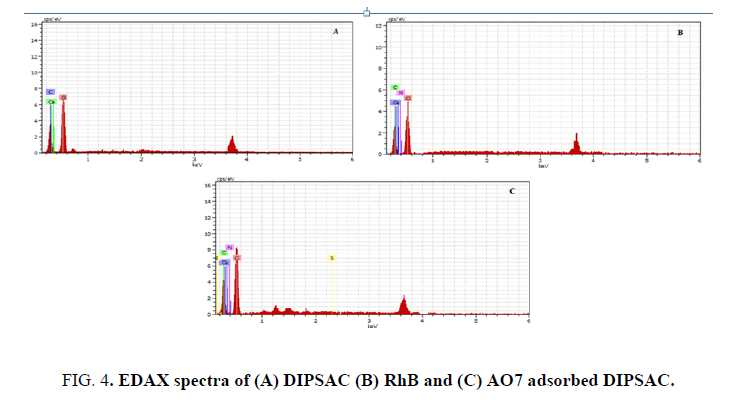
In order to prove the RhB and AO7 adsorption onto DIPSAC, EDAX analysis has been performed before and after treatment to confirm the adsorption of RhB and AO7 onto DIPSAC. FIG. 4. shows the EDAX spectra of (A) DIPSAC, (B) RhB adsorbed DIPSAC and (C) AO7 adsorbed DIPSAC, respectively. After adsorption, the presence of Nitrogen and Sulphur peaks corresponding to the dyes confirmed the adsorption RhB and AO7 onto DIPSAC.
XRD analysis
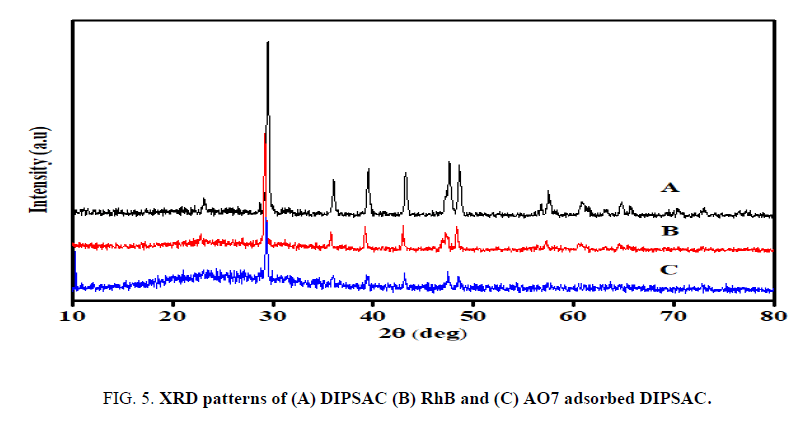
X-ray diffraction patterns of (A) DIPSAC, (B) RhB adsorbed DIPSAC and (C) AO7 adsorbed DIPSAC, respectively are shown in FIG. 5. DIPSAC has well crystallized form with peaks at 2θ = 23.1º, 29.4º, 36.1º, 39.6º, 47.7º, 48.5º, 57.6º, 60.9º, 64.8º and 73.1º. The peaks of RhB adsorbed DIPSAC at 2θ = 22.8º, 29.2º, 35.8º, 39.2º, 42.9º, 47.2º, 48.4º and 57.2º. Whereas AO7 adsorbed DIPSAC shows the peaks at 2θ = 29.4º, 35.9º, 39.4º, 43.1º, 47.5º and 48.5º. It is to be noted that, in the XRD profile of RhB adsorbed DIPSAC, there was a shifting of peaks present to 22.8º, 35.8º and 47.2º and disappearance of rest of 60.9º, 64.8º and 73.1º due to the adsorption of RhB dye onto DIPSAC. AO7 adsorbed DIPSAC has also well crystallized diffraction peaks and there was a shifting of peaks present to 35.9º, 43.1º and 47.5º due to the adsorption of AO7 dye onto DIPSAC. It is noticed that after the adsorption of both the dyes, the intensity of the highly organized peaks is slightly diminished.
Effect of pH
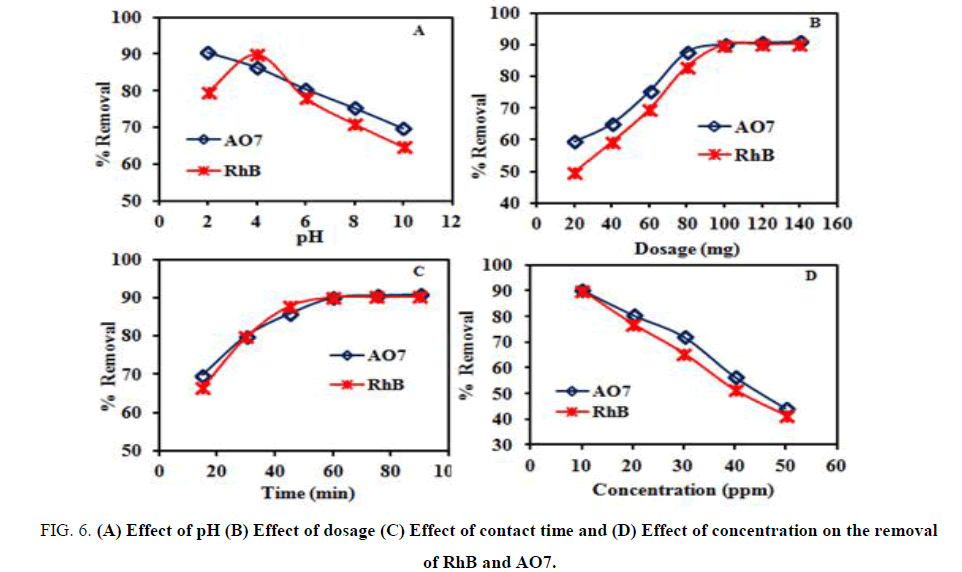
The influence of solution pH on the removal of RhB and AO7 onto the DIPSAC was studied and is illustrated in FIG. 6A. The pH measurements were carried out using the expandable ion analyzer EA 940 with pH electrode. The uptake of RhB at pH 11.0 to 12.0 was the minimum and a maximum uptake was obtained at pH 4.0. However, when the pH of the solution was increased (more than pH 4), the uptake of RhB was decreased. It appears that a change in pH of the solution results in the formation of different ionic species, and different carbon surface charge. At pH values lower than 4, the dye can enter into the pore structure. At a pH value higher than 4, the zwitterions form of RhB in water may increase the aggregation of RhB to form a bigger molecular form (dimmer) and become unable to enter into the pore structure of the carbon surface [19,31-32].
Figure 6: (A) Effect of pH (B) Effect of dosage (C) Effect of contact time and (D) Effect of concentration on the removal of RhB and AO7.
At a pH value higher than 10, the existence of OH- creates a competition between –N+ & COO- and it will decrease the aggregation of RhB, which causes an increase in the adsorption of dye on the carbon surface. Due to the amphoteric character of dye, its adsorption properties may be influenced by the pH value of the solution.
The experiments were carried out at different initial solution pH values varying from 2 to 10. The dye removal percentage of AO7 decreased significantly with an increase in the solution pH and the maximum adsorption level was determined at pH 2. It is well known that at lower pH, more protons will be available to protonate the adsorbent surface, thereby increasing the electrostatic attractions between negatively charged dye anions and positively charged adsorption sites and causing an increase in the dye adsorption. A negatively charged site on the adsorbent does not favour the adsorption of anionic dyes due to the electrostatic repulsion [33,34]. Hence, all the succeeding investigations were performed at pH 2.
Effect of dosage
FIG. 6B explains the effect of dosage on the removal percentage of RhB and AO7. It was apparent from the graph that the removal of both dyes increased with an increase in dosage. This can be attributed to increase in the number of sorption sites available for the adsorption of both dyes. Also, when the dosage was increased from 0.020 to 0.140 g/L, the removal of RhB increased from 56.45 to 88.41% and for AO7 increased from 57.46 to 89.72%, respectively. Similar trends were observed for the removal of RhB and AO7 using different adsorbents like sugarcane bagasse [35] and canola stalks [36].
Effect of contact time and concentration
FIG. 6C, 6D shows the effect of contact time with 0.1 g of DIPSAC and different initial concentrations on the removal of RhB and AO7. It is evident from the graphs that the removal of RhB and AO7 were rapid increased with increase in contact time. The adsorption process with DIPSAC was finished within 60 min and small amount of RhB and AO7 uptake were observed at longer time. It also indicates that the time required to reach equilibrium depends on initial dye concentration. These results revealed that the percentage removal of two dyes mainly depends on the number of active adsorption sites available on the sorbent surface for the sorption. Hence, based on these results, the optimum contact time for the removal of two dyes by DIPSAC was fixed as 60 min for the further adsorption studies and the initial concentration was fixed as 10 mg/L.
Effect of Co-anions
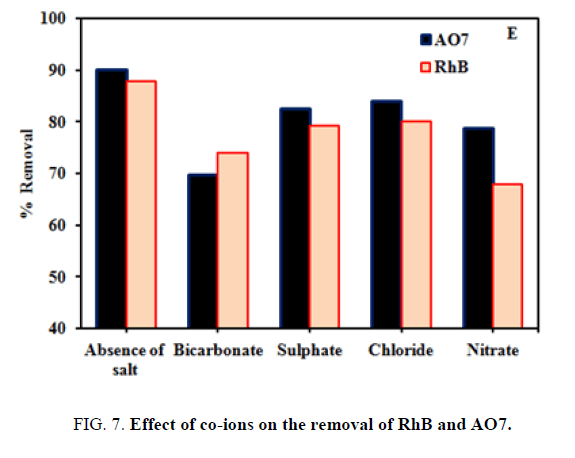
The effect of the presence of common anions like chloride, carbonate, and bicarbonate on the removal of two dyes RhB and AO7 were studied by adding a fixed 200 mg/L initial concentration of each selected ion and a 50 mg/L initial dye concentration at room temperature and keeping all other parameters constant. FIG. 7 shows that the dye removal percentage was slightly altered by the presence of co-anions competition with the surface binding sites and hence a slight reduction in dye removal was observed.
Figure 7: (A) Effect of pH (B) Effect of dosage (C) Effect of contact time and (D) Effect of concentration on the removal of RhB and AO7.
Adsorption isotherm
Adsorption isotherm plays major role in the design of adsorption system and also it provides the maximum sorption capacity for DIPSAC for the removal of RhB and AO7 from aqueous solution. Many isotherm models have been used to describe the adsorption process. However, among the various isotherm models viz., Langmuir, Freundlich and Dubinin-Radushkevich (D-R) isotherm models have been widely employed to describe the adsorption equilibrium process.
Langmuir isotherm
The most popular linear form of the Langmuir isotherm [37] is represented by Eqn. (6):
 (6)
(6)
where, Ce is the equilibrium concentration of dye in solution (mgL-1), qe is the amount of dye adsorbed per unit weight of the sorbent (mgg-1), Qo is the amount of adsorbate at complete monolayer coverage (mgg-1) and gives the maximum sorption capacity of sorbent and b (Lmg-1) is Langmuir isotherm constant that relates to the energy of adsorption.
To identify the feasibility of the adsorption process, the essential characteristics of the Langmuir isotherm can be expressed in terms of the dimensionless constant separation factor or equilibrium parameter, RL.
 (7)
(7)
where, b (Lmg-1) is Langmuir isotherm constant and C0 (mgL-1) is initial concentration of dye.
The calculated values for Langmuir isotherm parameters are given in TABLE 2. The RL values of Langmuir lies between 0 and 1 indicating that the adsorption process is favorable. The value of Q0 is decreased with the increase in temperature indicate the exothermic nature of the adsorption process. The obtained value of Langmuir isotherm constant (b) for AO7 adsorption was higher than for RhB adsorption in all three temperatures, which illustrate that the DIPSAC had more affinity towards AO7 rather than RhB since the b is directly proportional to the binding energy.
| Material | T (°C) | Langmuir constants | Freundlich constants | D-R constants | |||||||||||
|---|---|---|---|---|---|---|---|---|---|---|---|---|---|---|---|
| qm (mg/g) | b (L/mg) | RL | χ2 | r | kF (mg/g) | 1/n | χ2 | r | Xm (mg/g) | kDR (mol2/J2) | E (kJ/mol) | χ2 | r | ||
| RhB | 30 | 11.51 | 0.302 | 0.076 | 14.88 | 0.994 | 4.022 | 0.325 | 0.007 | 0.999 | 13.32 | 2.53E-07 | 1.406 | 1.564 | 0.921 |
| 40 | 11.44 | 0.247 | 0.092 | 14.77 | 0.992 | 3.283 | 0.384 | 0.006 | 0.999 | 12.92 | 7.38E-07 | 0.823 | 1.152 | 0.914 | |
| 50 | 11.36 | 0.184 | 0.119 | 14.31 | 0.994 | 2.659 | 0.417 | 0.012 | 0.996 | 12.2 | 1.09E-06 | 0.677 | 1.151 | 0.922 | |
| AO7 | 30 | 12.88 | 0.353 | 0.066 | 17.37 | 0.994 | 4.255 | 0.354 | 0.006 | 0.999 | 9.429 | 2.90E-07 | 1.312 | 0.183 | 0.913 |
| 40 | 12.33 | 0.286 | 0.08 | 16.37 | 0.992 | 3.753 | 0.363 | 0.008 | 0.997 | 8.86 | 3.70E-07 | 1.162 | 0.179 | 0.904 | |
| 50 | 12.23 | 0.193 | 0.115 | 15.14 | 0.991 | 2.923 | 0.416 | 0.009 | 0.997 | 8.343 | 6.57E-07 | 0.872 | 0.157 | 0.91 | |
Table 2: Freundlich, Langmuir and D-R isotherm constants of DIPSAC.
Freundlich isotherm
The linear form Freundlich isotherm [37] is represented by Eqn. (8):
 (8)
(8)
where, kF is the measure of adsorption capacity and 1/n is the adsorption intensity. The obtained values for Freundlich isotherm parameters are given in TABLE 2. The magnitude of the exponent 1/n lies between 0 and 1 indicates the favourable conditions for the adsorption. The exothermic nature of the adsorption process is further confirmed by the kF value which is decreased with an increase in temperature.
D-R isotherm
The linear mathematical form of D-R isotherm [38] is expressed by Eqn. (9):
 (9)
(9)
where, Xm is the adsorption capacity (mgg-1) and kDR is the constant related to adsorption energy (mol2kJ-2). ԑ is Polanyi potential and which can be calculated from the following Eqn. (10):
 (10)
(10)
where, T is the temperature (K) and R is the gas constant (8.314 J mol-1K-1). The value of k is used to calculate the mean of free energy E (kJ/mol) of the sorption,
 (11)
(11)
The calculated values for D-R isotherm parameters are given in TABLE 2. The values of Xm for RhB and AO7 decreased with an increase in temperature reveal the exothermic nature of the process.
Chi-square (χ2) analysis
χ2 analysis [38] was carried out to identify the suitable isotherm model for describing the removal of RhB and AO7 from aqueous solution using DIP sludge AC. The χ2 values provide the significant information about the suitability of the isotherm model.
The mathematical expression for the χ2 analysis is represented by Eqn. (12):
 (12)
(12)
where, qe,m is equilibrium capacity obtained by calculating from the model (mgg-1) and qe is experimental data on the equilibrium capacity (mgg-1). If the data derived from the model is similar to the experimental data, χ2 will be a small number. If they differ, χ2 will be a bigger number.
The obtained χ2 values for the Langmuir, Freundlich and D-R isotherm models are shown in TABLE 2. It is noted from the TABLE 2 that the Freundlich isotherm model has obtained lower χ2 value than the Langmuir and D-R isotherm models. Therefore, Freundlich isotherm model is identified as a suitable isotherm model for describing the present adsorption process.
Thermodynamic study
The values of thermodynamic parameters [38] such as free energy change (ΔG0), standard enthalpy change (ΔH0) and standard entropy change (ΔS0) can be determined from the following Eqns. (13) and (14):
 (13)
(13)
 (14)
(14)
where, K0 is the sorption distribution coefficient, ΔG0 is the standard free energy change of sorption (kJ mol-1), T is the temperature in K, R is the universal gas constant (8.314 J mol-1K-1), ΔH0 is the standard enthalpy change (kJ mol-1) and ΔS0 is standard entropy change (kJ mol-1 K-1). The values of ΔH0 and ΔS0 can be obtained from the slope and intercept of a plot of lnK0 against 1/T. The obtained values for ΔG0, ΔH0 and ΔS0 are listed in TABLE 3.
| Thermodynamic parameters | RhB | AO7 | |
|---|---|---|---|
| ΔGo (kJ mol-1) | 303 K | -5.682 | -5.502 |
| 313 K | -6.408 | -6.05 | |
| 323 K | -7.171 | -6.92 | |
| ΔHo (kJ mol-1) | - | -9.25 | -15.93 |
| ΔSo (kJ mol-1K-1) | - | -0.025 | -0.071 |
Table 3: Thermodynamic parameters of DIPSAC.
The negative values of ΔG0 indicate the removal of RhB and AO7 by DIPSAC is a spontaneous process. The negative value of ΔH0 confirmed the exothermic nature of the sorption process. It has also been stated that the value of ΔH0 provides useful information about the type of adsorption process. The typical range of ΔH0 value for physisorption is between 2.1 and 20.9 kJ mol-1 and for chemisorption involving complexation is between 20.9 and 418.4 kJ mol-1 [39-41]. The ΔH0 values were obtained by this study, which falls within the range of physical adsorption. i.e.,electrostatic interaction between DIPSAC and both dyes. In addition, the negative values of ΔS0 indicates a decrease in randomness at solid/solution interface and no significant changes occurs in the internal structure [41] during the RhB and AO7 sorption onto DIPSAC.
Sorption dynamics
Reaction-based models
The most commonly used pseudo-first-order and pseudo-second-order models were employed to explain the solid/liquid adsorption based.
A pseudo-first-order equation of Lagergren [42] is generally expressed as:
 (15)
(15)
where, qe and qt are the adsorption capacity (mgg-1) of the sorbent at equilibrium and at time t (min), respectively, kad is the equilibrium rate constant of the pseudo-first-order sorption (min-1).
Pseudo-second-order model was also generally applied to fit the experimental data. The linear form of pseudo-second-order model [43] can be expressed as:
 (16)
(16)
where, qt = (qe2kt)/(1 + qekt), the amount of dye adsorbed on the surface of the DIPSAC at any time, t (mgg-1), k is the pseudo-second-order rate constant (gmg-1min-1) and the initial sorption rate, h = k qe2 (mgg-1 min-1).
The values obtained for the pseudo-first-order and pseudo-second-order kinetic models are given in TABLE 4. It can be seen from the table that the correlation co-efficient (r) value obtained by pseudo-second-order model is higher than the pseudo-first-order model in all the studied conditions. In addition, the qe,cal values obtained by pseudo-second-order model are closer to that of the qe,exp values indicated that the pseudo-second-order model was better at describing the sorption system.
| Materials | Kinetic models | Parameters | 303 K | 313 K | 323 K | |||||||||
|---|---|---|---|---|---|---|---|---|---|---|---|---|---|---|
| 10 mg/L | 20 mg/L | 30 mg/L | 40 mg/L | 10 mg/L | 20 mg/L | 30 mg/L | 40 mg/L | 10 mg/L | 20 mg/L | 30 mg/L | 40 mg/L | |||
| RhB | Pseudofirst-order | kad (min-1) | 0.011 | 0.027 | 0.043 | 0.055 | 0.013 | 0.028 | 0.029 | 0.076 | 0.025 | 0.048 | 0.028 | 0.056 |
| R | 0.991 | 0.987 | 0.921 | 0.916 | 0.995 | 0.935 | 0.949 | 0.841 | 0.979 | 0.882 | 0.95 | 0.944 | ||
| Pseudo-second-order | qe (mg/g) | 3.988 | 7.039 | 9.712 | 12.466 | 3.885 | 6.376 | 9.21 | 12.029 | 3.861 | 3.42 | 8.915 | 11.198 | |
| k×10-2 (g/mg min) | 4.258 | 1.237 | 7.246 | 3.589 | 4.013 | 1.866 | 7.061 | 3.831 | 3.18 | 5.27 | 5.677 | 3.626 | ||
| h (mg/g min) | 0.677 | 0.613 | 0.683 | 0.558 | 0.606 | 0.758 | 0.599 | 0.554 | 0.474 | 0.616 | 0.451 | 0.455 | ||
| R | 0.999 | 0.997 | 0.998 | 0.996 | 0.999 | 0.997 | 0.992 | 0.995 | 0.998 | 0.996 | 0.99 | 0.991 | ||
| AO7 | Pseudo-first-order | kad (min-1) | 0.012 | 0.038 | 0.034 | 0.028 | 0.039 | 0.236 | 0.091 | 0.143 | 0.058 | 0.17 | 0.148 | 0.11 |
| R | 0.985 | 0.921 | 0.928 | 0.947 | 0.998 | 0.833 | 0.932 | 0.87 | 0.999 | 0.852 | 0.866 | 0.925 | ||
| Pseudo-second-order | qe (mg/g) | 4.131 | 6.968 | 9.991 | 11.266 | 4.014 | 6.839 | 9.319 | 10.783 | 4.002 | 6.536 | 8.869 | 10.001 | |
| k×10-2 (g/mg min) | 4.711 | 2.155 | 1.474 | 1.954 | 9.251 | 6.231 | 5.208 | 5.281 | 6.455 | 3.551 | 4.58 | 5.498 | ||
| h (mg/g min) | 0.804 | 1.047 | 1.471 | 2.48 | 1.49 | 2.914 | 4.523 | 6.14 | 1.034 | 1.517 | 3.603 | 5.499 | ||
| R | 1 | 0.998 | 0.998 | 0.999 | 0.999 | 0.999 | 0.998 | 0.999 | 0.999 | 0.995 | 0.998 | 0.999 | ||
Table 4: Kinetic parameters of DIPSAC at different temperatures with different initial concentrations
Diffusion-based models
In a solid-liquid sorption process the transfer of solute is characterized by pore diffusion or particle diffusion control. The pore diffusion model used here was proposed by Weber and Morris [44]. The linear form of the equation is represented by:
 (17)
(17)
where, ki is the intraparticle rate constant (mgg-1min-0.5). The slope of the plot of qt against t0.5 will give the value of intraparticle rate constant.
A particle diffusion controlled sorption process [37] is represented by the equation:
 (18)
(18)
where, Ct and Ce are the dye concentration at time t and equilibrium, respectively, and kp is the particle rate constant (min-1). The value of particle rate constant is obtained by the slope of the plot of ln(1−Ct/Ce) against t.
The straight line plots of ln(1−Ct/Ce) vs. t and qt vs. t0.5 indicate the applicability of both particle and intraparticle diffusion models. The kp, ki and r values of particle and intraparticle diffusion models are illustrated in TABLE 5. The higher r values obtained for both particle and intraparticle diffusion models suggest that DIPSAC composite follow both the models on dye sorption.
| Materials | Kinetic models | Parameters | 303 K | 313 K | 323 K | |||||||||
|---|---|---|---|---|---|---|---|---|---|---|---|---|---|---|
| 10 mg/L | 20 mg/L | 30 mg/L | 40 mg/L | 10 mg/L | 20 mg/L | 30 mg/L | 40 mg/L | 10 mg/L | 20 mg/L | 30 mg/L | 40 mg/L | |||
| RhB | Particle diffusion | kp (min-1) | 0.212 | 1.206 | 1.568 | 1.847 | 0.153 | 1.052 | 1.542 | 1.795 | 0.354 | 1.062 | 1.573 | 1.794 |
| R | 0.992 | 0.994 | 0.992 | 0.994 | 0.984 | 0.995 | 0.997 | 0.997 | 0.97 | 0.996 | 0.996 | 0.989 | ||
| Sd | 0.089 | 0.028 | 0.026 | 0.022 | 0.126 | 0.018 | 0.016 | 0.015 | 0.225 | 0.016 | 0.017 | 0.024 | ||
| Intraparticle diffusion | ki (mg/g min0.5) | 2.543 | 3.063 | 3.383 | 2.341 | 2.46 | 3.576 | 3.237 | 2.451 | 2.154 | 3.114 | 2.22 | 1.801 | |
| R | 0.992 | 0.995 | 0.996 | 0.998 | 0.997 | 0.993 | 0.992 | 0.999 | 0.996 | 0.99 | 0.994 | 0.993 | ||
| Sd | 0.04 | 0.082 | 0.11 | 0.131 | 0.024 | 0.068 | 0.151 | 0.097 | 0.032 | 0.085 | 0.14 | 0.214 | ||
| AO7 | Particle diffusion | kp (min-1) | 0.44 | 0.952 | 1.251 | 1.44 | 0.413 | 0.913 | 1.22 | 1.457 | 0.56 | 1.122 | 1.259 | 1.473 |
| R | 0.993 | 0.998 | 0.998 | 0.998 | 0.991 | 0.997 | 0.998 | 0.999 | 0.99 | 0.998 | 0.999 | 0.999 | ||
| Sd | 0.152 | 0.012 | 0.011 | 0.006 | 0.122 | 0.016 | 0.009 | 0.004 | 0.126 | 0.013 | 0.006 | 0.003 | ||
| Intraparticle diffusion | ki (mg/g min0.5) | 2.755 | 4.415 | 6.292 | 8.287 | 2.2 | 4.147 | 6.12 | 7.545 | 0.56 | 1.122 | 1.259 | 1.473 | |
| R | 0.988 | 0.994 | 0.992 | 0.988 | 0.997 | 0.996 | 0.992 | 0.99 | 0.99 | 0.998 | 0.999 | 0.999 | ||
| Sd | 0.048 | 0.06 | 0.097 | 0.095 | 0.029 | 0.048 | 0.087 | 0.096 | 0.126 | 0.013 | 0.006 | 0.003 | ||
Table 5: Particle and Intraparticle kinetic model parameters of DIPSAC at different temperatures with different initial concentrations.
Conclusion
In this study, DIPSAC tested as biosorbent for the removal of RhB and AO7 dyes from aqueous solution was investigated by batch method. The removal of RhB and AO7 dyes by DIPSAC was highly pH dependent. The obtained results indicate that the De-inked Pulp Sludge which was treated with Phosphoric acid and got the product called DIPSAC can be successfully used as biosorbent for these dyes in aqueous solution. The removal of RhB and AO7 dyes by DIPSAC was further supported by the FTIR and EDAX analysis. The maximum adsorption capacities of the DIPSAC for RhB and AO7 are found to be 11.51 and 12.88 mgg-1 respectively. The adsorption isotherms of both dyes from aqueous solutions onto DIPSAC were also determined. For both dyes tested, the equilibrium data were fitted to the Freundlich isotherm model. The results of thermodynamic studies revealed the exothermic and spontaneous nature of the adsorption process of both the dyes.
The kinetics of both dyes adsorptions onto DIPSAC follows the pseudo-second-order model. The DIPSAC, being a waste material, could be an alternative for costly adsorbents used for dye removal in wastewater treatment processes.
Acknowledgement
One of the authors (P. Rajeshkanna) is thankful to the Tamilnadu Newsprint and Papers Ltd, Karur, Tamil Nadu, India for preparing the adsorbent and National Institute of Technology, Thiruchirappalli, India for providing XRD facilities.
References
- AKSU Z. Application of biosorption for the removal of organic pollutants: a review. Process Biochem. 2005;40(3-4):997-1026.
- Bhattacharyya KG, Sharma A. Azadirachta indica leaf powder as an effective biosorbent for dyes:A case study with aqueous Congo Red solutions. Journal of Environmental Management. 2004;71(3):217-29.
- Namasivayam C, Radhika R, Suba S. Uptake of dyes by a promising locally available agricultural solid waste: coir pith. Waste management. 2001;21(4):381-7.
- Chatterjee S, Chatterjee S, Chatterjee BP, et al. Adsorptive removal of congo red, a carcinogenic textile dye by chitosan hydrobeads: Binding mechanism, equilibrium and kinetics. Colloids and Surfaces A: Physicochemical and Engineering Aspects. 2007;299(1-3):146-52.
- Sachdeva S, Kumar A. Preparation of nanoporous composite carbon membrane for separation of rhodamine B dye. Journal of Membrane Science. 2009;329(1-2):2-10.
- Muthuraman G, Teng TT. Use of vegetable oil in supported liquid membrane for the transport of Rhodamine B. Desalination. 2009;249(3):1062-6.
- Yuan Q, Liu Y, Li LL, et al. Highly ordered mesoporous titania-zirconia photocatalyst for applications in degradation of rhodamine-B and hydrogen evolution. Microporous and Mesoporous Materials. 2009;124(1-3):169-78.
- Li Y, Sun S, Ma M, et al. Kinetic study and model of the photocatalytic degradation of rhodamine B (RhB) by a TiO2-coated activated carbon catalyst: Effects of initial RhB content, light intensity and TiO2 content in the catalyst. Chemical Engineering Journal. 2008;142(2):147-55.
- He Z, Yang S, Ju Y, et al. Microwave photocatalytic degradation of Rhodamine B using TiO2 supported on activated carbon:Mechanism implication. Journal of Environmental Sciences. 2009;21(2):268-72.
- Song XM, Wu JM, Yan M. Photocatalytic and photoelectrocatalytic degradation of aqueous Rhodamine B by low-temperature deposited anatase thin films. Materials chemistry and physics. 2008;112(2):510-5.
- Belver C, Adán C, Fernández-García M. Photocatalytic behaviour of Bi2MO6 polymetalates for rhodamine B degradation. Catalysis today. 2009;143(3-4):274-81.
- Yi X, Liqin D, Lizhen A, et al. Photocatalytic degradation of rhodamine B and phenol by TiO2 loaded on mesoporous graphitic carbon. Chinese Journal of Catalysis. 2008;29(1):31-6.
- He Z, Sun C, Yang S, et al. Photocatalytic degradation of rhodamine B by Bi2WO6 with electron accepting agent under microwave irradiation: mechanism and pathway. Journal of Hazardous Materials. 2009;162(2-3):1477-86.
- Martinez-de La Cruz A, Perez UG. Photocatalytic properties of BiVO4 prepared by the co-precipitation method: Degradation of rhodamine B and possible reaction mechanisms under visible irradiation. Materials Research Bulletin. 2010;45(2):135-41.
- King P, Rakesh N, Lahari SB, et al. Biosorption of zinc onto Syzygium cumini L.: Equilibrium and kinetic studies. Chemical Engineering Journal. 2008;144(2):181-7.
- Parab H, Sudersanan M, Shenoy N, et al. Use of agro?industrial wastes for removal of basic dyes from aqueous solutions. Clean-Soil, Air, Water. 2009;37(12):963-9.
- Mohamed AR, Mohammadi M, Darzi GN. Preparation of carbon molecular sieve from lignocellulosic biomass: A review. Renewable and Sustainable Energy Reviews. 2010;14(6):1591-9.
- Sureshkumar MV, Namasivayam C. Adsorption behavior of Direct Red 12B and Rhodamine B from water onto surfactant-modified coconut coir pith. Colloids and Surfaces A: Physicochemical and Engineering Aspects. 2008;317(1-3):277-83.
- Gad HM, El-Sayed AA. Activated carbon from agricultural by-products for the removal of Rhodamine-B from aqueous solution. Journal of Hazardous Materials. 2009;168(2-3):1070-81.
- ISI, Methods of sampling and tests for activated carbon used for decolourising vegetable oils and sugar solutions, Indian Standards Institute (ISI).1977; 877.
- DG Kannibyrgh , JK Syeers, ML Jakson. Soil. Si. Soc. Am. Proc. 975:646.
- AW Adamson. Physical chemistry of surfaces. USA: John Wiley and sons;1976.
- Lopez-Ramon MV, Stoeckli F, Moreno-Castilla C, et al. On the characterization of acidic and basic surface sites on carbons by various techniques. Carbon. 1999;37(8):1215-21.
- Attia AA, Rashwan WE, Khedr SA. Capacity of activated carbon in the removal of acid dyes subsequent to its thermal treatment. Dyes and Pigments. 2006;69(3):128-36.
- Khaled A, El Nemr A, El-Sikaily A, et al. Removal of Direct N Blue-106 from artificial textile dye effluent using activated carbon from orange peel: Adsorption isotherm and kinetic studies. Journal of Hazardous Materials. 2009;165(1-3):100-10.
- Thinakaran N, Panneerselvam P, Baskaralingam P, et al. Equilibrium and kinetic studies on the removal of Acid Red 114 from aqueous solutions using activated carbons prepared from seed shells. Journal of hazardous materials. 2008;158(1):142-50.
- Smith BC. Infrared spectral interpretation: A systematic approach. CRC press; 1998.
- J Coates J. Interpretation of infrared spectra, a practical approach. Encyclopedia of analytical chemistry. 2000;12(108):15-37.
- Szymanski HA, Erickson RE. Infrared Absorption Bands. Infrared Band Handbook . USA. Springer ;1970 (pp. 1-754).
- Arami M, Limaee NY, Mahmoodi NM, et al. Removal of dyes from colored textile wastewater by orange peel adsorbent: equilibrium and kinetic studies. Journal of Colloid and interface Science. 2005;288(2):371-6.
- Li L, Liu S, Zhu T. Application of activated carbon derived from scrap tires for adsorption of Rhodamine B. Journal of Environmental Sciences (China). 2010;22(8):1273-80.
- Zhang G, Qu J, Liu H, et al. CuFe2O4/activated carbon composite: A novel magnetic adsorbent for the removal of acid orange II and catalytic regeneration. Chemosphere. 2007;68(6):1058-66.
- Namasivayam C, Kavitha D. Removal of Congo Red from water by adsorption onto activated carbon prepared from coir pith, an agricultural solid waste. Dyes and pigments. 2002;54(1):47-58.
- Yenikaya C, Atar E, Olgun A, et al. Biosorption study of anionic dyes from aqueous solutions using Bacillus amyloliquefaciens. Engineering in Life Sciences. 2010;10(3):233-41.
- Zhang Z, O?Hara IM, Kent GA, et al. Comparative study on adsorption of two cationic dyes by milled sugarcane bagasse. Industrial Crops and Products. 2013;42:41-9.
- Marandi R, Sepehr SM. Removal of orange 7 dye from wastewater used by natural adsorbent of Moringa oleifera seeds. Am J Environ Eng. 2011;1(1):1-9.
- Meenakshi S, Viswanathan N. Identification of selective ion-exchange resin for fluoride sorption. Journal of colloid and interface science. 2007;308(2):438-50.
- Karthik R, Meenakshi S. Removal of Pb (II) and Cd (II) ions from aqueous solution using polyaniline grafted chitosan. Chemical Engineering Journal. 2015;263:168-77.
- Kumar R, Ansari MO, Barakat MA. DBSA doped polyaniline/multi-walled carbon nanotubes composite for high efficiency removal of Cr (VI) from aqueous solution. Chemical engineering journal. 2013;228:748-55.
- Sun C, Li C, Wang C, Qu R, Niu Y, Geng H. Comparison studies of adsorption properties for Hg (II) and Au (III) on polystyrene-supported bis-8-oxyquinoline-terminated open-chain crown ether. Chemical engineering journal. 2012;200:291-9.
- Alkan M, Demirba? Ö, Do?an M. Adsorption kinetics and thermodynamics of an anionic dye onto sepiolite. Microporous and Mesoporous Materials. 2007;101(3):388-96.
- Lagergren S. Zur theorie der sogenannten adsorption geloster stoffe. Kungliga svenska vetenskapsakademiens. Handlingar. 1898;24:1-39.
- Ho YS. Second-order kinetic model for the sorption of cadmium onto tree fern: a comparison of linear and non-linear methods. Water research. 2006;40(1):119-25.
- Weber WJ, Morris JC. Kinetics of adsorption on carbon from solution. Journal of the Sanitary Engineering Division. 1963;89(2):31-60.
