Research
, Volume: 15( 1) DOI: 10.37532/0974-7435.2019.15(1).187Result Enhancement of Biological Transistor Amplifier Circuit using Nanoparticles
- *Correspondence:
- Killol V Pandya Department of Electronics and Communication, CSPIT, Charusat University, Gujarat, India, E-Mail: killolpandya.ec@charusat.ac.in
Received: January 23, 2019; Accepted: February 05, 2019; Published: February 12, 2019
Citation: Pandya KV. Result Enhancement of Biological Transistor Amplifier Circuit using Nanoparticles. Biotechnol Ind J.
2019;15(1):187.
Abstract
Enough research has been carried out till date based on conventional solid state electronic circuits. Few authors have tuned the research towards liquid conductivity and its systematic analysis. Liquid electronic circuits have shown great potential in the domain of biotechnology and biomedical science. In the earlier research, author have successfully demonstrated and analyzed biological liquid electronic circuits. In this communication, author have presented and compared result analysis of liquid electronic circuit with and without nano particles. It shows considerable improvements in the results using nano particles. The author has claimed that with the help of nano particles, the behavior of the transistor amplifier circuit has been improved to a desire level. The presented communication says that nano particles play a vital role in the conductivity of the liquid.
Keywords
Liquid electronic circuits; Nano particles; Synthetic plasma; Density liquids; Absolute gain
Introduction
G Ben Hmida and his team worked on the analysis of cellular electrical activity [1]. The authors have done the task by electrical recording from human cells. After the successful theoretical study, they proposed a novel human implantable neural recording system which can extract the power from the live human cell and supply the same power for the biomedical neural recording system. SP Kosta and his team have first ever claimed that low-frequency components are feasible to design using human body parts (tissue and skin) [2-4]. Killol Pandya and SP Kosta have successfully demonstrated a liquid electronic transistor amplifier circuit using synthetic plasma [5]. Zedong Nie et al reported that human beings can be a very effective and promising path for short-range communication [6]. The authors confessed that sensors could be automatically rechargeable because there is no alternative way to recharge or change the battery on the sensor nodes. SP Kosta and et al have demonstrated the feasibility of liquid medium (synthetic plasma) to develop bio-transistor, bio-resistor, and bio-capacitor and combined them to form an amplifier using the metallic harness (the interconnecting copper wires and pieces) [7,8]. Yogesh P Patil and his team tried to find out the effect of nanoparticles into the human body because they are always present in any humans [9]. The authors stated that nanoparticles can be entered into the human body by either breathing, eating food or even with any kind of hair treatment. Nanoparticles are very much smaller in size so that they can easily travel through any human blood cell and may cause damage. Marc Weghmular and his team have reported that human body could be the alternative of conducting medium at low frequency [10,11].
Materials and Methods
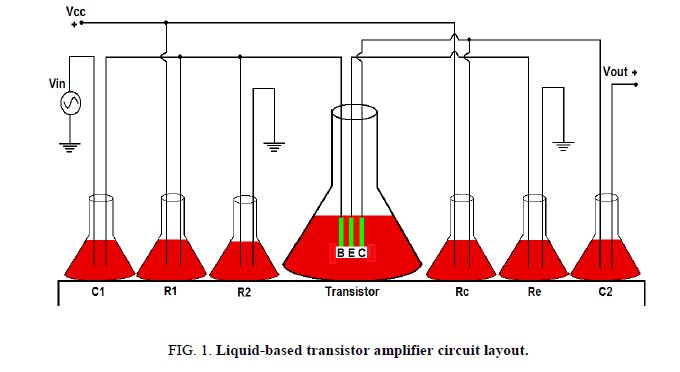
The author has prepared synthetic plasma in the applied science laboratories. Nanoparticles have been formed in the department of the pharmacy. The author has demonstrated various low-frequency components using synthetic plasma. As shown in FIG. 1, each beaker represents each component from the capacitor (C) and resistor (R). The figure shows the layout of the experimental setup of a liquid transistor amplifier circuit where excitation is given to the circuit in the form of the AC signal. The behavior of the circuit has been observed using cathode ray oscilloscope. Like the previous experiments, authors made the mechanical setup to get the stability of the liquid at the room temperature.
Here, unlike the previous one, nanoparticles have been added in each beaker liquid. Nanoparticles have been made in powder form in the laboratories. In every beaker, 10 gms nanoparticles have been added and dissolved in the conducting liquid. The same proportion ratio has been maintained in a big beaker.
After systematically dissolving nanoparticles inside the liquid, the response of the aforesaid circuit has been noted that showed betterment in the result as compared with the previous one (without nanoparticles).
Analysis and statistics without nanoparticles
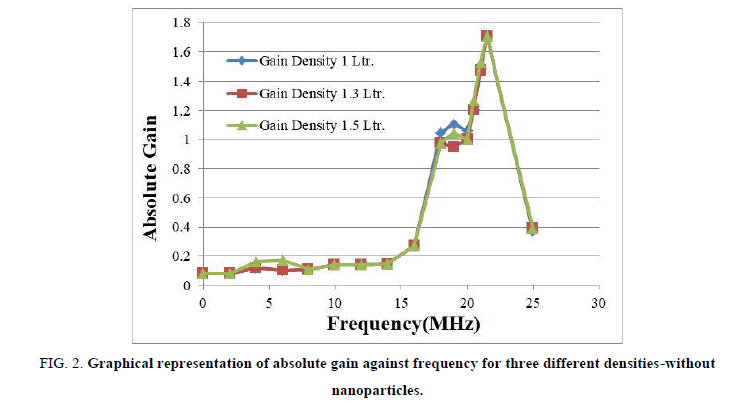
TABLE 1 shows the absolute gain variation over the frequency variation. The authors had used three different density liquids to get the stable behavior of the circuit. It is observed from the table itself that pure amplification could be achieved from 18 MHz to 22 MHz frequency.
| Frequency (MHz) | Absolute Gain=Vout/Vin | ||
|---|---|---|---|
| Density 1 Ltr | Density 1.3 Ltr | Density 1.5 Ltr | |
| 0.00 | 0.08 | 0.08 | 0.08 |
| 2.00 | 0.08 | 0.08 | 0.08 |
| 4.00 | 0.12 | 0.12 | 0.16 |
| 6.00 | 0.10 | 0.10 | 0.17 |
| 8.00 | 0.11 | 0.11 | 0.11 |
| 10.00 | 0.14 | 0.14 | 0.14 |
| 12.00 | 0.14 | 0.14 | 0.14 |
| 14.00 | 0.15 | 0.15 | 0.15 |
| 16.00 | 0.27 | 0.27 | 0.27 |
| 18.00 | 1.05 | 0.98 | 0.98 |
| 19.00 | 1.11 | 0.95 | 1.05 |
| 20.00 | 1.06 | 1.00 | 1.00 |
| 20.50 | 1.21 | 1.21 | 1.27 |
| 21.00 | 1.47 | 1.47 | 1.53 |
| 21.50 | 1.71 | 1.71 | 1.71 |
| 25.00 | 0.37 | 0.39 | 0.39 |
TABLE 1. Absolute gain vs. frequency without nanoparticles.
FIG. 2 shows graphical representations for the same. It depicts overlapping lines for most of the frequency period which shows an almost similar response from three different density liquids.
FIG 2: Graphical representation of absolute gain against frequency for three different densities-without nanoparticles.
Analysis and statistics with nanoparticles
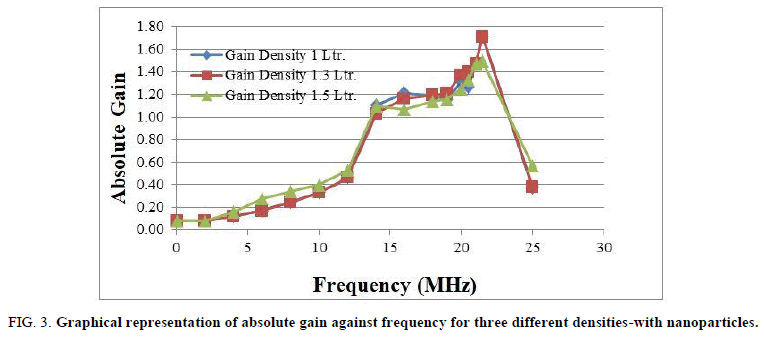
Similar experiments have been repeated after dissolving nanoparticles in the liquid medium. 5 ml liquid nanoparticles have been added in each beaker containing 50 ml liquid synthetic plasma. TABLE 2 shows similar statistics of absolute gain over frequency in the presence of nanoparticles. As nanoparticles added to each beaker, conductivity has been increased up to a certain level. From the table, it is observed that amplification is achieved from 14 MHz to 22 MHz frequency. In previous case amplification was achieved from 18 MHz to 22 MHz so it could be noted that using nanoparticles, amplification is possible over a large range of frequency.
| Frequency (MHz) | Absolute Gain=Vout/Vin | ||
|---|---|---|---|
| Density 1 Ltr | Density 1.3 Ltr | Density 1.5 Ltr | |
| 0.00 | 0.08 | 0.08 | 0.08 |
| 2.00 | 0.08 | 0.08 | 0.08 |
| 4.00 | 0.12 | 0.12 | 0.16 |
| 6.00 | 0.17 | 0.17 | 0.28 |
| 8.00 | 0.24 | 0.24 | 0.34 |
| 10.00 | 0.33 | 0.33 | 0.4 |
| 12.00 | 0.46 | 0.46 | 0.53 |
| 14.00 | 1.10 | 1.03 | 1.10 |
| 16.00 | 1.21 | 1.17 | 1.07 |
| 18.00 | 1.20 | 1.20 | 1.14 |
| 19.00 | 1.16 | 1.21 | 1.16 |
| 20.00 | 1.31 | 1.38 | 1.25 |
| 20.50 | 1.27 | 1.40 | 1.33 |
| 21.00 | 1.47 | 1.47 | 1.47 |
| 21.50 | 1.71 | 1.71 | 1.50 |
| 25.00 | 0.37 | 0.39 | 0.57 |
TABLE 2. Absolute gain vs frequency with nanoparticles.
FIG. 3 depicts the number of readings lie above the line where the absolute gain is 1. Of course, the shape of absolute gain variation is similar to the previous one but still pure amplification could be easily observed over a large period of frequency. Again, overlapping of lines shows the similar tendency of behavior of different density liquids. Though the other frequencies where response lines below absolute gain 1, they are even useful in some specific applications where attenuation is required. So the overall response from the circuit could be utilized for either application. Here, authors have investigated the circuit in MHz frequency range because the realization of low-frequency components is different at high frequencies, especially in GHz.
FIG 3: Graphical representation of absolute gain against frequency for three different densities-with nanoparticles.
Liquid integrated circuit
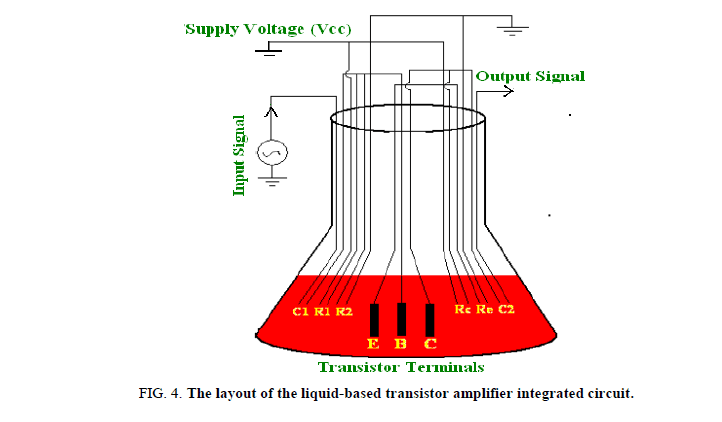
The authors have successfully developed a liquid Integrated Circuit (IC). All the necessary initiatives have been taken and results have been carried out that is presented in this section. FIG. 4 depicts the layout of the world’s first liquid IC. A novel concept of a liquid integrated circuit has been successfully demonstrated by inserting all necessary metallic wires inside the single big beaker. A mechanical wooden solid box has been designed in which numbers of holes are created so that metallic wires can be inserted inside the beaker by having similar distances between them.
Analysis and statistics without nanoparticles
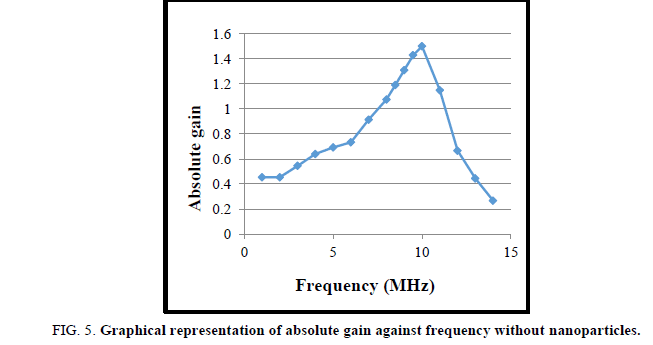
TABLE 3 shows the measured result in a tabular form. The table shows absolute gain above 1 for a certain frequency range which supports a novel idea to develop liquid based electronic integrated circuit. Here also amplification can be achieved at low frequencies. The analysis of the result says that by keeping a proper distance between two probes and also between two pairs of probes, the desired response can be achieved. As described earlier, mechanical instrumentation has been done but it can be improved to get improvement in result. The result has been carried out immediately after inserting the copper wires into the liquid because ionization takes place because of many copper wires insertion inside a single beaker liquid. This is for the first time so only liquid-based transistor amplifier integrated circuit has been developed and presented here.
| Frequency(MHz) | Vin (V) | Vout (V) | Absolute Gain=Vout/Vin |
|---|---|---|---|
| 1.00 | 1.10 | 0.50 | 0.45 |
| 2.00 | 1.10 | 0.50 | 0.45 |
| 3.00 | 1.10 | 0.60 | 0.55 |
| 4.00 | 1.25 | 0.80 | 0.64 |
| 5.00 | 1.30 | 0.90 | 0.69 |
| 6.00 | 1.50 | 1.10 | 0.73 |
| 7.00 | 1.75 | 1.60 | 0.91 |
| 8.00 | 2.00 | 2.15 | 1.08 |
| 8.50 | 2.10 | 2.50 | 1.19 |
| 9.00 | 2.10 | 2.75 | 1.31 |
| 9.50 | 2.10 | 3.00 | 1.43 |
| 10.00 | 2.00 | 3.00 | 1.50 |
| 11.00 | 2.00 | 2.30 | 1.15 |
| 12.00 | 2.25 | 1.50 | 0.67 |
| 13.00 | 2.25 | 1.00 | 0.44 |
| 14.00 | 2.25 | 0.60 | 0.27 |
| 15.00 | 1.75 | 0.45 | 0.26 |
TABLE 3. Absolute gain against frequency for liquid IC without nanoparticles.
FIG. 5 shows absolute gain against frequency analysis in a graphical fashion. Here as above, the absolute gain can be directly calculated from the ratio of Vout to Vin. For better understanding, all possible frequency variation has been given to exciting the liquid circuit. Pure amplification could be calculated at the points we here absolute gain is above one. Keeping this in mind, it is clear from FIG. 5 that pure amplification is achieved from 7 MHz to 11 MHz. Between some range of frequencies, attenuation could be observed however it is also useful for a few electronic circuits like attenuators. Like a separate component electronic circuit, integrated circuit gives the desired response which supports the novel idea of biological liquid integrated circuit realization.
Analysis and statistics with nanoparticles
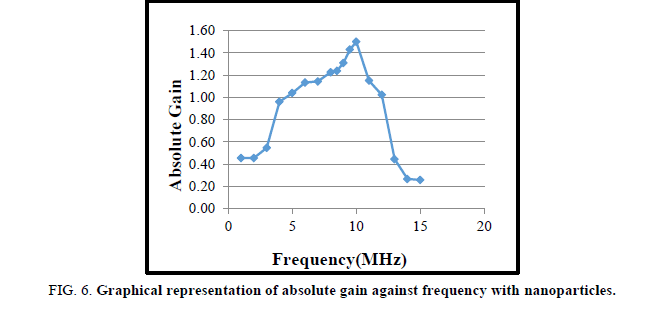
Collectively, 35 ml of liquid nanoparticles have been added in a big beaker having almost 300 ml synthetic plasma. TABLE 4 shows similar analysis between absolute gain and frequency in the presence of nanoparticles. The table depicts that over a large frequency range from 5 MHz to 12 MHz, amplification could be achieved which is very improved compared with a similar experiment without nanoparticles.
| Frequency(MHz) | Vin (V) | Vout (V) | Absolute Gain=Vout/Vin |
|---|---|---|---|
| 1.00 | 1.10 | 0.50 | 0.45 |
| 2.00 | 1.10 | 0.50 | 0.45 |
| 3.00 | 1.10 | 0.60 | 0.55 |
| 4.00 | 1.25 | 1.20 | 0.96 |
| 5.00 | 1.30 | 1.35 | 1.04 |
| 6.00 | 1.50 | 1.70 | 1.13 |
| 7.00 | 1.75 | 2.00 | 1.14 |
| 8.00 | 2.00 | 2.45 | 1.23 |
| 8.50 | 2.10 | 2.60 | 1.24 |
| 9.00 | 2.10 | 2.75 | 1.31 |
| 9.50 | 2.10 | 3.00 | 1.43 |
| 10.00 | 2.00 | 3.00 | 1.50 |
| 11.00 | 2.00 | 2.30 | 1.15 |
| 12.00 | 2.25 | 2.30 | 1.02 |
| 13.00 | 2.25 | 1.00 | 0.44 |
| 14.00 | 2.25 | 0.60 | 0.27 |
| 15.00 | 1.75 | 0.45 | 0.26 |
TABLE 4. Absolute gain against frequency for liquid IC with nanoparticles.
Similarly, a graphical representation has been carried out in FIG. 6 to observe the amplification. Here also pure amplification could be observed over the large range of frequency.
Conclusion
In the present communication, the authors have systematically checked the behavior of nanoparticles added liquid transistor amplifier circuit for different density liquids. Here, it has been proved that nanoparticles are great carriers of conduction and it can play a significant role in liquid electronic circuit behavior. After adequate research, it was found that handsome improvement could be achieved in the result of a liquid electronic circuit using nanoparticles.
Conflicts of Interest
The authors declare no conflicts of interest.
Acknowledgment
The author would like to thank CHARUSAT University for their direct and indirect support.
References
- Hmida GB, Ekuakille AL, Kachouri A, et al. Extracting electric power from the human body for supplying a neural recording system. measurement. 2009;4:5.
- Kosta SP, Dubey A, Gupta P, et al. First physical model of human tissue skin based memristors and their network. Int J Med Eng Inform. 2013;5(1):5-19.
- Kosta SP, Kosta YP, Bhatele M, et al. Human blood liquid memristor. Int J Med Eng Inform. 2011;3(1):16-29.
- Kosta SP, Bhatele M, Chuadhari JP, et al. Human blood-based electronic transistor. Int J Med Eng Inform. 2012;4(4):373-86.
- Kosta SP, Manavadaria M, Pandya K, et al. Human blood plasma-based electronic integrated circuit amplifier configuration. J Biomed Res. 2013;27(6):520.
- Nie Z, Li Z, Huang R, et al. A statistical frame based TDMA protocol for human body communication. Biomed Eng Online. 2015;14(1):65.
- Killol P, Shivprasad K. Synthetic plasma and silicon tubular harness-based pure biological transistor amplifier circuit. J Biomed Res. 2017;31(5):466.
- Pandya K. Designing and implementation of liquid electronic circuits using implantable material-first step towards the human-circuit interface. Am J of Biomed Sci. 2017;9(4).
- Patil YP, Pawar SH, Jadhav S, et al. Biochemistry of metal absorption in the human body: Reference to check the impact of nanoparticles on a human being. Int J Sci Res Publ. 2013;3:1-5.
- Wegmueller MS, Kuhn A, Froehlich J, et al. An attempt to model the human body as a communication channel. IEEE Trans Biomed Eng. 2007;54(10):1851-57.
- Wegmueller M, Felber N, Fichtner W, et al. Measurement system for the characterization of the human body as a communication channel at a low frequency. In 2005 IEEE Engineering in medicine and Biology 27th Annual Conference 2006:3502-05.
