Original Article
tsm, Volume: 12( 2)Response Surface Methodology for the Competitive Sorption of Metal ions from Aqueous Medium using Starch-Graft-Copolymer
- *Correspondence:
- Ekebafe L, Polymer Technology Department, Auchi Polytechnic, Auchi, Nigeria, Tel: +2348029320114, +2348088785639; E-mail: lawekebafe@gmail.com
Received: April 4, 2017; Accepted: May 17, 2017; Published: May 17, 2017
Citation: Ekebafe LO, Ogbeifun DE, Okieimen FE and Amenaghawon AN Response Surface Methodology for the Competitive Sorption of Metal ions from Aqueous Medium using Starch- Graft- Copolymer Macromol Ind J.2017;12(2):104.
Abstract
The competitive sorption of Cu (II), Pb (II) and Cd (II) by graft copolymer of cassava starch and acrylic acid was investigated using the response surface methodology. Optimization of the medium conditions was studied through experimental design. Response surface methodology including central composite design was successfully applied to develop a response surface to optimize the medium conditions. The most influential medium parameters were determined as initial concentration, contact time and temperature. The optimum conditions were evaluated to be 41.89 mg/l, 5.66 h, and 26.11°C, for all the ions in solution, representing the initial concentration, contact time, and temperature. At these optimum conditions, the sorption yield, sorption capacity and the coefficient of determination were evaluated as follows: for Cu (II) ions 92.05 %, 38.56 mg/l and 0.963 mg/lrespectively, for Pb (II) 66.60 %, 27.9 mg/l, and 0.941 and for Cd (II) 42.90%, 17.97 mg/l and 0.904 respectively. The sorption affinity for the metals follow the order Pb > Cu > Cd, this order suggests that electronegativity may be the most important factor as metal sorption increased with increasing electronegativity. Pb2+ sorption on the graft copolymer was competitively higher than Cd (II) and Cu (II).
Keywords
Graft co-polymer; Cassava starch; Response surface methodology; Copper; Lead; Cadmium; Sorption
Introduction
The recent surge of industrial activities has led to geometrical increase in the use of heavy metals, and other toxic chemicals, and inevitably resulted in an increased flux of these substances in to the environment. Environmental contamination by toxic heavy metals is becoming a serious dilemma now days due to their negative eco-toxicological effects and bioaccumulation in animals [1,2].
Contamination primarily result from industrial activities, such as iron and steel production, the non-ferrous metal industry, photographic and electroplating, gas exhaust, energy and fuel production, and generation of municipal wastes [3]. The contamination of water due to toxic heavy metal ions is accountable for causing several damages to the environment and adverse effects on public health. Heavy metals form compounds that can be toxic, carcinogenic or mutagenic even in low quantities and due to their mobility in natural water ecosystems, they are prioritized as major inorganic contaminants of the environment [4,5].
Conventional methods of studying heavy metals uptake by a bio sorbent process by maintaining other factors at unspecified constant levels do not show the combined effect of all the factors. Research effort for developing, improving and optimizing the adsorption process and to evaluate the significance of all the factors involved even in the presence of complex interactions is therefore necessary. Recently many statistical experimental design methods have been employed in chemical process optimization [6].
Design of experiments is a very useful tool as it provides statistical models, which help in understanding the interactions among the parameters that have been optimized [2,7]. Response surface methodology (RSM) is one of the experimental designing methods which can surmount the limitations of conventional methods collectively [4]. RSM is a combination of mathematical and statistical techniques used to determine the optimum operational conditions of the process or to determine a region that satisfies the operating specifications [8], the main advantage of RSM is the reduced number of experimental trials needed to evaluate multiple parameters and their interactions [9]. In this study therefore, RSM was used to design and optimized the sorption of Cu, Pb and Cd ions from aqueous solution using hydrolyzed starch graft poly (acrylic acid) copolymer.
Material and Methods
Materials
Reagent grade acrylic acid was supplied by Sigma Aldrich, Germany and was distilled under reduced pressure and stored in the dark at 5°C before use. Cassava starch was obtained from cassava roots sourced locally from Benin City, Nigeria. Cerium ammonium nitrate and other reagents used were of analytical grade and were supplied by Sigma Aldrich, Germany.
Preparation and characterization of the grafted copolymer
Preparation of the hydrolyzed cassava starch graft poly (acrylic acid) copolymer was prepared according to the method described by Okieimen et al. [10] and reported in Ekebafe et al. [11].
Competitive sorption studies of Cd2+, Cu2+ and Pb2+
Aqueous solutions containing a mixture of Cd2+, Cu2+, and Pb2+ with concentrations of each metal ion ranging from 10 to 50 ppm were prepared in the same solution.
Effect of heavy metal ions concentration on sorption
The conditions used to generate data (based on the RSM outcome) is as follows: sorbent dosage, 0.5 g copolymer in 100 ml of metal ion mixture solution; metal ions of same concentration ranges 2 ppm to 50 ppm for Cd2+, Cu2+, and Pb2+; the pH: 7.85 for all the sorption experiments; the shaking time was 18.25 h. In order to get the concentration of Cd2+ in the samples within the calibration range of 2 ppm to 10 ppm, it was necessary to dilute the sample 10-fold. The sorption experiments were carried out at 27.5°C.
Effect of contact time on sorption
In order to assess the rate of the sorption for Cd2+, Cu2+, and Pb2+, experiments were carried out under the following conditions: amount of copolymer: 0.5 g per 100 ml of solution; the initial metal concentration for Cd2+ Cu2+, and Pb2+: 20 ppm; the pH: 7.85 and the shaking time: 6 h, 12 h, 18 h, 24 h. The temperature of the mixtures was maintained at 27.5°C.
Effect of temperature on sorption
The conditions used to generate sorption thermodynamic data is as follows: sorbent dosage, 0.5 g copolymer in 100 ml of solution; metal ion concentration was 2 ppm for Cd2+, and 20 ppm for Cu2+ and Pb2+; the pH: 7.85 for all the adsorption experiments; the shaking time: 18.25 h. The adsorption experiments carried out with the temperature varied: 10°C, 20°C, 30°C, 40°C and 50°C.
Experimental design and optimization by response surface methodology (RSM)
A four independent variable central composite design (CDD) for response surface methodology was used to develop a statistical model relating the response (metal ions sorption) to the independent variables being studied (initial concentration, contact time, and temperature). The range of the variables that were optimized is shown in Table 1. The experimental design made up of 20 runs and the statistical model whose equation was determined by analysis of multiple regressions was developed using Design Expert 7.0.0 (Stat-ease, Inc. Minneapolis, USA). The 20 experimental runs were randomized to maximize the effects of unexplained variability in the observed responses due to extraneous factors. The coded and actual values of the independent variables were calculated as follows.
| Independent | Symbols | Coded and Actual Levels | ||||
|---|---|---|---|---|---|---|
| Variables | -2 | -1 | 0 | 1 | 2 | |
| Initial conc. (mg/L) | X1 | 10 | 18.11 | 30 | 41.89 | 50 |
| Contact time (h) | X2 | 1 | 5.66 | 12.5 | 19.34 | 24 |
| Temperature (ºC) | X3 | 20 | 26.08 | 35 | 43.92 | 50 |
Table 1. Coded and actual levels of the factors for four variable central composite design for competitive sorption process.
 (1)
(1)
Where xi and Xi are the coded and actual values of the independent variable respectively. Xo is the actual value of the independent variable at the centre point and Xi is the step change in the actual value of the independent variable. The following generalized second order polynomial equation was used to correlate the independent variables and to estimate the responses of the dependent variable as well as predicting the optimal point.
 (2)
(2)
Where Yi is the dependent variable or predicted response, Xi and Xj are the independent variables, bo is offset term, b is the regression coefficient and ei is the error term.
 (3)
(3)
Results
Preparation and characterization of the grafted copolymer
The results of the proximate analysis of the cassava starch, grafting characteristics, spectral and scanning characterization have been previously reported [11-13]. The characteristics of the cassava starch graft poly (acrylic acid) copolymer are show in (Table 2).
| Characteristics | values |
|---|---|
| Colour | White |
| Water Retention value (g/g) | 480 |
| Toxicity | No |
| Water Soluble | No |
| Dimension (µm) | 150-350 |
| Density (g/cm3) | 1.5 |
| pH | 8 |
| Graft yield (%) | 86.96 |
| Graft Efficiency (%) | 70.82 |
| Graft Frequency/AGU | 83.98 |
| Molecular Weight | 96,446.88 |
Table 2. Characteristics of the starch graft poly (acrylic acid) copolymer.
Statistical modeling of the metal ions sorption by grafted starch copolymer
The results obtained from the 20 experimental runs carried out according to the central composite design are summarized in Table 3. Equation (3) is the quadratic statistical model in terms of actual variables that was obtained after applying multiple regression analysis to the experimental data presented in Table 1. The values of copper removal as predicted by Equation (3) are also presented in Table 3.
| Source | Sum of squares | df | Mean square | F value | p-value |
|---|---|---|---|---|---|
| Model | 386.41 | 8 | 48.3 | 12.95 | 0.0001 |
| X1 | 357.88 | 1 | 357.88 | 95.98 | < 0.0001 |
| X2 | 13.42 | 1 | 13.42 | 3.6 | 0.0844 |
| X3 | 1.74 | 1 | 1.74 | 0.47 | 0.5082 |
| X1X2 | 0.072 | 1 | 0.072 | 0.019 | 0.8918 |
| X1X3 | 1.86 | 1 | 1.86 | 0.5 | 0.4944 |
| X2X3 | 0.1 | 1 | 0.1 | 0.027 | 0.8721 |
| X22 | 2.33 | 1 | 2.33 | 0.63 | 0.4458 |
| X32 | 8.12 | 1 | 8.12 | 2.18 | 0.168 |
| Residual | 41.01 | 11 | 3.73 | ||
| Lack of Fit | 7.46 | 6 | 1.24 | 0.19 | 0.9682 |
| Pure Error | 33.55 | 5 | 6.71 | ||
| Cor Total | 427.43 | 19 |
Table 3. ANOVA results for statistical model for the competitive sorption of cadmium by HSPAA.
The sorption capacity of the hydrolyzed starch graft poly (acrylic acid) HSPAA for the competitive sorption of the metal ions is summarized in Tables 3-11. The equation is a regression statistical model used to compare the predicted results with the experimental results. It indicates good agreement between the experimental and predicted values. Statistical testing of the model was performed with the statistical test for analyses of variance (ANOVA), as shown in Tables 3-11. The significance of each model is assessed from the coefficient (R2) which is found to be 0.963 (Cu (II), 0.941 Pb (II), and 0.904 Cd (II), implying that 3.7 % for Cu (II), 5.9 % for Pb (II), and 9.6 % for Cd (II) of the variation in the independent variables response that cannot be explained by this model. The model F-value of 35.49 for Cu (II), 22.04 for Pb and 12.95 for Cd, implies that the model is significant. The significance of each term in this model is also evaluated by probability (p) value. If p value is lower than 0.05, it means that the term is significant at 95 % confidence level. According to the ANOVA analysis, it is observed that model, and derived models are significant model terms. In usual cases, the term with p > 0.05 can be omitted from the model. However, in this study, the insignificant terms are still maintained to support the hierarchical nature of this model [14].
| Factors | Response | |||||||
|---|---|---|---|---|---|---|---|---|
| Run No |
Coded levels | Actual values | Amount adsorbed | |||||
| ppm | ||||||||
| X1 | X2 | X3 | X1 | X2 | X3 | Observed | Predicted | |
| 1 | -1 | -1 | -1 | 18.11 | 5.66 | 26.08 | 5.77 | 5.73 |
| 2 | -1 | -1 | 1 | 18.11 | 5.66 | 43.92 | 5.21 | 4.27 |
| 3 | -1 | 1 | -1 | 18.11 | 19.34 | 26.08 | 7.4 | 8.13 |
| 4 | 1.68 | 0 | 0 | 50 | 12.5 | 35 | 20.11 | 20.16 |
| 5 | 0 | 0 | 0 | 30 | 12.5 | 35 | 12.55 | 11.55 |
| 6 | 0 | 0 | -1.68 | 30 | 12.5 | 20 | 11.01 | 10.04 |
| 7 | 0 | -1.68 | 0 | 30 | 1 | 35 | 10.01 | 11.02 |
| 8 | 0 | 0 | 1.68 | 30 | 12.5 | 50 | 8.12 | 8.84 |
| 9 | 0 | 0 | 0 | 30 | 12.5 | 35 | 9.02 | 11.55 |
| 10 | 0 | 0 | 0 | 30 | 12.5 | 35 | 10.11 | 11.55 |
| 11 | 0 | 0 | 0 | 30 | 12.5 | 35 | 12.1 | 11.55 |
| 12 | 0 | 0 | 0 | 30 | 12.5 | 35 | 10.11 | 11.55 |
| 13 | 1 | 1 | 1 | 41.89 | 19.34 | 43.92 | 17.02 | 17.24 |
| 14 | 1 | -1 | -1 | 41.89 | 5.66 | 26.08 | 15.22 | 15.19 |
| 15 | - | 0 | 0 | 10 | 12.5 | 35 | 2.42 | 2.95 |
| 16 | 1 | 1 | -1 | 41.89 | 19.34 | 26.08 | 16.1 | 17.21 |
| 17 | 0 | 1.68 | 0 | 30 | 24 | 35 | 15.61 | 14.35 |
| 18 | 0 | 0 | 0 | 30 | 12.5 | 35 | 16.22 | 11.55 |
| 19 | -1 | 1 | 1 | 18.11 | 19.34 | 43.92 | 6.02 | 6.22 |
| 20 | 1 | -1 | 1 | 41.89 | 5.66 | 43.92 | 16.22 | 15.67 |
Table 4. Central composite design matrix for the competitive adsorption of cadmium.
| Parameter | Response |
|---|---|
| R-Squared | 0.904 |
| Mean | 11.318 |
| Standard Deviation | 1.931 |
| C.V % | 17.061 |
| Adeq. Precision | 13.293 |
Table 5. Statistical information for ANOVA.
| Variable | Value |
|---|---|
| Initial concentration | 41.89 mg/L |
| Contact time | 19.34 hr |
| Temperature | 35.10 oC |
| Maximum amount adsorbed | 17.97 mg/l |
Table 6. Optimal results for cadmium (II) ions.
| Source | Sum of squares | df | Mean square | F value | p-value |
|---|---|---|---|---|---|
| Model | 674.51 | 8 | 84.31 | 22.04 | < 0.0001 |
| X1 | 511.74 | 1 | 511.74 | 133.77 | < 0.0001 |
| X2 | 32.92 | 1 | 32.92 | 8.6 | 0.0136 |
| X3 | 0.24 | 1 | 0.24 | 0.064 | 0.8053 |
| X1X2 | 3.95 | 1 | 3.95 | 1.03 | 0.3315 |
| X1X3 | 5.38 | 1 | 5.38 | 1.41 | 0.2607 |
| X2X3 | 0.24 | 1 | 0.24 | 0.062 | 0.8076 |
| X12 | 7.13 | 1 | 7.13 | 1.86 | 0.1994 |
| X22 | 117.16 | 1 | 117.16 | 30.63 | 0.0002 |
| Residual | 42.08 | 11 | 3.83 | ||
| Lack of Fit | 29.89 | 6 | 4.98 | 2.04 | 0.2251 |
| Pure Error | 12.19 | 5 | 2.44 | ||
| Cor Total | 716.59 | 19 |
Table 7. ANOVA results for statistical model for the competitive sorption of copper by HSPAA.
| Factors | Response | |||||||
|---|---|---|---|---|---|---|---|---|
| Run No | Coded levels | Actual values | Amount adsorbed | |||||
| (ppm) | ||||||||
| X1 | X2 | X3 | X1 | X2 | X3 | Observed | Predicted | |
| 1 | -1 | -1 | -1 | 18.11 | 5.66 | 26.08 | 15.22 | 14.86 |
| 2 | -1 | -1 | 1 | 18.11 | 5.66 | 43.92 | 17 | 15.78 |
| 3 | -1 | 1 | -1 | 18.11 | 19.34 | 26.08 | 16.01 | 13.65 |
| 4 | 1.68 | 0 | 0 | 50 | 12.5 | 35 | 42.66 | 45.54 |
| 5 | 0 | 0 | 0 | 30 | 12.5 | 35 | 22 | 22.03 |
| 6 | 0 | 0 | -1.68 | 30 | 12.5 | 20 | 22.2 | 22.21 |
| 7 | 0 | -1.68 | 0 | 30 | 1 | 35 | 28.4 | 28.95 |
| 8 | 0 | 0 | 1.68 | 30 | 12.5 | 50 | 20.66 | 21.85 |
| 9 | 0 | 0 | 0 | 30 | 12.5 | 35 | 22 | 22.03 |
| 10 | 0 | 0 | 0 | 30 | 12.5 | 35 | 21 | 22.03 |
| 11 | 0 | 0 | 0 | 30 | 12.5 | 35 | 21.4 | 22.03 |
| 12 | 0 | 0 | 0 | 30 | 12.5 | 35 | 21.45 | 22.03 |
| 13 | 1 | 1 | 1 | 41.89 | 19.34 | 43.92 | 38 | 34.82 |
| 14 | 1 | -1 | -1 | 41.89 | 5.66 | 26.08 | 39.6 | 38.56 |
| 15 | - | 0 | 0 | 10 | 12.5 | 35 | 6.41 | 8.54 |
| 16 | 1 | 1 | -1 | 41.89 | 19.34 | 26.08 | 38.5 | 36.17 |
| 17 | 0 | 1.68 | 0 | 30 | 24 | 35 | 21.41 | 25.87 |
| 18 | 0 | 0 | 0 | 30 | 12.5 | 35 | 21.4 | 22.03 |
| 19 | -1 | 1 | 1 | 18.11 | 19.34 | 43.92 | 17.02 | 14.52 |
| 20 | 1 | -1 | 1 | 41.89 | 5.66 | 43.92 | 38.44 | 37.26 |
Table 8. Central composite design matrix for the competitive adsorption of copper.
| Parameter | Response |
|---|---|
| R-Squared | 0.963 |
| Mean | 24.539 |
| Standard Deviation | 2.488 |
| C.V % | 10.14 |
| Adeq. Precision | 22.171 |
Table 9. Statistical information for ANOVA of copper ions.
| Variable | Value |
|---|---|
| Initial concentration | 41.89 ppm |
| Contact time | 5.66 hr |
| Temperature | 26.11 ºC |
| Maximum amount removed | 38.56 ppm |
Table 10. Optimal results for copper (II) ions.
Statistical mode

ANOVA Results
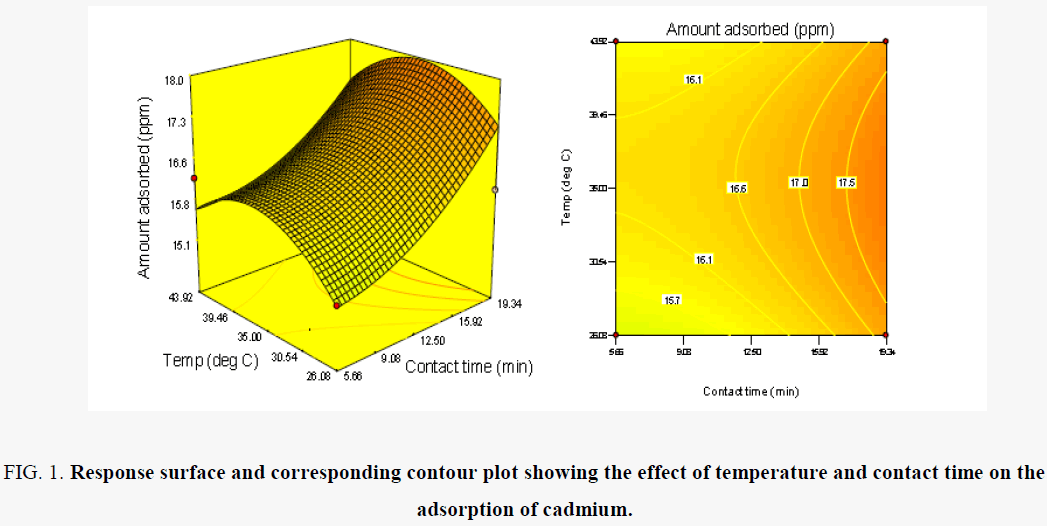
The effect of temperature and contact time on the uptake of cadmium ion is presented in Figure 1. The uptake of cadmium from solution was observed to be favoured by moderate levels of temperatures, 25°C. This is evident from the inverse relationship between the uptake of cadmium and the operating temperature of the process. The trend observed could be attributed to the weakening of the attractive force between the metal ions and the adsorbent on the one hand and the enhancement of thermal energies of the metal ions on the other hand thus making the attractive force between the metal ions and adsorbent insufficient to retain the adsorbed ions at the binding sites [15].
Figure 1:Response surface and corresponding contour plot showing the effect of temperature and contact time on the adsorption of cadmium.
At low levels of contact time, the uptake of cadmium ions was observed to be low. The same trend was observed at high levels of contact time. Similar trends have been reported by other researchers [16]. Increasing the contact time during sorption resulted in a corresponding increase in amount of cadmium ions removed from solution. However, a higher rate of metal uptake with respect to contact time was recorded at low values of initial concentration. The trend may also be as a result of structural aspects of the polymeric backbone which affects metal ions sorption. The prepared graft copolymer removes cadmium ions both by sorption on nitrogen of the amide groups and also by sorption in the bulk of grafted copolymer. Therefore, the structure of a polymeric graft copolymer affects the level of polymer interaction with water and the provision of active sites to sorb or coordinate metal ions [17,18]. For the entire range of temperature investigated, the cadmium ions removal generally increased with contact time. This suggests that the extent of sorption on nitrogen of the amide groups and also by sorption in the bulk of grafted copolymer is a function of time. This corroborates the results of Mouayad et al. [19], which indicated that the time needed to achieve maximum adsorption of copper ions on polyacrylic acid hydrogel beads was 24 h.
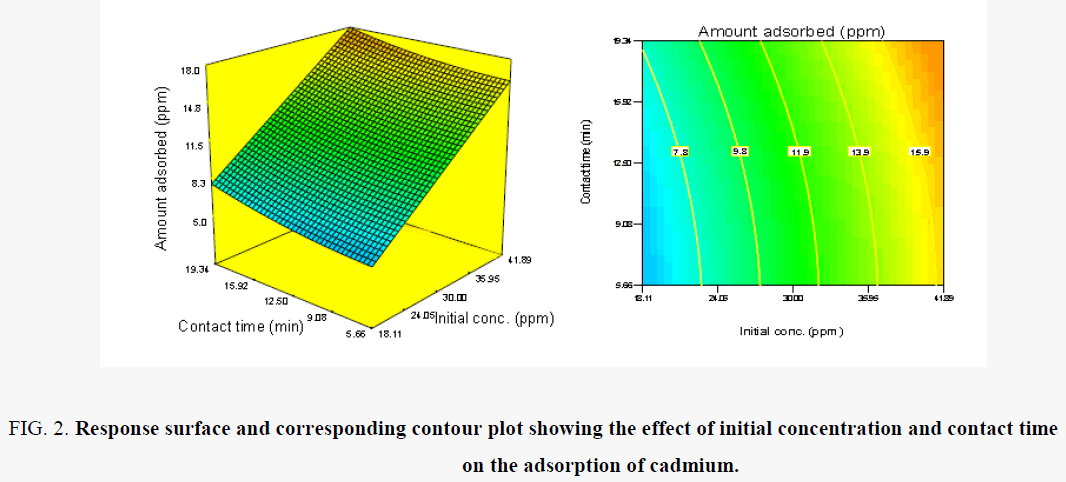
As is clearly shown in Figure 2, although removal of Cd (II) increases sharply when the contact time increases from 6.8 to 19.34 h, removal capacity decreased above this contact time of 19.341 h. Maximum removal capacity was observed at 19.341 h contact time. The contact time dependence of metal uptake is related to the available active sites for binding of metal ions [20,21].
Figure 2. Response surface and corresponding contour plot showing the effect of initial concentration and contact time on the adsorption of cadmium.
Also, it is observed in Figure 2, that the removal of Cd (II) ions increases with increase in initial concentration of the solution which reaches a maximum at 41 mg/l. Then it did not change by further increasing the initial concentration. This result can be explained because of the interaction of Cd (II) ions and the hydrolyzed starch graft poly (acrylic acid) (HSPAA). At lower Cd (II) concentration, the ratio of number of moles of metal ion to the available sorption sites is high and therefore the amount sorbed per unit HSPAA increases sharply [22]. With an increasing metal ion concentration, there is an increase in the amount of metal ion sorbed due to increased driving force of the metal ions toward the active sites on the HSPAA [23].
In this study, when the initial concentration reaches 41 mg/l the metal uptake reached equilibrium and all sites were saturated with metals. Any further increase shows that the available pores become insufficient to sorbed further metal ions and many ions are left in suspension. Similar observations are reported in the literature [24].
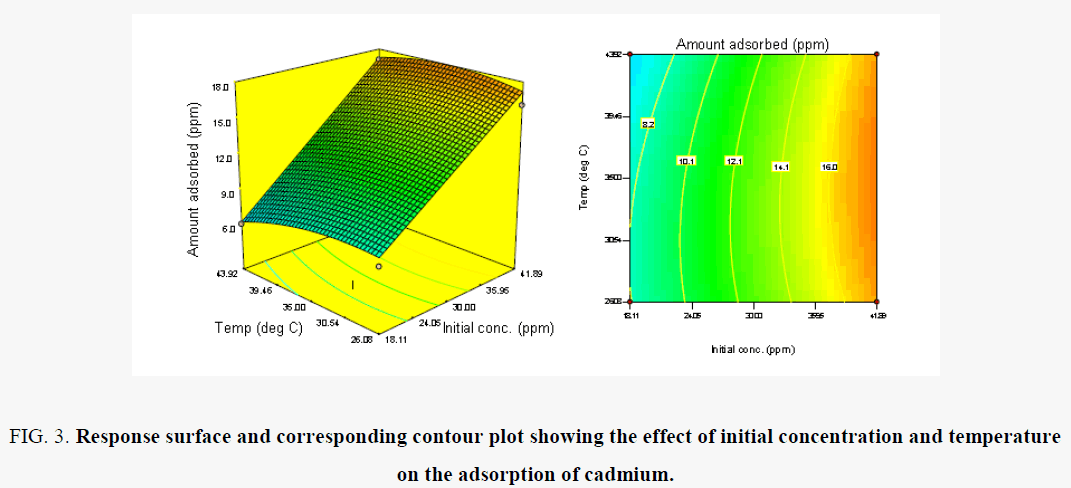
In Figure 3, the effect of temperature and Contact time on the removal of Cd (II) ions is shown. There is increase in amount removed as the temperature increases. This is expected due to the fact that the mobility of the ions became faster resulting in increased binding in the surface and the pores opened up as the temperature increase to 25.0°C. However, as the concentration increases there was maximum removal at 41 mg/l, beyond which the sorption will decrease. Initial concentration increases the level of interaction of the ions with the active sites thus creating a higher probability for binding of the ions [24,25].
Figure 3. Response surface and corresponding contour plot showing the effect of initial concentration and temperature on the adsorption of cadmium.
Optimization results and response surface plots
Statistical model

Optimization results and response surface plots
ANOVA Results
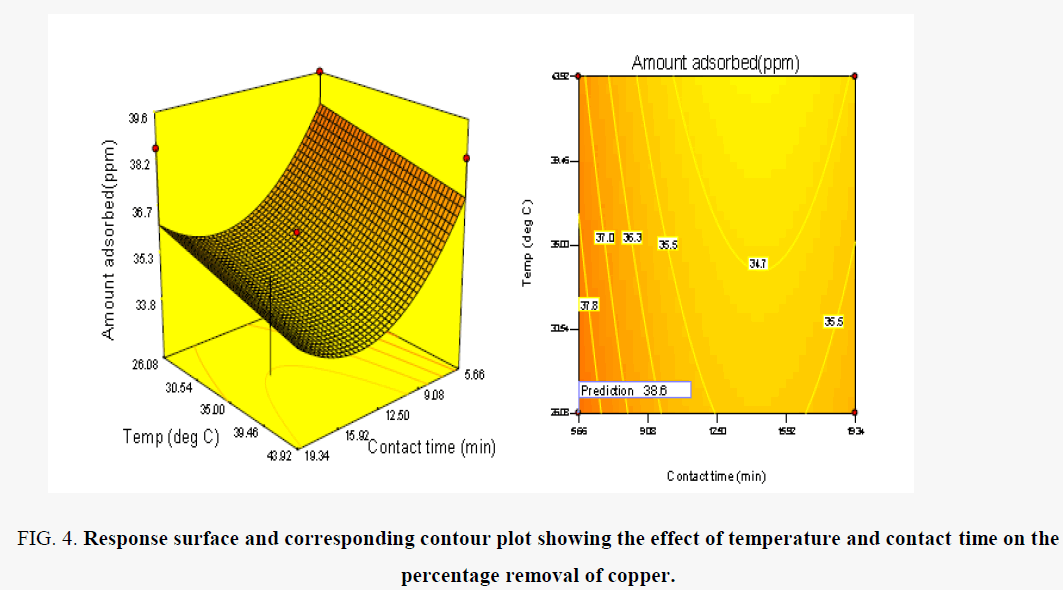
Figure 4 shows the combined effects of temperature and contact time on Cu (II) in competitive sorption by HSPAA. As seen in Figure 4, temperature indicated a positive effect on removal of Cu (II) onto HSPAA. Cu (II) ions removal capacity for HSPAA slowly increased with decreasing temperature and approximately reached to maximum value around 26.08°C. This result shows that sorption is exothermic. Some researchers, Borah and senapati [26], Kula et al. [27], reported that Cu (II) sorption on different sorbents was endothermic in nature. The increase in sorption with the decrease of temperature may be due to a tendency for the Cu (II) ions to become more active in interacting with the available sites [27].
Figure 4. Response surface and corresponding contour plot showing the effect of temperature and contact time on the percentage removal of copper.
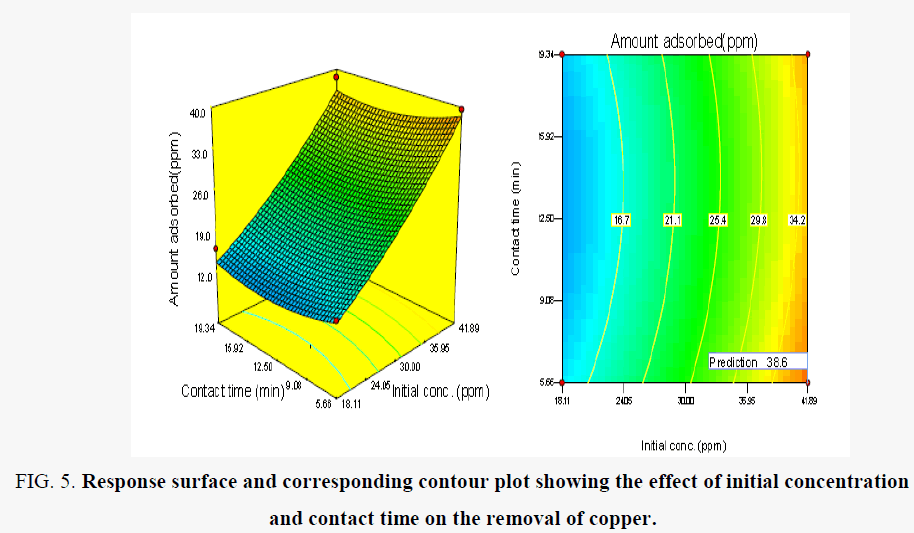
Figure 5 shows the effect of contact time and initial concentration on the removal of Cu (II) ions under the predefined conditions. The amount remove increased with the initial concentration of the Cu (II) ions in solution and contact time have little significant effect on the competitive sorption of Cu (II). The maximum removal was observed at 5.65 h contact time and 41.89 mg/l initial concentration. The increase in amount removed in relation to initial concentration is probably due to a high driving force for mass transfer [24].
Figure 5. Response surface and corresponding contour plot showing the effect of initial concentration and contact time on the removal of copper.
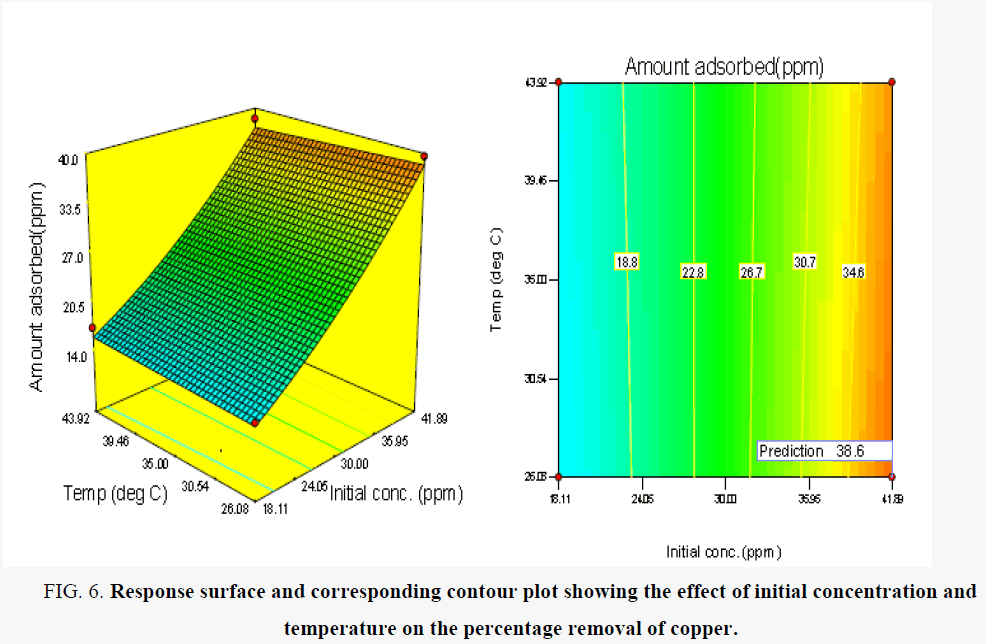
Figure 6 shows the effect of initial concentration and temperature on the amount of copper ions removed from solution competitively. It was observed that there was a rapid progressive and significant increase in the amount of Cu (II) ions removed with initial concentration. This trend was observed for the range of temperature investigated. The maximum amount of Cu (II) removed occurred at the initial concentration of 41.89 mg/l [28] reported a similar trend. However, since the number of active sites on the adsorbent surface is constant, an increase in the initial concentration of the metal results in a corresponding increase in the relative ratio of the concentration of metal to available active sites and further increase in concentration results in the saturation of the active sites on the adsorbent surface [16,29]. Similar trends have been reported by other researchers [16].
Figure 6. Response surface and corresponding contour plot showing the effect of initial concentration and temperature on the percentage removal of copper.
The sorption conditions were optimized based on the statistical model. Table 10 shows the optimum adsorption conditions as obtained from RSM. The maximum uptake of Cu (II) obtained at the optimum adsorption conditions was 38.56 mg/l. The validity of the statistical model was assessed by performing three confirmation experimental runs at the identified optimum sorption conditions indicated in Table 10. The result showed that the maximum experimental metal uptake was not significantly different from that predicted by the statistical model thus showing validity of the statistical model.
Statistical mode

ANOVA Results
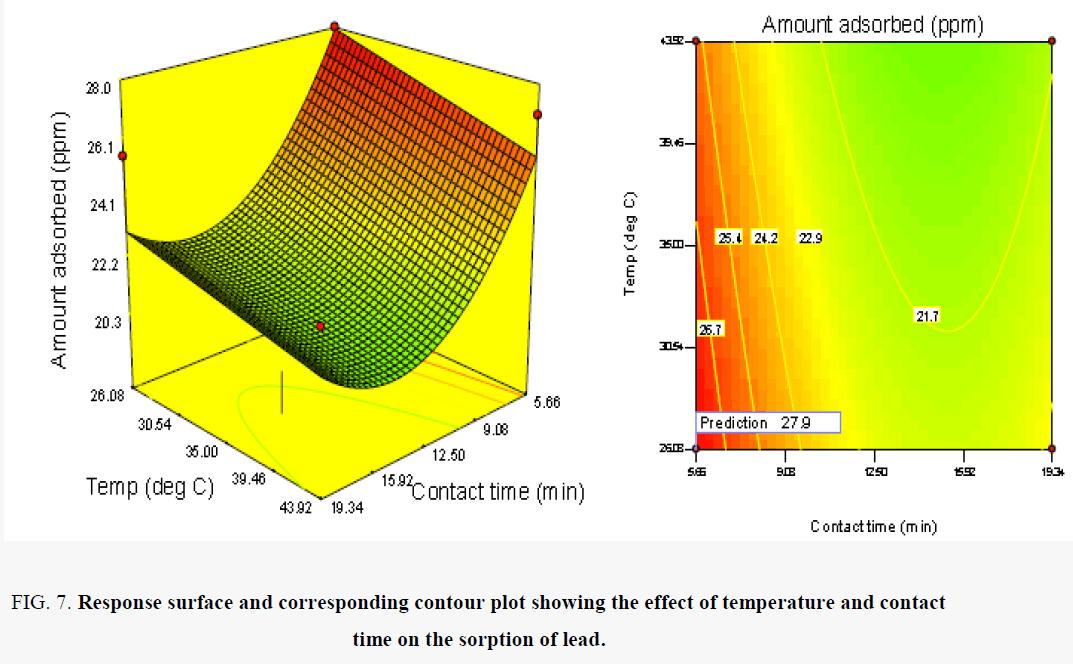
The effect of temperature and contact time on the uptake of copper ion is presented in Figure 7. The uptake of lead ions from solution was observed to be favoured by low levels of temperatures. This is evident from the inverse relationship between the uptake of lead and the operating temperature of the process. The trend observed could be attributed to the weakening of the attractive force between the metal ions and the adsorbent on the one hand and the enhancement of thermal energies of the metal ions on the other hand thus making the attractive force between the metal ions and adsorbent insufficient to retain the adsorbed ions at the binding sites [15]. With respect to contact time, low contact time of 8.66 h favours increase in the competitive sorption of lead (Tables 12 and 13).
| Source | Sum of squares | df | Mean square | F value | p-value |
|---|---|---|---|---|---|
| Model | 1757.95 | 8 | 219.74 | 35.49 | < 0.0001 |
| X1 | 1653.13 | 1 | 1653.13 | 267.02 | < 0.0001 |
| X2 | 11.42 | 1 | 11.42 | 1.84 | 0.2017 |
| X3 | 0.16 | 1 | 0.16 | 0.025 | 0.8767 |
| X1X2 | 0.69 | 1 | 0.69 | 0.11 | 0.7447 |
| X1X3 | 2.48 | 1 | 2.48 | 0.4 | 0.5401 |
| X2X3 | 1.51E-03 | 1 | 1.51E-03 | 2.44E-04 | 0.9878 |
| X22 | 45.6 | 1 | 45.6 | 7.37 | 0.0201 |
| Residual | 52.59 | 1 | 52.59 | 8.49 | 0.0141 |
| Lack of Fit | 68.1 | 11 | 6.19 | ||
| Pure Error | 67.34 | 6 | 11.22 | 73.63 | 0.0001 |
| Cor Total | 0.76 | 5 | 0.15 |
Table 11. ANOVA results for statistical model for the competitive sorption of lead by HSPAA.
| Factors | Actual values | Response | ||||||
|---|---|---|---|---|---|---|---|---|
| Run No |
Coded levels | Amount adsorbed | ||||||
| (ppm) | ||||||||
| X1 | X2 | X3 | X1 | X2 | X3 | Observed | Predicted | |
| 1 | -1 | -1 | -1 | 18.11 | 5.66 | 26.08 | 12 | 12.66 |
| 2 | -1 | -1 | 1 | 18.11 | 5.66 | 43.92 | 12.05 | 13.69 |
| 3 | -1 | 1 | -1 | 18.11 | 19.34 | 26.08 | 10.12 | 10.62 |
| 4 | 1.68 | 0 | 0 | 50 | 12.5 | 35 | 24.42 | 27.19 |
| 5 | 0 | 0 | 0 | 30 | 12.5 | 35 | 12 | 14.91 |
| 6 | 0 | 0 | -1.68 | 30 | 12.5 | 20 | 15 | 15.14 |
| 7 | 0 | - | 0 | 30 | 1 | 35 | 26.5 | 25.55 |
| 8 | 0 | 0 | 1.68 | 30 | 12.5 | 50 | 14.2 | 14.69 |
| 9 | 0 | 0 | 0 | 30 | 12.5 | 35 | 14.6 | 14.91 |
| 10 | 0 | 0 | 0 | 30 | 12.5 | 35 | 15.05 | 14.91 |
| 11 | 0 | 0 | 0 | 30 | 12.5 | 35 | 15 | 14.91 |
| 12 | 0 | 0 | 0 | 30 | 12.5 | 35 | 16.04 | 14.91 |
| 13 | 1 | 1 | 1 | 41.89 | 19.34 | 43.92 | 23.02 | 21.53 |
| 14 | 1 | -1 | -1 | 41.89 | 5.66 | 26.08 | 28 | 27.95 |
| 15 | - | 0 | 0 | 10 | 12.5 | 35 | 8.2 | 6.6 |
| 16 | 1 | 1 | -1 | 41.89 | 19.34 | 26.08 | 25.56 | 23.1 |
| 17 | 0 | 1.68 | 0 | 30 | 24 | 35 | 18.21 | 20.33 |
| 18 | 0 | 0 | 0 | 30 | 12.5 | 35 | 16.44 | 14.91 |
| 19 | -1 | 1 | 1 | 18.11 | 19.34 | 43.92 | 13.11 | 12.34 |
| 20 | 1 | -1 | 1 | 41.89 | 5.66 | 43.92 | 27.02 | 25.7 |
Table 12. Central composite design matrix for the competitive adsorption of lead.
| Parameter | Response |
|---|---|
| R-Squared | 0.941 |
| Mean | 0.899 |
| Standard Deviation | 1.956 |
| C.V % | 11.288 |
| Adeq. Precision | 16.276 |
Table 13. Statistical information for ANOVA.
Figure 7. Response surface and corresponding contour plot showing the effect of temperature and contact time on the sorption of lead.
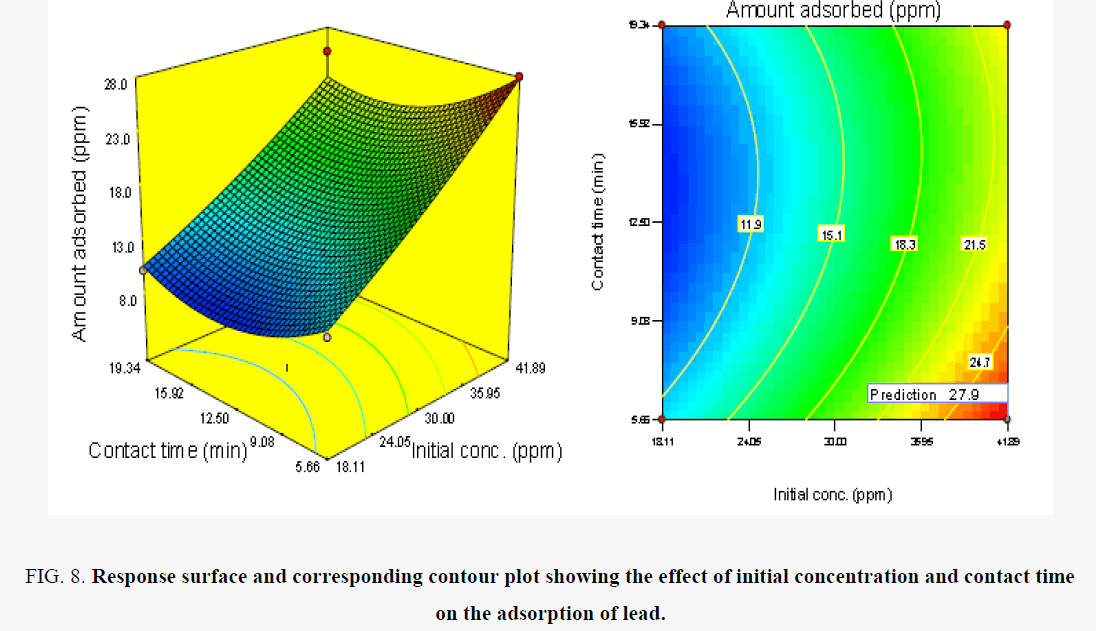
As is clearly shown in Figure 8, although removal of Pb (II) increases sharply when the contact time decreases from 18 to 5.66 h, removal capacity decreased above this contact time of 19.341 hr. Maximum removal capacity was observed at 5.66 h contact time. The contact time dependence of metal uptake is related to the available active sites for binding of metal ions [20,21]. Also, it is observed in Figure 8, that the removal of Pb (II) ions increases with increase in initial concentration of the solution which reaches a maximum at 41.89 mg/l. Then it did not change by further increasing the initial concentration. This result can be explained because of the interaction of Pb (II) ions and the HSPAA. At lower Pb (II) concentration, the ratio of number of moles of metal ion to the available sorption sites is high and therefore the amount sorbed per unit HSPAA increases sharply [22]. With an increasing metal ion concentration, there is an increase in the amount of metal ion sorbed due to increased driving force of the metal ions toward the active sites on the HSPAA [23].
Figure 8. Response surface and corresponding contour plot showing the effect of initial concentration and contact time on the adsorption of lead.
In this study, when the initial concentration reaches 41.89 mg/l the metal uptake reached equilibrium and all sites were saturated with metals. Any further increase shows that the available pores become insufficient to sorbed further metal ions and many ions are left in suspension. Similar observations are reported in the literature [23].
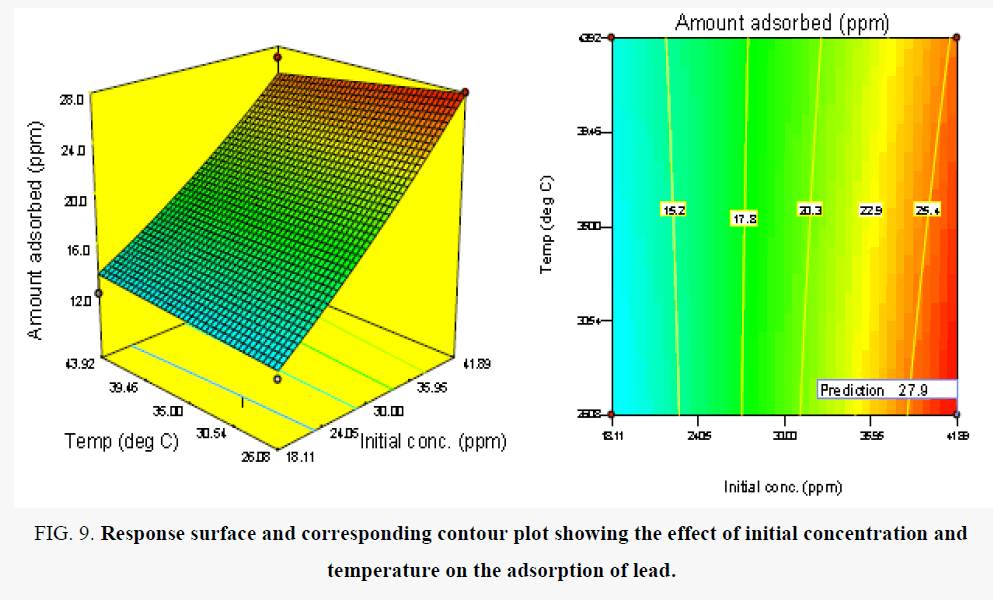
Figure 9 shows the effect of initial concentration and temperature on the amount of lead removed from solution. It was observed that there was a rapid progressive and significant increase in the amount of metal removed with initial concentration. This trend was observed for the range of temperature investigated. The maximum amount of Pb removed occurred at the initial concentration of 41.89 mg/l [28], reported a similar trend. However, since the number of active sites on the adsorbent surface is constant, an increase in the initial concentration of the metal results in a corresponding increase in the relative ratio of the concentration of metal to available active sites and further increase in concentration results in the saturation of the active sites on the adsorbent surface [16,29]. Similar trends have been reported by other researchers [16]. Table 14 shows the optimum conditions for the removal of lead ions in competitive sorption with cadmium and copper ions in the same solution.
| Variable | Value |
|---|---|
| Initial concentration | 41.89 ppm |
| Contact time | 5.66 hr |
| Temperature | 26.09 ºC |
| Maximum amount adsorbed | 27.90 ppm |
Table 14. Optimal results for lead (II) ions.
Figure 9. Response surface and corresponding contour plot showing the effect of initial concentration and temperature on the adsorption of lead.
Conclusion
RSM was successfully used to optimize the sorption conditions for Cu (II), Pb (II) and Cd (II) ions removal unto the starch graft copolymer, HSPAA in competitive sorption. The sorption affinity for the metals follow the order Pb > Cu > Cd, this order suggests that electronegativity may be the most important factor as metal sorption increased with increasing electronegativity.
Considering the results, it can be concluded that RSM is an efficient statistical method for optimization of experimental conditions and HSPAA is a convenient sorbent for the removal of Cu (II), Pb (II) and Cd (II) ions from aqueous environments due to its significant sorption capacity, low cost and from renewable materials.
Acknowledgements
We acknowledged the support of the Tertiary Education Trust Fund (TETFUND) of the Federal Republic of Nigeria and all those who supported the work reported here during the study
References
- Zulkali M, Ahmad L, Norulakmal H, et al. As heavy metal adsorbent: optimization with lead as model solution. Bioresource technology. 2006; 31;97(1):21-5.
- Salamatinia B, Zinatizadeh A, Kamaruddin H, et al. Application of response surface methodology for the optimization of Cu and Zn removals by sorption on pre-treated oil palm frond (OPF). Iran J Chem Eng. 2006;3(2):73-84.
- Jang A, Seo Y, Bishop PL. The removal of heavy metals in urban runoff by sorption on mulch. Environmental pollution. 2005; 31;133(1):117-27.
- Basci N, Kocadagistan E, Kocadagistan B. Biosorption of copper (II) from aqueous solutions by wheat shell. Desalination. 2004;164(2):135-40.
- Gratuito K, Panyathanmaporn T, Chumnanklang A, et al. Production of activated carbon from coconut shell: optimization using response surface methodology. Bioresource Technology. 2008;99(11):4887-95.
- Box E, Draper R. Empirical model-building and response surfaces. 1987 Wiley, New York.
- Montgomery C. Design and Analysis of Experiments, 6th edition. John Wiley & Sons, Inc. New York 2005; 67-99.
- Karacan C. Evaluation of the relative importance of coalbed reservoir parameters for prediction of methane inflow rates during mining of longwall development entries. Computers & Geosciences. 2008;34(9):1093-114.
- Okieimen E, Nkumah E, Egharevba F. Studies on the grafting of acrylic acid on starch. European polymer journal. 1989;25(4):423-6.
- Ekebafe LO, Ogbeifun DE, Okieimen FE. Removal of heavy metals from aqueous media using native cassava starch hydrogel. African Journal of Environmental Science and Technology. 2012;6(7):275-82.
- Ekebafe LO, Ogbeifun DE, Okieimen FE. Effect of native cassava starch-poly (sodium acrylate-co-acrylamide) hydrogel on the growth performance of maize (Zea may) seedlings. American Journal of Polymer Science. 2011;1(1):6-11.
- Ekebafe LO, Ogbeifun DE, Okieimen FE. Removal of heavy metals from aqueous media using native cassava starch hydrogel. African Journal of Environmental Science and Technology. 2012;6(7):275-82.
- Ko DC, Cheung CW, Choy KK, et al. Sorption equilibria of metal ions on bone char. Chemosphere. 2004;54(3):273-81.
- Jadhav DN, Vanjara AK. Removal of phenol from wastewater using sawdust, polymerized sawdust and sawdust carbon. Indian Journal of Chemical Technology. 2004; 11:45.
- Aisien FA, Amenaghawon NA, Adeboyejo AR, et al. Application of Recycled Rubber from Scrap Tire in the Removal of Phenol from Aqueous Solution. Pacific Journal of Science and Technology. 2013;14(2):330-41
- Zheng Y, Hua S, Wang A. Adsorption behavior of Cu2+ from aqueous solutions onto starch-g-poly (acrylic acid)/sodium humate hydrogels. Desalination 263: 117.
- Chauhan GS, Singh B, Sharma RK, et al. Use of biopolymers and acrylamide-based hydrogels for sorption of Cu2+, Fe2+ and Cr6+ ions from their aqueous solutions. Desalination. 2006;197(1-3):75-81.
- Al-Abachi Q, Al-Awady S, Al-Anbakey M. Removal of Iron (Iii) Ion from Aqueous Solution using Polyacrylic Acid Hydorgel Beads as Adsorbent. Iraqi J. Sci. 2013;54:775-81.
- Al-Abachi MQ, Al-Awady NS, Al-Anbakey AM, Removal of Iron (Iii) Ion from Aqueous Solution using Polyacrylic Acid Hydorgel Beads as Adsorbent. Iraqi J. Sci. 2013;54:775-81.
- Gündo?an R, Acemio?lu B, Alma MH. Copper (II) adsorption from aqueous solution by herbaceous peat. Journal of Colloid and Interface Science. 2004;269(2):303-9.
- Ho YS, Mckay G. The sorption of lead (II) ions on peat. Water Research, 1999;33:585.
- Gupta SS, Bhattacharyya KG. Removal of Cd (II) from aqueous solution by kaolinite, montmorillonite and their poly (oxo zirconium) and tetrabutylammonium derivatives. Journal of hazardous materials. 2006;128(2):247-57.
- Jiang MQ, Wang QP, Jin XY, et al. Removal of Pb (II) from aqueous solution using modified and unmodified kaolinite clay. Journal of Hazardous Materials. 2009;170(1):332-9.
- Ayd?n H, Bulut Y, Yerlikaya Ç. Removal of copper (II) from aqueous solution by adsorption onto low-cost adsorbents. Journal of Environmental Management. 2008;87(1):37-45.
- Vijaya Y, Popuri SR, Boddu VM, et al. Modified chitosan and calcium alginate biopolymer sorbents for removal of nickel (II) through adsorption. Carbohydrate polymers. 2008;72(2):261-71.
- Borah D, Senapati K. Adsorption of Cd (II) from aqueous solution onto pyrite. Fuel. 2006;85(12):1929-34.
- Kula I, Ugurlu M, Karaoglu H, et al. Adsorption of Cd (II) ions from aqueous solutions using activated carbon prepared from olive stone by ZnCl 2 activation. Bioresource technology. 2008 ;99(3):492-501.
- Romero I, Ruiz E, Castro E, et al. Acid hydrolysis of olive tree biomass. Chemical Engineering Research and Design. 2010;88(5):633-40.
- Eren Z, Acar FN. Adsorption of Reactive Black 5 from an aqueous solution: equilibrium and kinetic studies. Desalination. 2006;194(1-3):1-0.
