Original Article
, Volume: 18( 3) DOI: 10.37532/0974-7435.22.18.001Physicochemical Characteristics of Soil Supporting to the Growth of Wheat, Jowar and Maize Crop Plants from Baramati Tehsil Dist. Pune, Maharashtra, India
- *Correspondence:
- Shete RS
Department of Biotechnology
Shri Sant Damaji Mahavidyalaya, Solapur
Maharashtra, India
Tel: 9834637453
E-mail: sheteruturaj95@gmail.com
Received: August 07, 2022, Manuscript No. TSBT-22-71387; Editor assigned: August 10, 2022, PreQC No. TSBT-22-71387; Reviewed: August 24, 2022, QC No. TSBT-22-71387; Revised: November 21, 2022, Manuscript No. TSBT-22-71387; Published: November 30, 2022, DOI:10.37532/0974-7435.22.18.001
Citation: Torane SN, Shete RS, Patil VS, et al. Physicochemical Characteristics of Soil Supporting to the Growth of Wheat, Jowar and Maize Crop Plants from Baramati Tehsil Dist. Pune, Maharashtra, India. Biotech Ind J. 2022;18(3):001
Abstract
The soil test based nutrient management has emerged as a key issue in efforts to increase agriculture productivity. In the present investigation study focus on the physicochemical analysis of a soil from crop fields in Baramati Tehsil region. Total 30 soil samples collected from 15 sites during December 2020 to February 2021. Collected soil samples from crop fields analyzed for parameters like soil pH, Electrical Conductivity (EC), Organic Carbon (OC), available Nitrogen (N), Phosphorus (P), Potassium (K), Sodium (Na), Calcium Carbonate (CaCO3 ) and micronutrients (Fe, Mn, Cu and Zn). All site soil samples in crop fields pH shows moderately alkaline to strong alkaline. Maximum site crop field’s soil samples show average electrical conductivity some sites soil samples show more than average electrical conductivity. Organic carbon fluctuates ranges from ≥ 1.00 ≤ 0.81-1.00 ≤ 0.51-0.80 ≤ 0.41-0.50 ≤ 0.21 to 0.40. Nitrogen content shows ≥ 140-280 ≥ 140, Phosphorus content shows ≤ 8-14, ≤ 7.00, kg/hector Potassium content ≥ 300 kg/hector shows in all sites and abundant in amount. All sites crop field’s soils shows luxuriant amount of sodium content. CaCO3 content shows medium to abundance in quantity in all sites. In case of micronutrients analysis shows as low ranges of Fe, Mn, Zn, and Cu in ppm all sites crop field’s soil samples. In modern agriculture excess use of chemical fertilizers affects the pH, EC, organic carbon, N, P, K, Na and CaCO3 . More than average 1.00 electrical conductivity which are harmful for germination. Due to overdose of chemical fertilizers its affects soil fertility resulted to decreases crop yields production.
Keywords
Crop fields; Parameters; Physicochemical analysis; Chemical fertilizers; Agriculture
Introduction
Soil is a media for the plants. The soil physical, chemical and biological properties affect the plant growth. Soil management practices also greatly affect the soil organic matter and soil fertility. Soil is a naturally occurring, unconsolidated covering on the earth surface. Soil is a mixture of mineral and organic constituents that are solid, gaseous and aqueous states. The soil a complex organization being made up of some six constituents is namely as inorganic matter, soil moisture, organic matter, soil organism, soil air and soil solution [1]. Roughly, the soil contains 50-60% mineral matter, 25-35% water, 15-25% air and small percentage of organic matter. Soil is an important system of the terrestrial ecosystem. Quality of the soil depends on its physical properties (pH, moisture content, texture, colour and organic substance content etc.) and the chemical properties are (nitrate, nitrogen, organic matter content, nitrite, cation exchange capacity and phosphate phosphorous etc.). Soils are the main terrestrial reservoir of carbon and nutrients, which determine soil fertility, plant growth and ecosystem sustainability and thus soils are crucial for human wellbeing [2].
The soil test based nutrient management has emerged as a key issue in efforts to increase agriculture productivity. In recent years agriculture development has been changed from conventional and traditional farming method too more intensive practices using chemical fertilizers and pesticides with irrigation facilities. Continuous use of chemical fertilizers slowly changed soil properties; ultimately the production in long run is reduced [3]. It has resulted in leaching of chemical into the surface and ground water around study area is although most of the population depends upon agriculture produce such as wheat and Jowar, maize since long back. However, generation after generation the soil supporting to wheat and Jowar, maize is utilized for production with no any scientific analysis. So, this research will add scientific knowledge about soil supporting to wheat and jowar and maize.
Materials and Methods
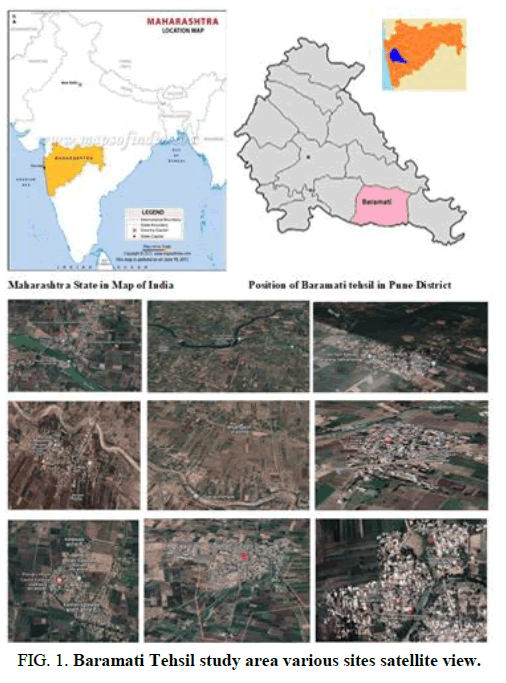
Study area: Baramati tehsil, belong to western part of Maharashtra. It is belonged to Pune division. Baramati tehsil is the fourth largest city in Pune district. Baramati tehsil lies between 18°04′ to 18°32′ north latitude and 74°26′ to 74°69′ east longitude. It is located at altitude of 550 meter above the sea level [4].
Collections of soil samples: Soil samples are collected December 2020 to February 2021. Each site 2 crop plants soil samples were collected representatively in the depth of soil from different places of the tehsil. During survey Nira and Karha river basin area, water resources like lakes reservoirs, Nira left canal, dry area with less water resources selected. While collecting soil samples the upper layer of vegetation, surface litter, stones stubble if any were cleared away and then layer of soil immediately below (0-20 cm) was collected in sterile polythene bag, noted location site, date of collection, agriculture crop plants (Figure 1). All soil samples bring in laboratory removed debris, stones, grass and making soil samples ready for soil analysis like various parameter [5].
Physicochemical properties of soil
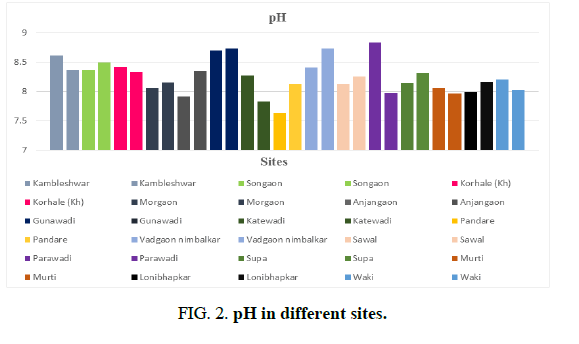
pH: The most significant property of soil is its pH level, its effects on all other parameters of soil. Therefore, pH is considered while analyzing any kind of soil [6]. If the pH is less than 6 then it is said to be an acidic soil, the pH ranges from 6-8.5 it’s a normal soil and greater than 8.5 then it is said to be alkaline soil.
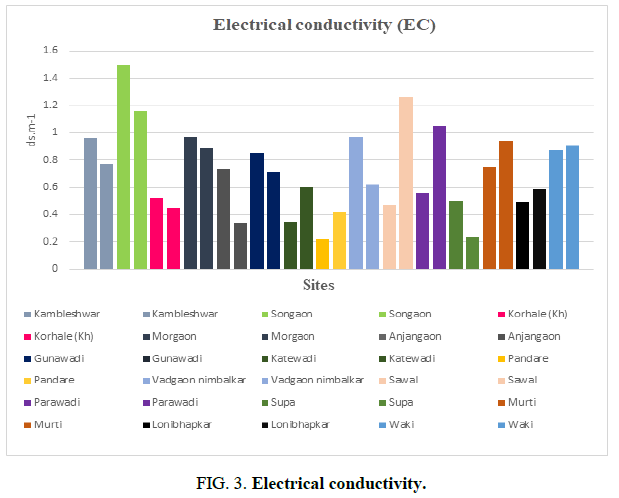
Electrical Conductivity (EC): Electrical conductivity is also a very important property of the soil; it is used to check the quality of the soil. It is a measure of ions present in solution [7].
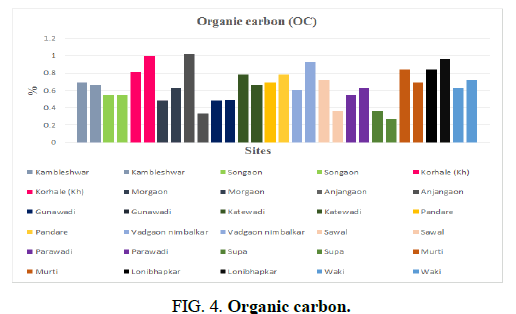
Organic Carbon (OC): Organic matter estimation in the soil can be done by different methods. Loss of weight on ignition can be used as a direct measure of the organic matter contained in the soil. It can also be expressed as the content of organic carbon in the soil. Organic matter/organic carbon can also be estimated by Walkely and Black, 1934.
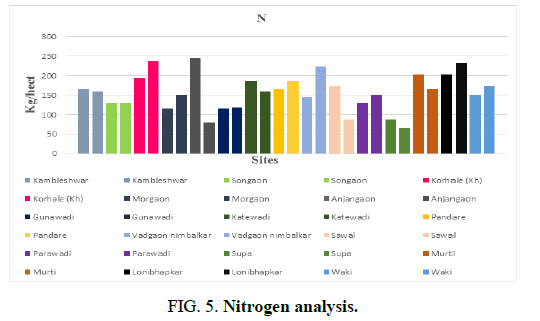
Nitrogen (N): Total N includes all forms of inorganic N, like NH4-N, NO3-N and also NH2 (Urea) N and the organic N compounds like proteins, amino acids and other derivatives. Depending upon the form of N present in a particular sample, specific method is to be adopted for getting the total nitrogen value. About 80% of the atmosphere is nitrogen gas. Nitrogen gas diffuses into water where it can be “fixed” (converted) by blue green algae to ammonia for algal use [8].
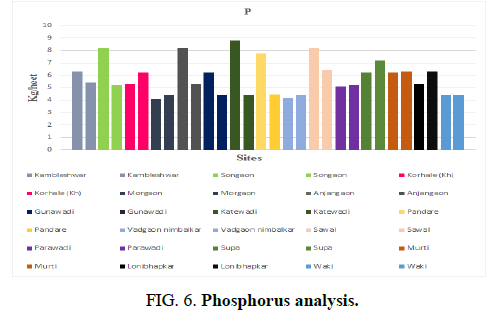
Phosphorus (P): It is one of the most important micronutrients essential for plant growth. Phosphorus most often limits nutrients remains present in plant nuclei and act as energy storage. In these methods, specific colour compounds are formed with the addition of appropriate reagents in the solution, the intensity of which is proportionate to the concentration of the element being estimated [9]. The colour intensity is measured spectrophotometrically.
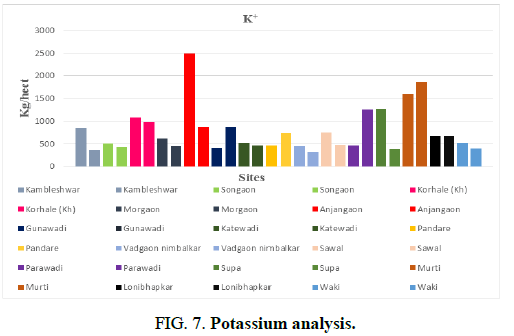
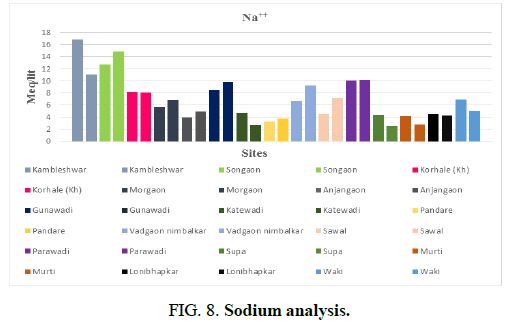
Sodium and Potassium: Flame photometric method potassium present in the soil is extracted with neutral ammonium acetate of 1 molarity. This is considered as plant available K in the soils. It is estimated with the help of flame photometer. This is a well-accepted method (Table 1).
| Nira river sites soil analysis | |||||||||
| Sites | Crop plants |
pH | E.C. ds.m-1 |
O. C % |
N Kg/ha |
P Kg/ha |
K+ Kg/ha |
Na++ Meq/lit |
CaCo3 % |
| Kambleshwar | Wheat | 8.61 | 0.96 | 0.69 | 166.00 | 6.30 | 848.00 | 16.86 | 16.32 |
| Jowar | 8.36 | 0.77 | 0.66 | 159.00 | 5.40 | 365.00 | 11.04 | 6.12 | |
| Songaon | Wheat | 8.36 | 1.50 | 0.54 | 130.00 | 8.20 | 499.00 | 12.71 | 13.77 |
| Jowar | 8.49 | 1.16 | 0.54 | 130.00 | 5.19 | 426.00 | 14.90 | 12.24 | |
| Korhale (KH) | Wheat | 8.41 | 0.52 | 0.81 | 195.00 | 5.30 | 1070.00 | 8.17 | 15.81 |
| Maize | 8.33 | 0.45 | 0.99 | 238.00 | 6.19 | 976.00 | 8.02 | 19.89 | |
| Karha river sites soil analysis | |||||||||
| Sites | Crop plants |
pH | E.C. ds.m-1 |
O. C % | N Kg/ha |
P Kg/ha |
K+ Kg/ha |
Na++ Meq/lit |
CaCo3 % |
| Morgaon | Wheat | 8.05 | 0.97 | 0.48 | 115.00 | 4.10 | 613.00 | 5.68 | 15.30 |
| Jowar | 8.15 | 0.89 | 0.63 | 151.00 | 4.40 | 452.00 | 6.76 | 13.77 | |
| Anjangaon | Wheat | 7.91 | 0.74 | 1.02 | 245.00 | 8.20 | 2492.00 | 3.94 | 15.81 |
| Jowar | 8.34 | 0.34 | 0.33 | 79.53 | 5.30 | 874.00 | 4.94 | 17.34 | |
| Gunawadi | Wheat | 8.69 | 0.85 | 0.48 | 115.00 | 6.20 | 409.00 | 8.46 | 31.95 |
| Jowar | 8.73 | 0.71 | 0.49 | 118.00 | 4.40 | 875.00 | 9.81 | 29.25 | |
| Nira left canal sites soil analysis | |||||||||
| Sites | Crop plants |
pH | E.C. ds.m-1 |
O. C % | N Kg/ha |
P Kg/ha |
K+ Kg/ha |
Na++ Meq/lit |
CaCo3 % |
| Katewadi | Wheat | 8.27 | 0.35 | 0.78 | 187.00 | 8.80 | 513.00 | 4.74 | 19.89 |
| Jowar | 7.82 | 0.60 | 0.66 | 159.00 | 4.40 | 455.00 | 2.60 | 12.24 | |
| Pandare | Wheat | 7.63 | 0.22 | 0.69 | 166.00 | 7.77 | 460.00 | 3.26 | 5.10 |
| Jowar | 8.12 | 0.42 | 0.78 | 187.00 | 4.44 | 728.00 | 3.76 | 10.20 | |
| Vadgaon Nimbalkar | Wheat | 8.4 | 0.97 | 0.6 | 144.00 | 4.20 | 449.00 | 6.69 | 12.75 |
| Maize | 8.73 | 0.62 | 0.93 | 224 | 4.4 | 311 | 9.25 | 12.75 | |
| Less water reservoir sites soil analysis | |||||||||
| Sites | Crop plants |
pH | E.C. ds.m-1 |
O. C % | N Kg/ha |
P Kg/ha |
K+ Kg/ha |
Na++ Meq/lit |
CaCo3 % |
| Sawal | Wheat | 8.12 | 0.47 | 0.72 | 173.00 | 8.19 | 750.00 | 4.54 | 14.79 |
| Jowar | 8.25 | 1.26 | 0.36 | 86.76 | 6.41 | 470.00 | 7.19 | 16.83 | |
| Parawadi | Wheat | 8.83 | 0.56 | 0.54 | 130.00 | 5.11 | 464.00 | 9.99 | 19.38 |
| Jowar | 7.97 | 1.05 | 0.63 | 151.00 | 5.19 | 1253.00 | 10.17 | 13.77 | |
| Supa | Wheat | 8.14 | 0.50 | 0.36 | 86.76 | 6.20 | 1260.00 | 4.35 | 9.18 |
| Jowar | 8.31 | 0.24 | 0.27 | 65.07 | 7.19 | 381.00 | 2.51 | 8.67 | |
| Murti | Wheat | 8.05 | 0.75 | 0.84 | 202.00 | 6.19 | 1587.00 | 4.16 | 6.12 |
| Jowar | 7.96 | 0.94 | 0.69 | 166.00 | 6.30 | 1864.00 | 2.79 | 3.57 | |
| Lonibhapkar | Wheat | 7.99 | 0.49 | 0.84 | 202.00 | 5.30 | 660.00 | 4.52 | 4.08 |
| Jowar | 8.16 | 0.59 | 0.96 | 231.00 | 6.30 | 669.00 | 4.23 | 9.69 | |
| Waki | Wheat | 8.20 | 0.87 | 0.63 | 151.00 | 4.40 | 517.00 | 6.86 | 22.44 |
| Jowar | 8.02 | 0.91 | 0.72 | 173.00 | 4.40 | 398.00 | 5.03 | 19.38 | |
Table 1: Physicochemical analysis of soil samples crop plants in study area.
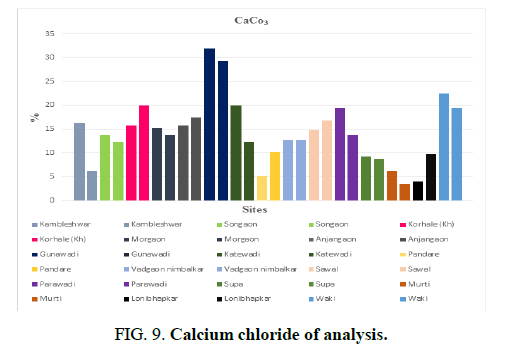
Micronutrients (Fe, Zn, Cu and Mn): The mean values of the micronutrients determined in the soils followed a decreasing order as Fe>Mn>Zn>Cu. Table 2 micronutrients estimated by using atomic absorption spectroscopy method (Figures 2-9).
| Nira river sites soil analysis | |||||
|---|---|---|---|---|---|
| Sites | Crop plants | Micro elements | |||
| Fe (PPM) |
Mn (PPM) |
Zn (PPM) |
Cu (PPM) | ||
| Kambleshwar | Wheat | 0.45 | 0.09 | 0.01 | 0.09 |
| Jowar | 0.58 | 0.21 | 0.03 | 0.07 | |
| Songaon | Wheat | 0.94 | 0.17 | 0.03 | 0.16 |
| Jowar | 0.56 | 0.13 | 0.02 | 0.11 | |
| Korhale (KH) | Wheat | 0.86 | 0.22 | 0.06 | 0.18 |
| Maize | 0.29 | 0.21 | 0.02 | 0.16 | |
| karha river sites soil analysis | |||||
| Sites | Crop plants | Microelements | |||
| Fe (PPM) | Mn (PPM) | Zn (PPM) | Cu (PPM) | ||
| Morgaon | Wheat | 0.41 | 0.12 | 0.01 | 0.06 |
| Jowar | 0.28 | 0.14 | 0.02 | 0.06 | |
| Anjangaon | Wheat | 0.13 | 0.08 | 0.09 | 0.14 |
| Jowar | 0.36 | 0.16 | 0.01 | 0.07 | |
| Gunawadi | Wheat | 0.33 | 0.41 | 0.02 | 0.08 |
| Jowar | 0.27 | 0.04 | 0.02 | 0.03 | |
| Nira left canal soil analysis | |||||
| Sites | Crop plants | Micro elements | |||
| Fe (PPM) | Mn (PPM) | Zn (PPM) | Cu (PPM) | ||
| Katewadi | Wheat | 0.76 | 0.13 | 0.02 | 0.19 |
| Jowar | 0.57 | 0.38 | 0.04 | 0.09 | |
| Pandare | Wheat | 0.67 | 0.13 | 0.03 | 0.12 |
| Jowar | 0.56 | 0.21 | 0.01 | 0.12 | |
| Vadgaon-Nimbalkar | Wheat | 0.72 | 0.22 | 0.03 | 0.15 |
| Maize | 0.85 | 0.26 | 0.05 | 0.16 | |
| Less water reservoir soil analysis | |||||
| Sites | Crop plants | Micro elements | |||
| Fe (PPM) | Mn (PPM) | Zn (PPM) | Cu (PPM) | ||
| Sawal | Wheat | 0.47 | 0.10 | 0.02 | 0.06 |
| Jowar | 0.61 | 0.22 | 0.09 | 0.10 | |
| Parawadi | Wheat | 0.31 | 0.18 | 0.08 | 0.05 |
| Jowar | 0.52 | 0.60 | 0.03 | 0.06 | |
| Supa | Wheat | 0.30 | 0.15 | 0.02 | 0.07 |
| Jowar | 0.37 | 0.07 | 0.02 | 0.02 | |
| Murti | Wheat | 0.70 | 0.23 | 0.02 | 0.17 |
| Jowar | 0.47 | 0.23 | 0.03 | 0.10 | |
| Loni-bhapkar | Wheat | 0.27 | 0.09 | 0.02 | 0.08 |
| Jowar | 0.28 | 0.18 | 0.01 | 0.07 | |
| Waki | Wheat | 0.52 | 0.36 | 0.02 | 0.08 |
| Jowar | 0.34 | 0.10 | 0.01 | 0.07 | |
Table 2: Micro nutrient analysis.
Results and Discussion
In the present investigation study focus on the physicochemical analysis of a soil from crop fields in Baramati Tehsil region. During study preferred to investigate the soil samples for its physicochemical analysis of some parameters [10]. Total 30 soil samples collected from 15 sites during December 2020 to February 2021. Physicochemical characteristics of soil were assessed by laboratory analysis. A physicochemical study of soil is based on various parameters like soil pH, Electrical Conductivity (EC), Organic Carbon (OC), available Nitrogen (N), Phosphorus (P), Potassium (K), Sodium (Na), Calcium Carbonate (CaCO3) and micronutrients (Fe, Mn, Cu and Zn). Soil samples were analyzed for their physicochemical properties and their results were represented in Table 1, however, micronutrient analysis results represented in Table 2. All site soil samples in crop fields pH shows moderately alkaline to strong alkaline [11]. Organic carbon fluctuate ranges from ≥ 1.00 ≤ 0.81-1.00 ≤ 0.51-0.80 ≤ 0.41-0.50 ≤ 0.21 to 0.40. Nitrogen content shows ≥ 140-280 ≥ 140, phosphorus content shows ≤ 8-14, ≤ 7.00, kg/hector, potassium content ≥ 300 kg/hector shows all sites abundance in amount. All sites crop field’s soils shows luxuriant amount of sodium content. CaCO3 content shows medium to abundance in quantity in all sites. In case of micronutrients analysis shows as low ranges of Fe ≥ Mn ≥ Zn ≥ Cu in ppm all sites crop fields soil samples.
Conclusion
In this study soil physicochemical characteristics were assessed by laboratory analysis. Different locality maximum site crop field’s soil samples show average electrical conductivity some sites soil samples show more than average electrical conductivity. In modern agriculture excess use of chemical fertilizers affects the pH, EC, Organic carbon, N, P, K, Na and CaCO3. More than average 1.00 Electrical conductivity which are harmful for germination. Due to overdose of chemical fertilizers its affects soil fertility resulted to decreases crop yields production.
Acknowledgement
Authors are sincerely thanks to Dr. SJ Chavan, head of post graduate research centre, department of botany also thankful to Dr. BS Mali, for his guidance and encouragement during work period. We extend our special thanks to Principal Dr. CV Murumkar, Tuljaram Chaturchand college of arts, science and commerce, baramati (autonomous) for his guidance and encouragement and providing laboratory facilities. We also thankful to those persons involved and support our work.
References
- Bharambe PR, Ghonsikar CP. Fertility status of soils in Jayakwadi Command. Maharashtra Agric Univ. 1984;9(3):326-327.
- Bharambe PR, Ghonsikar CP. Physicochemical characteristics of soils in Jayakwadi Command. J Maharashtra Agric Univ.1985;10:247-249.
- Bhattacharya T, Deshmukh SN, Roychaudhary C, et al. Soils and land use of Junnar Tahasil, Pune district, Maharashtra. J Maharashtra Agric. 1989;14(1):1-4.
- Carvalhais N. Global covariation of carbon turnover times with climate in terrestrial ecosystems. Nature. 2014;514(7521):213-217. [Crossref] [Google Scholar] [PubMed]
- Nisha C, Kamlesh. Analysis of soil samples for its physicochemical parameters from kadi city. New Int Ref J. 2017;3:36-40.
- Doran JW, Zeiss MR. Soil health and sustainability: Managing the biotic component of soil quality. Appl Soil Ecol. 2000;15(1):3-11. [Crossref] [Google Scholar]
- Lal R. Soil carbon sequestration impacts on global climate change and food security. Sci. 2004;304(5677):1623-1627. [Crossref] [Google Scholar] [PubMed]
- Oyeyiola GP, Agbaje AB. Physicochemical analysis of a soil near microbiology laboratory at the University of Ilorin, main campus. J Nat Sci Res. 2013;3(6):78-81. [Google Scholar]
- Quinton JN, Govers G, Van Oost K, et al. The impact of agricultural soil erosion on biogeochemical cycling. Nat Geosci. 2010;3(5): 311-314. [Google Scholar]
- Yeshpal S. Physicochemical properties of soil, influenced by different levels of NPK, FYM and Sulphur in mustard moong cropping sequence. Int J Curr Microbiol Appl Sci. 2017;6(12):4187-4195. [Crossref]
- Walkely A, Black I. An examination of the degtjareff method for determining organic carbon in soils: effect of variations in digestion conditions and of inorganic soil constituents. Soil Sci.1934;63:251-264. [Crossref]
