Original Article
, Volume: 10( 6)Optimal Enzyme-Assisted Ethanol Extraction of Flavonoids from Broccoli by RSM and Research on Antioxidant Effect
- *Correspondence:
- Hui-duan L, Department of Chemistry and Life Science, Chuxiong Normal University, Chuxiong, 675000, PR China, Tel: +86-878-3100507
E-mail: lhd08@cxtc.edu.cn
Received: June 06, 2016; Accepted: July 04, 2016; Published: July 12, 2016
Citation: Hui-duan L. Optimal Enzyme-Assisted Ethanol Extraction of Flavonoids from Broccoli by RSM and Research on Antioxidant Effect. Nano Sci Nano Technol. 2016;10(5):105.
Abstract
Enzyme-assisted ethanol extraction of total flavonoids from broccoli and research on its antioxidant effect, were studied in this paper. Enzyme concentration, solid-liquid ratio, extraction temperature and time were determined as four single-factor in the experiment. According to the single-factor experimental results, the extract process was further optimized by RSM and Box-Benhnken design. The optimum extract conditions were enzyme concentration of 0.15%, solid-liquid ratio of 5:30 (g/mL), extraction temperature of 70°C and time of 2 h, the experimental responding extraction ratio was 0.935% corresponding to the theoretical predictions of 0.953%. The experimental extraction ratio matched well with the theoretical value by solving the multiple regression equation. RSM has been proved to be an effective technique for optimization of extraction process and the fitted quadratic model has a predictive effect on target extracts. The scavenging effect of broccoli extracts on hydroxyl radicals displayed a significant dose-effect relationship.
Keywords
Enzyme-assisted ethanol extraction; Response surface methodology; Box-Benhnken design; Broccoli; Enzyme; Antioxidant effect
Introduction
Flavonoids are natural polyphenolic antioxidants with significant effects on anti-peroxidation and free radical scavenging. Flavonoids have significant antioxidant, anti-cancer, anti-inflammatory, bactericidal, anti-virus and regulating body immunity, etc. [1-4]. The Extraction technology of flavonoids reported in the literature includes organic solvent extraction, ultrasonic extraction, microwave extraction, supercritical fluid extraction and Enzyme-assisted extraction [5-6].
Response Surface Methodology (RSM) is a statistical method in order to solve problems containing multiple variables. Multiple quadratic functions were obtained by reasonable experimental design to fit the factors and response value, and the optimal process parameters were determined by analyzing regression equation. RSM has advantages of shorten experimental cycle, high accuracy of the regression equation, Interactions between multiple factors, etc. [7]. RSM was demonstrated an effective statistic technique for optimizing complex processes, which has been successfully used to optimize the extraction of total flavonoids from many medicine plants [8,9]. The total flavonoids extraction ratio was greatly influenced by extraction conditions; Box-Behnken Design was performed to predict the optimal extraction conditions [10].
There were related reports on extraction of total flavones from broccoli in the literature [11-13]. Zhou et al. [11] reported the extraction of total flavones from broccoli by RSM. The reported optimum extract conditions were ethanol concentration of 90%, solid-liquid ratio of 1.0:30 (g/mL), and extraction temperature of 85.28°C and time of 1.82 h with responding extraction ratio of 0.853% [11]. Chen and Shi [12,13] reported Ultrasonic and cellulase assisted extraction of total flavonoids from broccoli [12,13]. The former extraction ratio was 1.128% under ethanol concentration of 51% solid-liquid ratio of 1.0:20 (g/mL), extraction temperature of 53°C and ultrasonic power of 201 w. The latter extraction ratio was reached up to 1.251% with the enzyme dosage of 0.84%, enzymolysis pH of 5.0 and enzymolysis time of 57 min.
Here, optimization of Enzyme-assisted ethanol extraction flavonoids from broccoli by RSM and determination of flavonoids content by spectrophotometry were reported. Additional, cellulase and pectinase enzyme were assisted the extract process by destroying the cell walls. The hydroxyl radical scavenging effect of broccoli extracts was also studied. This research was helpful in providing valuable flavonoids content data for development and utilization of broccoli.
Materials and Methods
Materials
Broccoli (purchased in chuxiong’s agricultural market) → dry → crush → Spare.
Experimental methods
Enzyme-assisted ethanol extraction of total flavonoids from broccoli was initially determined by single-factor experiment, and then optimized by Response Surface Methodology. Finally, Research on hydroxyl radicals scavenging effect of broccoli extracts was studied. The experimental illustration of RSM optimization of broccoli flavonoids extraction and radical scavenging effects of its extracts was illustrated in Figure 1. Enzyme-assisted ethanol extraction from broccoli, Chromogenic reaction of broccoli extracts, and obtains of linear equations from Rutin standard curve were performed according to the literature [14,15].
Figure 1. The experimental illustration of RSM optimization of Broccoli flavonoids extraction and radical scavenging effects.
Optimization of the extraction process by RSM
Optimization of flavonoids extraction by RSM was discussed by Zhang et al. [16]. Box-Benhnken Design combining with quadratic response model of four factors and three levels were performed to optimize extraction. First, the independent variables of four single-factors were determined, the level of variables were coded by -1, 0, 1 based on the results of single-factor experiment (Table 1). A total of 29 points were designed, including points 16 factorial, 8 star points and 5 central points to ensure the precision of experiment.
| Code levels ofindependentvariables | Independent variables | |||
|---|---|---|---|---|
| A: EnzymeConcentration (%) | B: Solid-liquidratio(mL·g-1) | C: Extraction temperature (°C) | D: Extractiontime (h) | |
| -1 | 0.05 | 3:30 | 60 | 2.0 |
| 0 | 0.10 | 5:30 | 70 | 3.0 |
| +1 | 0.15 | 7:30 | 80 | 4.0 |
Table 1. Factors and levels of Response Surface Methodology.
Study on hydroxyl radical inhibition activity
Total flavonoids were extracted from Broccoli under the preferred conditions by RSM. The extracts ware centrifuged, purified by macro porous resin, ethanol elution (ethanol volume fraction 80%), solvent evaporation, freeze-dried to obtain the total flavonoids powder. Broccoli total flavonoids solutions with different concentrations were prepared. Hydroxyl radical scavenging effect was operated [16-18], broccoli total flavonoids and BHT solutions with different concentrations were added, the absorbance was measured under 510 nm, and the average of absorbance was collected by parallel experiments. The scavenging ratio was calculated as:
The scavenging ratio of hydroxyl radical (%)=[A0-(Ax-Amx0)]/A0 × 100
A0 is the absorbance of control solution, Ax was the absorbance of broccoli extract; Ax0 was background absorbance of the extract without H2O2.
Results and Discussion
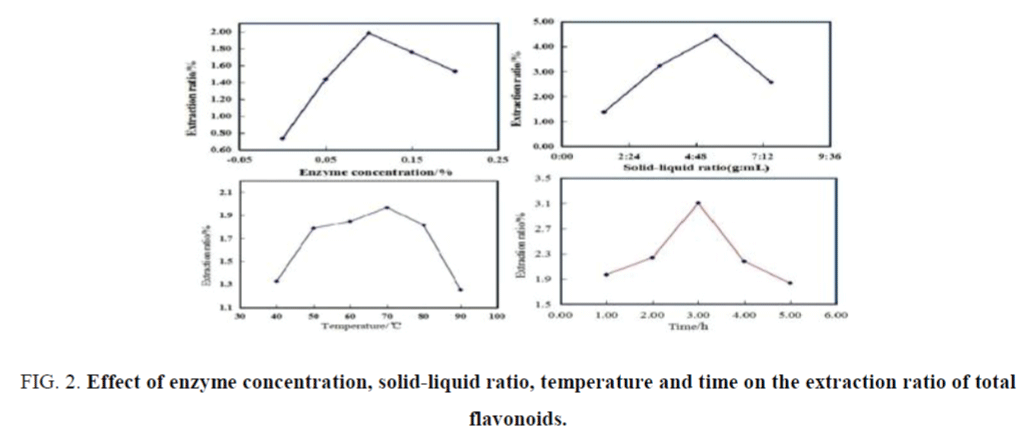
Chromogenic reaction of Broccoli extracts was consistent with Rutin, which confirms that broccoli contained total flavonoids. The absorption spectra of Rutin and broccoli extracts determined the maximum absorption wavelength of 510 nm (Figure 2). The linear regression equation was formulated as A=3.283C-0.009, R2=0.999 by the standard curve (Figure 2).
Figure 2. Effect of enzyme concentration, solid-liquid ratio, temperature and time on the extraction ratio of total flavonoids.
Influences of each single factor on extraction ratio were shown in Figure 2. The optimum enzyme concentration was 0.10% with the responding extraction ratio of 1.984% for broccoli. Extraction ratio was significantly increased with the increasing of solid-liquid ratio, when the solid-liquid ratio was higher than 5:30 (g/mL), extraction ratio began to decrease. Higher than 5:30 (g/mL), resulted in a waste of materials; lower than 5:30 (g/mL), the concentration gradient of solid-liquid phase was two small, which was not conducive to the dissolution of total flavonoids. The preferred solid-liquid ratio was 5:30 (g/mL) with the responding extraction ratio of 4.44% for broccoli. With the temperature increasing, extraction ratio increased significantly, the maximum of extraction ratios of 1.967% was achieved at 70°C. The higher temperature would lead to ethanol evaporation and oxidative degeneration of flavonoids. The lower temperature decreases the rate of flavonoids dissolution. So the optimum extraction temperature was 70°C for extraction total flavonoids from broccoli. The optimum extraction time was 3.0 h with the responding extraction ratio of 3.107% from broccoli. Lower than 2.0 h, the dissolution balances were not achieved, higher than 2.0 h, the dissolution of other fat-soluble impurities complicated the post-separation and purification of total flavonoids.
According to the results of single factor experiments, enzyme concentration of 0.05% to 0.15%; solid-liquid ratio of 3.0:30-7.0:30 (g/mL), extraction temperature of 60°C to 80°C and extraction time of 2.0 h to 4.0 h were determined as the factors and scope for response surface analysis.
Response surface optimization of extraction process
Multiple regression model and analysis of variance (ANOVA): The extraction processes of total flavonoids from broccoli were further optimized by RSM. According to the single-factor experimental results of 3.1, enzyme concentration of 0.05% to 0.15%; solid-liquid ratio of 3.0:30~7.0:30 (g/mL), extraction temperature of 60°C to 80°C and extraction time of 2.0 h to 4.0 h were selected as the actual levels of factors to maximize the extraction ratio of total flavonoids by Box-Benhnken design, as listed in Table 1.
A total of 25 experiments were designed, including 16 factorial experiments, 8 star experiments and 1 central experiment to estimate the absolute error.
The RSM experimental design and results of extraction ratio for Broccoli was shown in Table 2. Extraction ratio ranged from 1.708% to 2.409%. The maximum of extraction ratio was recorded under the experimental conditions of enzyme concentration of 0.10%; solid-liquid ratio of 3:30 (g/mL), extraction temperature of 80°C and extraction time of 3.0h with the responding extraction ratio of 2.409%.
| Std | Run | Independent variables | ||||
|---|---|---|---|---|---|---|
| A: Enzyme Concentration (%) |
B: Solid-liquid ratio (g/mL) | C: Extraction temperature (c) | D: Extraction time (h) | Response 1 extraction ratio (%) | ||
| 14 | 1 | 0.10 | 7:30 | 60 | 3 | 1.9818 |
| 23 | 2 | 0.10 | 3:30 | 70 | 4 | 2.2080 |
| 7 | 3 | 0.10 | 5:30 | 60 | 4 | 1.7664 |
| 12 | 4 | 0.15 | 5:30 | 70 | 4 | 2.1972 |
| 21 | 5 | 0.10 | 3:30 | 70 | 2 | 2.3550 |
| 16 | 6 | 0.10 | 7:30 | 80 | 3 | 1.7838 |
| 25 | 7 | 0.10 | 5:30 | 70 | 3 | 1.9932 |
| 15 | 8 | 0.10 | 3:30 | 80 | 3 | 2.4090 |
| 20 | 9 | 0.15 | 5:30 | 80 | 3 | 1.7088 |
| 4 | 10 | 0.15 | 7:30 | 70 | 3 | 1.9080 |
| 9 | 11 | 0.05 | 5:30 | 70 | 2 | 1.9200 |
| 6 | 12 | 0.10 | 5:30 | 80 | 2 | 2.1024 |
| 10 | 13 | 0.15 | 5:30 | 70 | 2 | 2.0736 |
| 5 | 14 | 0.10 | 5:30 | 60 | 2 | 2.1024 |
| 3 | 15 | 0.05 | 7:30 | 70 | 3 | 1.8249 |
| 18 | 16 | 0.15 | 5:30 | 60 | 3 | 2.0220 |
| 17 | 17 | 0.05 | 5:30 | 60 | 3 | 1.7664 |
| 2 | 18 | 0.15 | 3:30 | 70 | 3 | 2.1540 |
| 24 | 19 | 0.10 | 7:30 | 70 | 4 | 1.9662 |
| 19 | 20 | 0.05 | 5:30 | 80 | 3 | 1.9644 |
| 8 | 21 | 0.10 | 5:30 | 80 | 4 | 2.1900 |
| 13 | 22 | 0.10 | 3:30 | 60 | 3 | 2.0640 |
| 11 | 23 | 0.05 | 5:30 | 70 | 4 | 1.9119 |
| 1 | 24 | 0.05 | 3:30 | 70 | 3 | 1.7880 |
| 22 | 25 | 0.10 | 7:30 | 70 | 2 | 2.0340 |
Table 2. Experimental design and results for extraction ratio by using Box-Behnken and RSM.
The experimental data was analyzed by using design-expert 8.0, the response variable of extract ratio and the four independent variables were related by the following multiple regression equation:
Extract ratio=+1.99+0.074A-0.12 B+0.038 C-0.029D-0.071 AB-0.13AC+0.033AD-0.14 B C+0.020 BD+0.11 CD-0.10 A2+0.055B2-0.022C2+0.098 D2
Extract ratio=-0.24321+28.94275 × enzyme concentration+0.31811 × solid-liquid ratio+0.062812 × extraction temperature-1.47580 × extraction time-0.70725 × enzyme concentration × solid-liquid ratio-0.25560 × enzyme concentration × extraction temperature+0.65850 × enzyme concentration × extraction time-6.78750E-003 × solid-liquid ratio × extraction temperature+9.90000E-003 × solid-liquid ratio × extraction time+0.010590 × extraction temperature × extraction time-40.05000 × enzyme concentration2+0.013641 × solid-liquid ratio2-2.23500E-004 × extraction temperature2+0.098363 × extraction time2
Table 3 showed the analysis of variance (ANOVA) for the multiple regression equation, The Model F-value of 3.45 implies the model is significant. There is only a 2.75% chance that a "Model F-Value" this large could occur due to noise. Values of "Prob>F" less than 0.0500 indicate model terms are significant. In this case, the linear term of solid-liquid ratio and the interaction terms of solid-liquid ratio and extraction temperature were significant for response variables. Values greater than 0.1000 indicate the model terms are not significant. If there are many insignificant model terms (not counting those required to support hierarchy), model reduction may improve your model.
| Source of deviation | Sum of Squares | df | Mean Square | F Value | p-value Prob>F | significant |
|---|---|---|---|---|---|---|
| Model | 0.669027 | 14 | 0.047788 | 3.44942 | 0.0275 | |
| A | 0.065712 | 1 | 0.065712 | 4.743238 | 0.0544 | |
| B | 0.182361 | 1 | 0.182361 | 13.1632 | 0.0046 | s |
| C | 0.017282 | 1 | 0.017282 | 1.247484 | 0.2902 | |
| D | 0.010075 | 1 | 0.010075 | 0.727207 | 0.4137 | |
| AB | 0.020008 | 1 | 0.020008 | 1.444229 | 0.2571 | |
| AC | 0.065331 | 1 | 0.065331 | 4.715762 | 0.0550 | |
| AD | 0.004336 | 1 | 0.004336 | 0.312998 | 0.5882 | |
| BC | 0.073712 | 1 | 0.073712 | 5.320713 | 0.0438 | s |
| BD | 0.001568 | 1 | 0.001568 | 0.113193 | 0.7435 | |
| CD | 0.044859 | 1 | 0.044859 | 3.238039 | 0.1021 | |
| A2 | 0.028306 | 1 | 0.028306 | 2.043184 | 0.1834 | |
| B2 | 0.008406 | 1 | 0.008406 | 0.606752 | 0.4541 | |
| C2 | 0.00141 | 1 | 0.00141 | 0.101807 | 0.7562 | |
| D2 | 0.027318 | 1 | 0.027318 | 1.971885 | 0.1905 | |
| Residual | 0.138538 | 10 | 0.013854 | |||
| Cor Total | 0.807566 | 24 | ||||
| R-Squared | 0.8284 | Adj R-Squared | 0.5883 | |||
| Adeq Precision | 7.584 | CV% | 5.86 |
Table 3. ANOVA for response surface quadratic model for broccoli.
The analysis result of ANVOA indicated the response variable and the four independent variables were not a simply linear relationship. The value of R2 (0.8248) and RAdj2 (0.5883) for the multiple regression equation was not approaching, indicated that the model need to be further optimized. The adequate precision value of 7.584 was much higher than the desirable value of 4.00, which presented a higher “signal (response) to noise (deviation)” and indicated that the model was significant for the extraction process, and the P value for the model was less than 0.05. This model can be used to navigate the design space. The lower value of coefficient of the variance (CV=5.86%) also indicated that the model has a predictable effect for the extraction process of total flavonoids.
The result of analysis of variance (ANOVA) showed that significant levels of the four factors were sorted by solid liquid ratio>enzyme concentration>extraction temperature>extraction time. The linear term of solid liquid ratio and the interaction term of solid liquid ratio and extraction temperature were significant for the response variable.
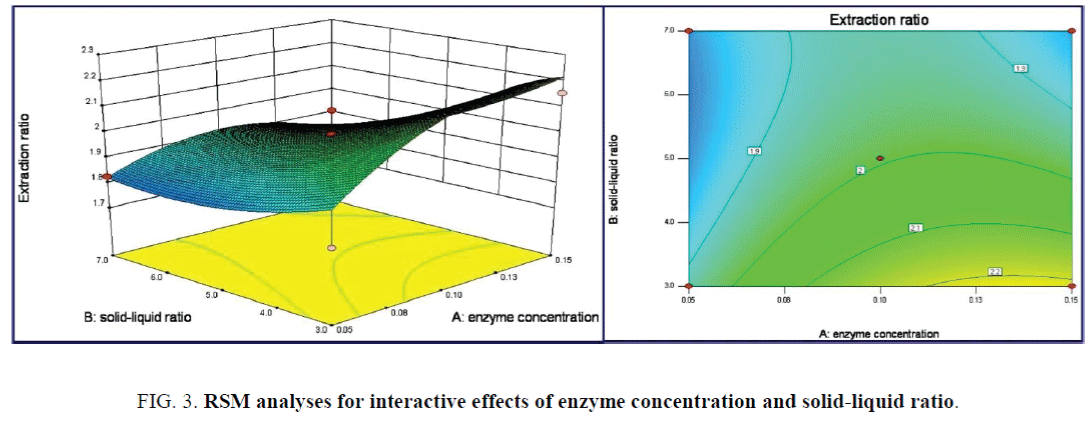
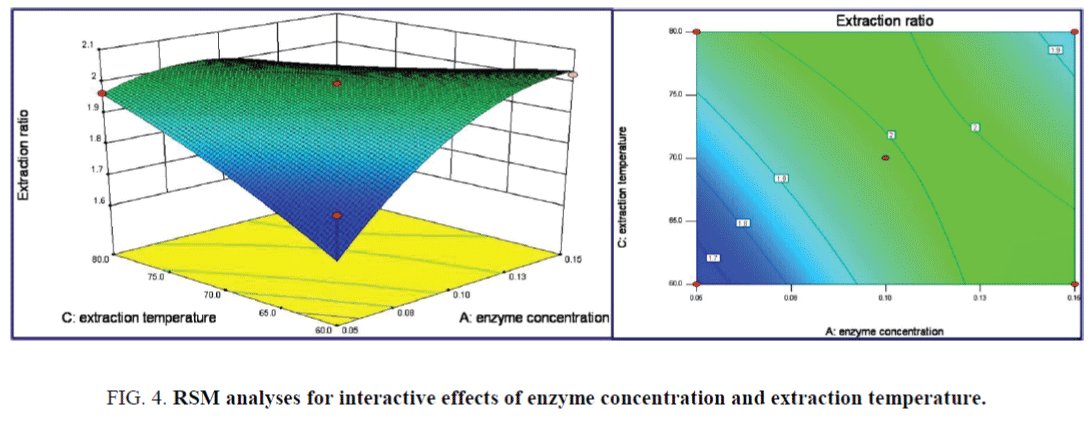
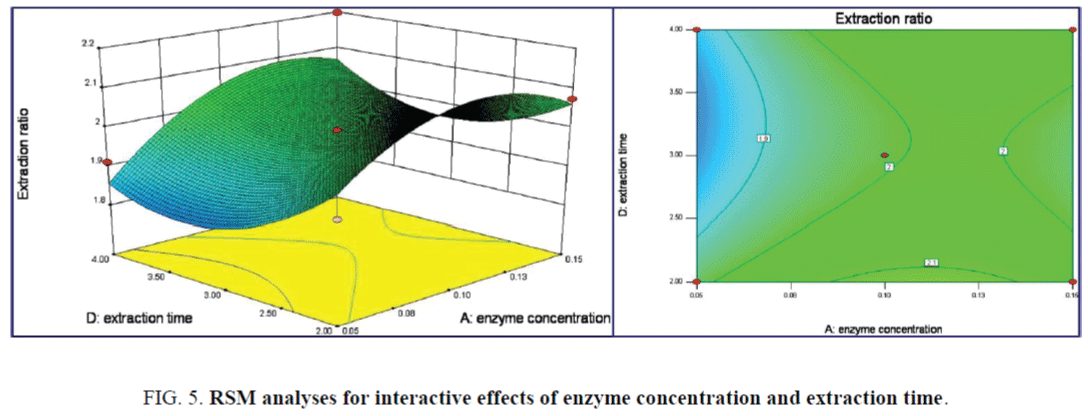
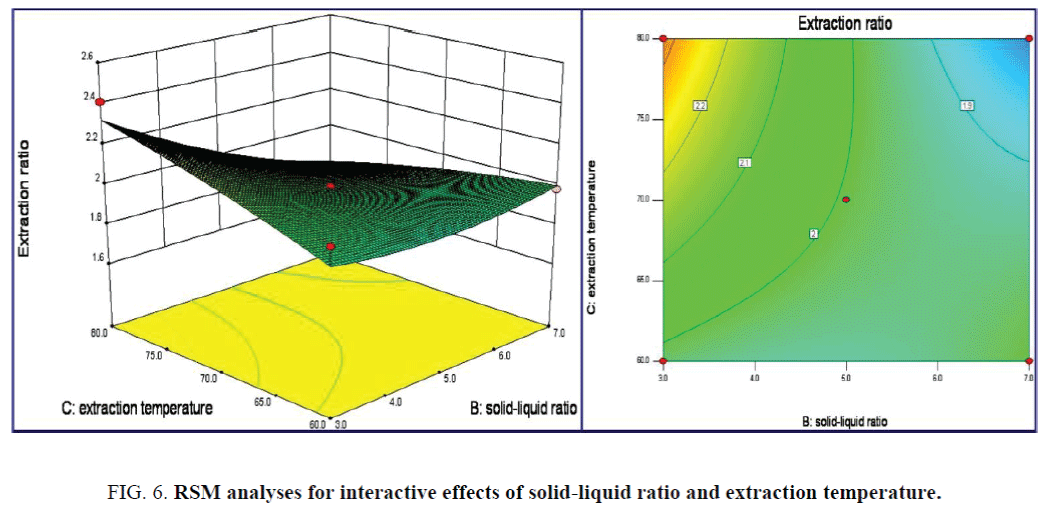
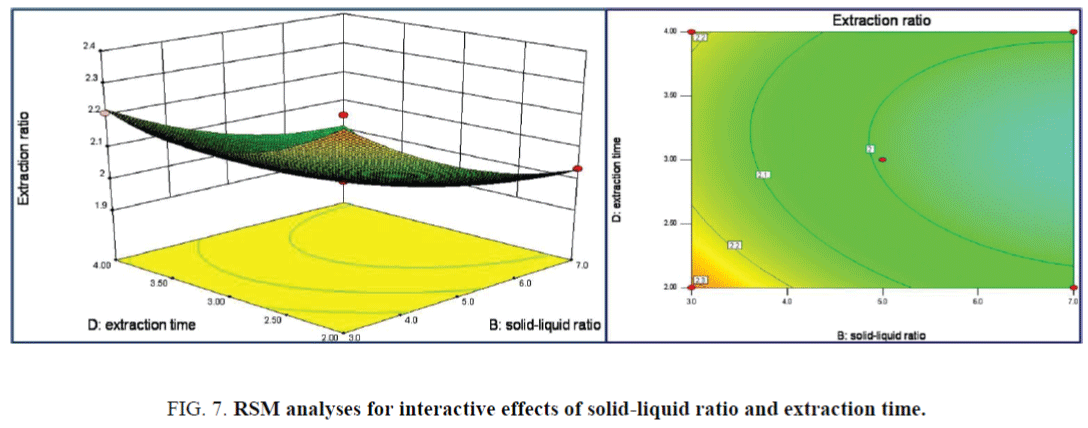
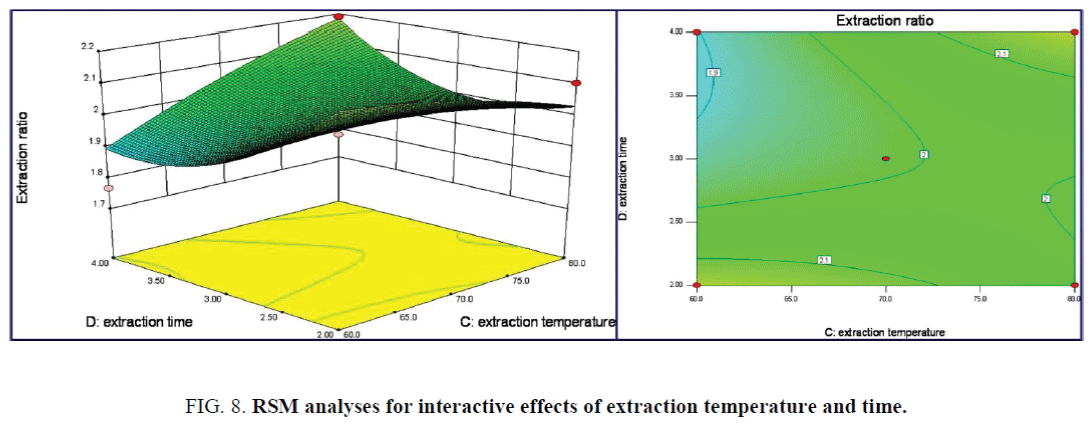
RSM analysis and research on the optimum extract process: The multiple regression models could be vividly reflected by the 3D response surface and Contour lines plots, as shown in Figure 3-8. The 3D response surface plots reflected the effects of multiple independent variables on the response value, the sensitivity of response value to different factors could also be analyzed. The corresponding surfaces were much steeper, indicated its extremely significant impact on response value. The closer the curve to the center in the Contour lines plots, the greater of the value corresponding response variable; contour lines with circular indicated weak interactions between independent variables, contour lines with oval indicated strong interaction. An increase of each independent variable resulted in an initial increase and then decrease of response variables.
Illustration in the 3D response surface plots of Figure 3, the corresponding surface of solid-liquid ratio was steeper than that of enzyme concentration, indicated its significant impact on responding value. Circle-like Contour lines indicated the weak interaction effect of the two terms on responding values with the p value of 0.2571. The maximum extraction ratios of 2.409% were achieved as enzyme concentration of 0.13% and solid-liquid ratio of 3.0: 30 (g/mL).
The interaction terms of enzyme concentration and extraction temperature on the responding values were displayed in the 3D response surface plots of Figure 4, the impact of the former term on extraction ratio was more significant than that of the latter. Contour lines plots was approaching to Oval, indicated the interaction effects of the above two terms on the responding value began to significant with P=0.0550. The maximum extraction ratios of 2.409% were obtained as the enzyme concentration of 0.13% and extraction temperature of 79.7°C.
The impact of the enzyme concentration on the responding value was more significance than that of extraction time, as shown in Figure 5. Contour lines plots also indicated the weak interaction effects of the above two terms on the response values P=0.5882. The maximum extraction ratios of 2.409% were obtained as enzyme concentration of 0.13% and extraction time of 3.8 h. From the 3D response surface plots of Figure 6, the impact of solid-liquid ratio and extraction temperature terms on the extraction ratios was significant for the responding value with p=0.0438. Oval-like Contour lines plots indicated significance interaction effect of above two terms on the response values. The maximum extraction ratio of 2.409% was achieved as the solid-liquid ratio of 3:30 (g/mL) and extraction temperature of 79.7°C.
The 3D response surface and Contour lines plots of the interaction effect of solid-liquid ratio and extraction time on extraction ratio was shown in Figure 7, the interaction effect of the above two terms was all not significant. While the linear of solid-liquid ratio has a significance effect on the extraction ratio from the steeper surface. The maximum extraction ratio was achieved as 2.409%. Both the linear and interaction effects of extraction temperature and time on the extraction ratio were not significance as in the 3D response surface and Contour lines plots of Figure 8. The maximum extraction ratio of 2.409% was achieved under extraction temperature 79.7°C of and time of 3.8 h.
The optimum values of the selected variables were obtained by solving the multiple regression equation. The values obtained were A=0.13%, B=3.0:30 (g/mL), C=79.7°C and D=3.8 h, with the corresponding extraction ratio of 2.409% for broccoli, calculated by design-expert 8.0 software. In the experiment, three triplicate experiments were performed under preferred extract conditions of enzyme concentration of 0.10%, solid liquid ratio of 3:30 (g/mL), extraction temperature of 80°C and time of 2 h. The average maximum value of extraction ratio was 2.409% for broccoli. The obtained experimental data were listed in Table 4, the experimental extraction ratio and calculated values of response variable matched each other very well, which indicated that the model were reliable for the extraction process of broccoli.
| Run | Enzyme concentration (%) | Solid-liquid ratio (g/mL) | Extraction temperature (°C) | Extraction time (h) | extraction ratio | Average value |
|---|---|---|---|---|---|---|
| 1 | 0.10 | 3:30 | 80 | 3 | 2.409 | |
| 2 | 0.10 | 3:30 | 80 | 3 | 2.409 | 2.409 |
| 3 | 0.10 | 3:30 | 80 | 3 | 2.409 |
Table 4. The obtained experimental data of extraction ratio under prefer experimental conditions.
Study on hydroxyl radical scavenging activity
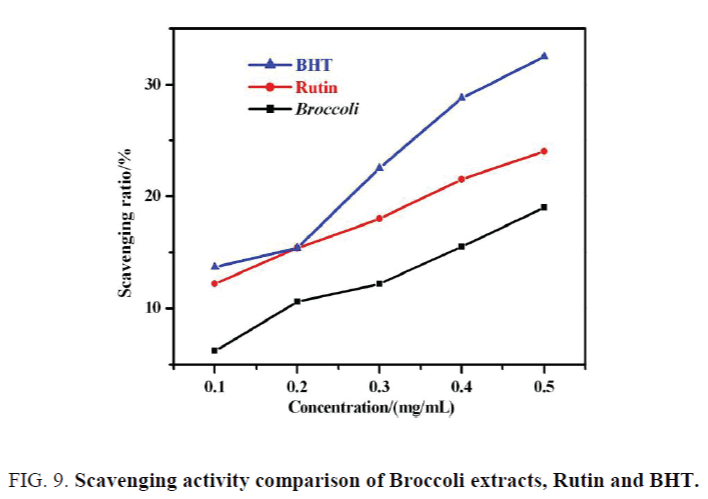
The Flavonoids compounds had a scavenging effect on hydroxyl radical, superoxide radicals and •DPPH radicals as the o-dihydroxy from the structural benzene ring [14-16]. Hydroxyl radical scavenging effects of broccoli extracts, Rutin and BHT with different concentrations were measured and listed in Figure 9, with the concentration increasing, the scavenging ratio for hydroxyl radicals increased, which showed a significant degree of dose-effect relationship. Hydroxyl radical scavenging effects of the three antioxidant with the same concentration were sorted by BHT>Rutin s>broccoli extract. The reasons were analyzed as follows: first, o-dihydroxy from benzene rings were partly methylated, leading to the reduction of scavenging activity on hydroxyl radical [16-18]. Second, the lack of necessary separation and identification for extracts, and the presence of impurities also affected their scavenging effects.
Conclusions
The RSM and BBD were successfully employed to optimize the enzyme-assisted extraction of flavonoids from Broccoli. The linear term of solid liquid ratio, interaction term of solid liquid ratio and extraction temperature, displayed significant effects on the responding value of extraction ratio. The experimental central points for Box-Benhnken design were selected. The extraction process was further optimized by RSM and Box-Benhnken design. The optimum extract conditions were enzyme concentration of 0.13%, solid-liquid ratio of 3.0:30 (g/mL), extraction temperature of 79.7°C and time of 3.8 h with maximum extraction ratio of 2.409% by solving the multiple regression equation. The experimental extraction ratio matched well with the calculated value, which indicated the predictive effect of the fitted quadratic model on target extracts. The scavenging activity of extracts on hydroxyl radicals displayed a significant dose-effect relationship. The isolation, purification and structure identification of Broccoli extracts, relationship between antioxidant activity and structure of flavonoids, and related research works are underway.
Acknowledgement
The authors acknowledge the financial support of National College students innovative entrepreneurial training program (16449) and College students' innovative entrepreneurial training program of Yunnan Education Department.
References
- Yang L, Cao YL, Jiang JG, et al. Response surface optimization of ultrasound-assisted flavonoids extraction from the flower of Citrus aurantium L. var. amara Engl. J Sep Sci. 2010;33(9):1349-55.
- Daffodil ED, Mohan VR. Total phenolics, flavonoids and in vitro antioxidant activity of Nymphaea Pubescens wild rhizome. World JPharmPharmaceutSci. 2013;2(5):3710-22.
- Huang W, Xue A, Niu H, et al. Optimized ultrasonic-assisted extraction of flavonoids from Folium eucommiae and evaluation of antioxidant activity in multi-test systems in vitro. Food Chem. 2009;114(3):765-1172.
- Li YH, Jiang B, Zhang T, etal. Antioxidant and free radical-scavenging activities of chickpea protein hydrolysate. Food Chem. 2008;106(2):444-50.
- Zhang Y, Cao GJ, Zhang Y, etal. Research on the extraction and identification of flavonoids. Food Res Dev. 2008;29(1):154-7.
- Wang L, Weller CL. Recent advances in extraction of nutraceuticals from plants. Trends Food Sci Tech. 2006;17:300-12.
- Mu YD. Response surface metnodology and its application in food industry. J Zheng Inst Tech. 2001;22(3):91-94.
- Amado IR, Franco D, Sánchez M, et al. Optimization of antioxidant extraction from Solanum tuberosum potato peel waste by surface response methodology. Food Chem. 2014;165:290-99.
- Ranic M, Nikolic M, Pavlovic M, et al. Optimization of microwave-assisted extraction of natural antioxidants from spent espresso coffee grounds by response surface methodology. JCleanProd. 2014;80:69-79.
- Liu W, Yu Y, Yang R, et al. Optimization of Total Flavonoid Compound Extraction from Gynura medica Leaf Using Response Surface Methodology and Chemical Composition Analysis. Int J Mol Sci. 2010:11:4750-63.
- Zhou XJ, Gao YX, Wang ZB et al. Optimization of extraction technology of total flavonoids from brassicaoleracea var. Italica using response surface analysis. Res Dev Mar. 2010;26(6):488-9.
- Chen JF, Shi WM. Application of response surface methodology for extraction optimization of total flavonoids form broccoli assisted by ultrasonic. J Agri Sci YabianUniv. 2014;36(3):232-9.
- Chen JF, Shi WM. Optimization of cellulase assisited extraction total flavonoids from broccoli using response surface method. J Sichuan Agri Univ. 2014;32(3):289-304.
- Li HD. Enzyme-assisted extraction of total flavonoids from Wisteria and study on radicals scavenging effect. JHenan Normal Univ. 2014;42(3):79-84.
- Li H. Response surface optimization of flavonoids extraction from two kinds of chinese tea and research on antioxidant effect. NPAIJ. 2015;11(1):1-011.
- Zhang LM, Li RC, Hao LM, et al. Response surface methodology for optimization of extracting total flavonoids from maca leaves and antioxidant evaluation. Modern FoodSciTechnol. 2014;30(4):233-9.
- SmirnoffN,CumbesQJ.Hydroxylradicalscavengingactivityofcompatiblesolutes.Photochemistry.1989;28(4):1057-60.
- HeimKE, Taglicferro AR, Bobilya DJ. Flavonoid antioxidants: chemistry, metabolism and structure-activity relationships. J Nutr Biochem. 2002;13(10):572-84.

