Original Article
, Volume: 16( 2) DOI: 10.21767/0972-768X.1000268Nio-PANI Composite as Potential Inhibitor for Mild Steel in Acidic Corrosion Environment
- *Correspondence:
- Kamatchi Selvaraj P , Department of Chemistry, Govt. Arts College for Men (AUT), Nandanam, Chennai, Tamil Nadu, India, Tel: 9444568678; E-mail: porbal96@gmail.com
Received: May 04, 2018; Accepted: May 17, 2018; Published: May 23, 2018
Citation: Kamatchi Selvaraj P, Sivakumar S, Selvaraj S. Nio-PANI Composite as Potential Inhibitor for Mild Steel in Acidic Corrosion Environment. Int J Chem Sci. 2018;16(2):268.
Abstract
Oxidative polymerization of aniline along with NiO nanoparticles using APS as oxidant and DBSA as dopant as well as surfactant at 0ºC yielded water soluble NiO-polyaniline composite. Spectral analysis like FTIR, XRD and SEM confirms the formation of the composite. Potentiality against corrosion is tested by gravimetric method, open circuit potential measurement, potentiodynamic polarization and electrochemical impedance spectroscopy. Effectiveness to give protection up to eight hours with slight changes in efficiency is observed in weight loss method. The results expose that the materials synthesized could give safe working environment in industrial maintenance work.
Keywords
NiO-PANI; Mild steel; OCP; Potentiodynamic polarization; EIS
Introduction
Corrosion, a spontaneous process of deterioration of metallic materials by the environment, reflect impact on economic losses and safeties. Apart from the natural commodities, human activities also initiate corrosion. Industrial maintenance work like acid descaling and acid pickling dissolves the machinery parts and reduces their life time. Inhibitors are widely employed for prophylactic action on metal parts [1-3]. The polar functional groups and π-electrons present in the organic inhibitors act as adsorption site for metal-inhibitor interaction [4-6].
The adsorption may be physical due to electrostatic force of attraction between the inhibitors and substrate surface or chemical ascribable to dispense of electrons among inhibitors and metal or both [7,8]. Conducting polymers have been studied extensively in the place of organic compounds owing to their stability and mechanical strength [9,10]. Polyaniline has been explored as good protective abettor against deterioration of metal [11-13]. Pseudocapacitive electrodes have been developed from various transition metal oxides including NiO [14]. Further nickel oxide is used in electrochromic coating [15], as a catalyst [16], as an adhesive in enamels [17] and as an anode layer in solid oxide fuel cells [18]. The above applications of NiO encourages to incorporate it with PANI to improve the inhibition efficiency of PANI. The present paper focuses on the synthesis of water soluble NiO-PANI composite and its competency against corrosion of mild steel in acidic environment.
Materials and Instrumentation
Materials
Analytical grade aniline purchased from Merck Industries was purified by distillation with zinc dust before it was used for synthesis. Hydrochloric acid, polyethylene glycol, Nickel chloride, oxalic acid, ammoniumperoxydisulphate (APS) and sodium salt of dodecyl benzene sulphonic acid (DBSA) chemicals with AR grade purchased from Merck Industries were used without purification.
Instrumentation
The synthesized composite was characterized by recording the FTIR spectrum (Perkin-Elmer 337 spectrometer) in the frequency range of 4000-450 cm-1 using KBr pellets. Rigaku Maniflex diffractometer (Japan) was used to record the XRD and JSM-6390 Scanning Electron Microscope was adopted to analyze the morphology of the composite. Using ECLAB 10.37 model, EIS and potentiodynamic polarization studies were recorded. CHI electrochemical analyzer instrument 1200B model was used to measure OCP values.
Experimental
Synthesis of Nickel Oxide-Polyaniline composite
The nickel oxide nanoparticles were prepared by the procedure reported in the literature [19]. NiO-Polyaniline composite was synthesized by in-situ chemical oxidative polymerization method [20]. To 100 ml of aqueous solution containing 1 ml of 0.1 M aniline and 3 ml of 0.1 M HCl, another solution, which was prepared by dispersing required amount nickel oxide in 0.1 M DBSA using ultrasonic waves of 42 kHz oscillation frequency for 45 minutes, was added. The mixture was kept at 0°C with constant stirring for 4 hours along with the drop wise addition 100 ml of 0.1 M APS solution. The reaction mixture was kept aside for 24 hours. Green colored precipitate obtained was filtered, washed with double distilled water and acetone for several times sequentially and dried in hot air oven for 24 hours.
Results and Discussion
Characterization of NiO-PANI composite
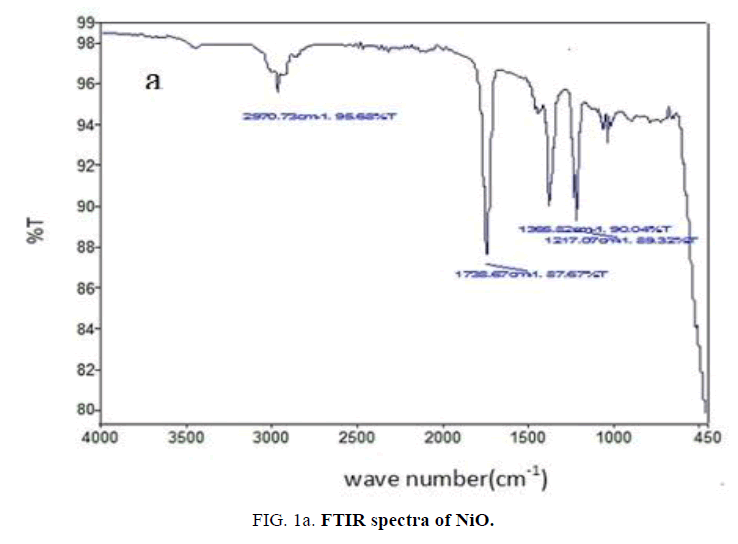
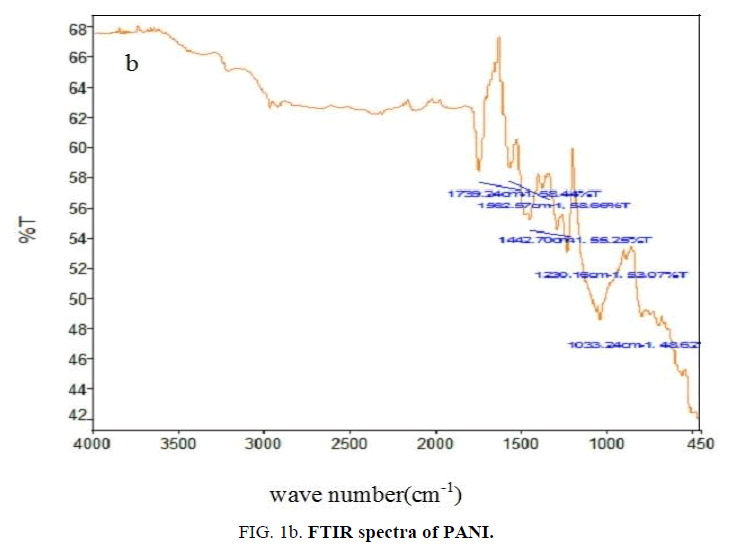
FTIR analysis: The FTIR spectrum of nickel oxide (FIG. 1a) contains peak around 470 cm-1 due to Ni-O stretching vibration and a broad peak around 3500 cm-1 due to -OH vibration of water molecule [21]. The absorption bands of PANI (FIG. 1b) at 1562 cm-1 and 1443 cm-1 due to nitrogen-quinonoid ring structure and other peaks at 1739 cm-1, 1230 cm-1 and 1033 cm-1 are matches very well with the reported values [22].
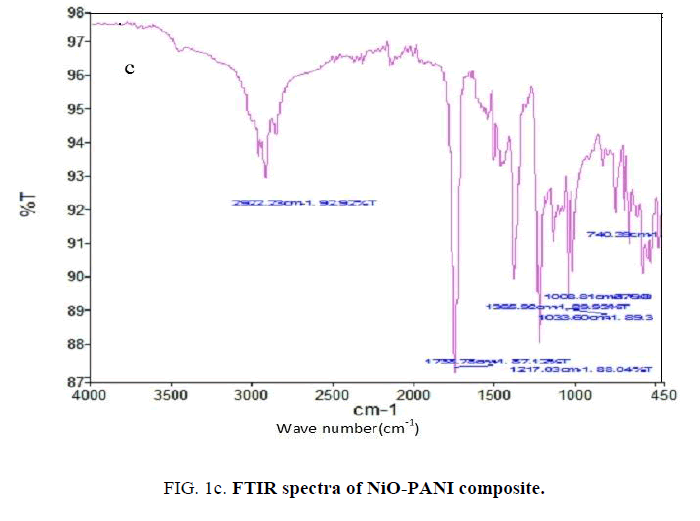
The characteristic peaks shown in FTIR spectrum of NiO-PANI composite (FIG. 1c) at 3450 cm-1, 2922 cm-1, 1735 cm-1, 1036 cm-1 ascribable to O-H vibration, C-H and N-H stretching respectively. The shift observed towards higher frequency region than the reported value [23] might be due to the changes adopted in the preparation to make the composite water soluble.
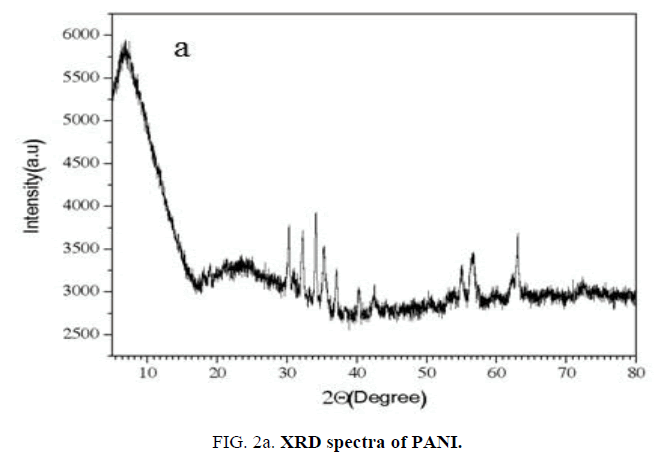
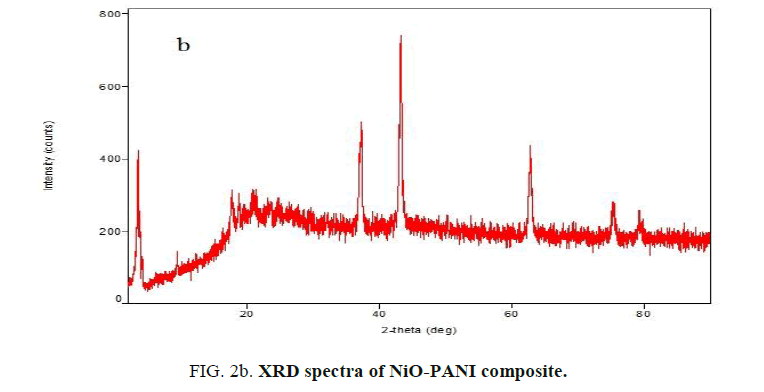
XRD analysis of PANI and NiO-PANI composite: The XRD of NiO-PANI composite (FIG. 2a and 2b) shows peaks around 38°, 44°, 63°, 75° and 79°. These peaks were assigned to nano-NiO by earlier workers [19,21]. The appearance of PANI peaks centered between 2θ=20°-30° [24] indicates that the PANI stains have adsorbed on the surface of nickel oxide [21].
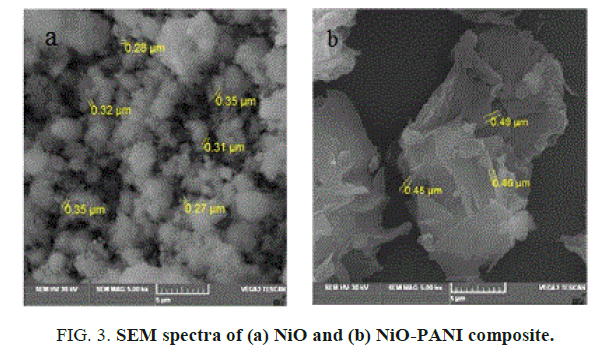
SEM analysis of NiO and NiO-PANI composite: The structural surface morphology of metal oxide and composite are given in FIG. 3a and 3b. It is noticed from the figures that the metal oxide looks like a uniform spherical ball and the composite appears like a cluster with increase in diameter. This matches very well with the earlier report [23].
Preparation of electrode materials
The mild steel coupons having C: 0.21%, Si: 0.035%, Mn: 0.25%, P: 0.082% and 99.28% Fe, were cut in to pieces of dimension 4 cm × 2 cm × 0.2 cm, abraded with different grade abrasive papers starting from 600 to 1200 grit. The abraded coupons were washed with absolute ethanol, double distilled water, dried with acetone and kept in a desiccator. The inhibition efficiency was carried out with freshly polished coupons.
Preparation of electrolytic solutions.
The analytical grade sulphuric acid was diluted with distilled water to prepare the aggressive 1 M and 2 M sulphuric acid solutions. The test solutions were prepared by dissolving 100-500 ppm of composite in 1 M and 2 M sulphuric acid solutions.
Determination of inhibition property
Investigation on weight loss: The gravimetric method is the basic technique for inhibition assessment measurement. It was carried out at room temperature for eight hours continuously. Assessment on weight loss were discovered for the blank and different concentrated test solutions (250 ml) under total immersion of pre-weighed coupons. The specimens were taken out at two hours interval. Washed with bristle brush in absolute ethanol, distilled water and acetone and then dried at room temperature and reweighed. The inhibition efficiency (IE%) and surface coverage (θ) of composite were calculated using the formulae reported earlier [24].
Surface coverage area (θ)=(Wo-Wi/Wo)
Inhibition efficiency (IE %)=(Wo-Wi/Wo) × 100
Where Wo is the loss in weight for uninhibited and Wi is the loss in weight for test solutions. The calculated values are presented in (TABLES 1 and 2).
| Conc. of composite (ppm) | 2-hours | 4-hours | 6-hours | 8-hours | ||||||||
|---|---|---|---|---|---|---|---|---|---|---|---|---|
| Weight loss (g) | I.E (%) | (θ) | Weight loss (g) | I.E (%) | (θ) | Weight loss (g) | I.E (%) | (θ) | Weight loss (g) | I.E (%) | (θ) | |
| Blank | 0.1351 | -- | -- | 0.2275 | -- | -- | 0.2982 | -- | -- | 0.3666 | -- | -- |
| 125 | 0.0237 | 82 | 0.824 | 0.0401 | 82 | 0.819 | 0.0523 | 82 | 0.824 | 0.0680 | 81 | 0.814 |
| 250 | 0.0193 | 85 | 0.857 | 0.0332 | 85 | 0.854 | 0.0520 | 83 | 0.825 | 0.0676 | 82 | 0.816 |
| 375 | 0.0190 | 86 | 0.859 | 0.0321 | 86 | 0.858 | 0.0459 | 85 | 0.846 | 0.0624 | 83 | 0.829 |
| 500 | 0.0167 | 88 | 0.876 | 0.0290 | 87 | 0.872 | 0.0413 | 86 | 0.861 | 0.0580 | 84 | 0.841 |
Table 1: IE and θ values calculated from the weight loss measurement in 1 M blank and test solutions.
| Conc. of composite (ppm) | 2-hours | 4-hours | 6-hours | 8-hours | ||||||||
|---|---|---|---|---|---|---|---|---|---|---|---|---|
| Weight loss (g) | I.E (%) | (θ) | Weight loss (g) | I.E (%) | (θ) | Weight loss (g) | I.E (%) | (θ) | Weight loss (g) | I.E (%) | (θ) | |
| Blank | 0.2412 | -- | -- | 0.4172 | -- | -- | 0.5507 | -- | -- | 0.7046 | -- | -- |
| 125 | 0.0520 | 78 | 0.784 | 0.0950 | 77 | 0.772 | 0.1300 | 76 | 0.764 | 0.1750 | 75 | 0.175 |
| 250 | 0.0479 | 80 | 0.801 | 0.0856 | 79 | 0.794 | 0.1201 | 78 | 0.782 | 0.1550 | 78 | 0.780 |
| 375 | 0.0450 | 81 | 0.813 | 0.0848 | 80 | 0.797 | 0.1160 | 79 | 0.789 | 0.1490 | 79 | 0.788 |
| 500 | 0.0433 | 82 | 0.820 | 0.0804 | 81 | 0.802 | 0.1110 | 80 | 0.798 | 0.1377 | 80 | 0.803 |
Table 2: IE and θ values calculated from the weight loss measurement in 2 M blank and test solutions.
Careful analysis of the data presented in the (TABLES 1 and 2) reveals that the NiO-PANI composite is capable of giving protection against corrosion environment with slight variation in efficiency up to eight hours when its concentration is greater than 250 ppm.
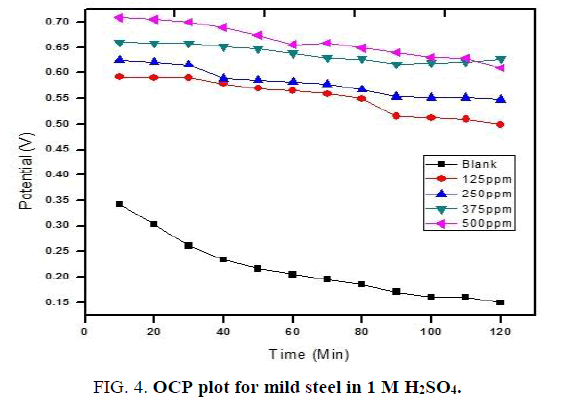
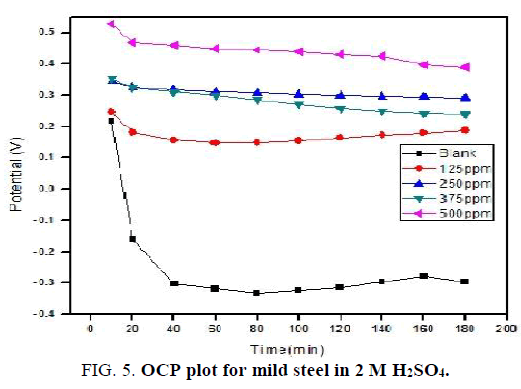
Open circuit potential: Cell, having 1 cm2 area of mild steel as working electrode, platinum electrode as counter electrode and standard calomel electrode as reference electrode is used to measures the open circuit potential in CHI Electrochemical analyzer 1200B model. The OCP data were recorded for 1 M and 2 M solutions continuously upto 120 minutes and 180 minutes respectively. The results observed are presented in (FIG. 4 and 5).
For blank solution sharp fall in OCP values is noticed. By increasing the concentration of NiO-PANI composite the OCP values shifted to positive potential value and also only slight variation is recorded with increase in time. This observation is in good agreement with earlier reports [25,26].
Electrochemical measurements: A Potentiostat/Galvanostat EC-LAB Analyzer model 10.37 with three electrode cell assembly was used to measures electrochemical studies. ASTM 415 mild steel specimen of 1 cm2 area was used as working electrode. The remaining area of the working electrode was pasted with araldite epoxy resin. Platinum electrode was used as counter electrode and saturated calomel electrode was used as reference electrode in the cell assembly. Polarization studies were recorded from -200 to +200 mV with scan rate of 0.5 mV s-1. Frequency range of 100 kHz-10 mHz was adopted with amplitude of 10 mV AC sine wave for EIS studies.
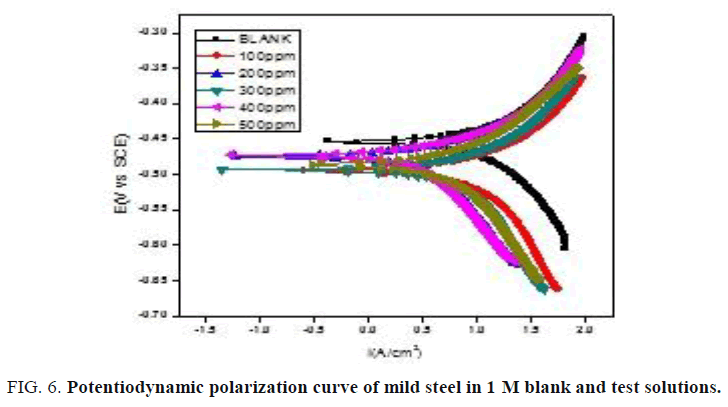
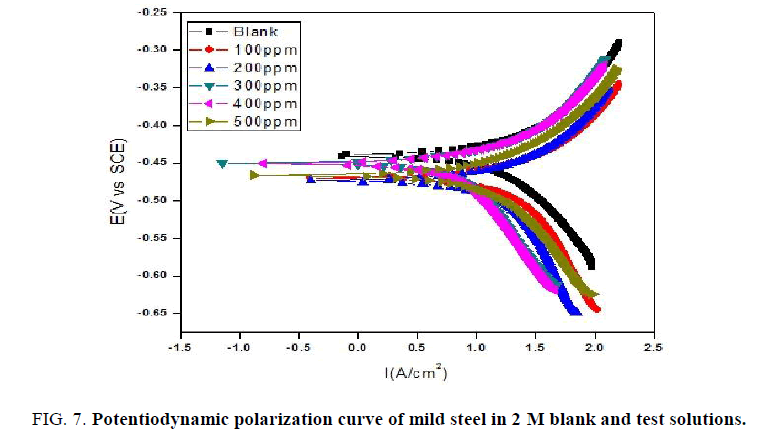
Potentiodynamic polarization meassurements: The Tafel plot recorded for blank and test solutions with different amount of NiO-PANI composite are shown in (FIG. 6 and 7). The values of Icorr, Ecorr, bc and ba calculated from the Tafel plots are presented in the (TABLES 3 and 4) respectively. The efficiency of NiO-PANI composite to prevent corrosion is calculated by the formula reported elsewhere [27].

| Conc. of composite (ppm) | -ECorr (mV vs. SCE) |
ba (mV dec-1) |
bc (mV dec-1) |
Icorr (μA cm-2) |
Inhibition Efficiency (%) | Surface coverage (θ) |
|---|---|---|---|---|---|---|
| Blank | 455 | 61 | 63 | 1960 | -- | -- |
| 100 | 495 | 27 | 36 | 1041 | 47 | 0.4688 |
| 200 | 477 | 35 | 37 | 517 | 74 | 0.7362 |
| 300 | 495 | 22 | 16 | 501 | 75 | 0.7456 |
| 400 | 471 | 22 | 44 | 456 | 77 | 0.7673 |
| 500 | 485 | 19 | 21 | 433 | 78 | 0.7790 |
Table 3: Corrosion Kinetic Parameters of Mild Steel in 1 M blank and test solution.
| Conc. of composite (ppm) | -ECorr (mV vs. SCE) |
ba (mV dec-1) | bc (mV dec-1) | Icorr (μA cm-2) | Inhibition efficiency (%) | Surface coverage (θ) |
|---|---|---|---|---|---|---|
| Blank | 439 | 44 | 57 | 2537 | -- | -- |
| 100 | 495 | 41 | 51 | 1568 | 38 | 0.3819 |
| 200 | 473 | 22 | 23 | 1266 | 50 | 0.5009 |
| 300 | 471 | 15 | 16 | 962 | 62 | 0.6207 |
| 400 | 450 | 20 | 30 | 783 | 69 | 0.6913 |
| 500 | 465 | 15 | 17 | 675 | 73 | 0.7339 |
Table 4: Corrosion kinetic parameters of mild steel in 2 M H2SO4 with composite.
Data presented in (TABLES 3 and 4) exposes that corrosion current increases with increase in concentration of acid. Addition of inhibitor decreases the Icorr value irrespective of the acid strength. Steady decrease in the Icorr value reflects the protection efficiency of the composite. Minimal changes observed on Ecorr, ba and bc by varying concentration of inhibitor exposes it as mixed type inhibitor [28].
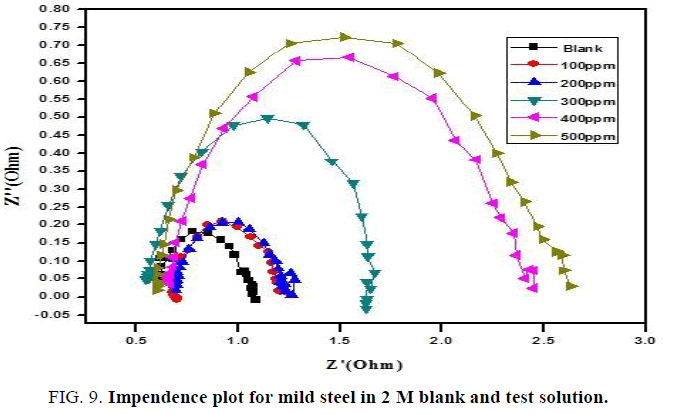
Electrochemical impedance measurements: Perfect semicircle appearance of Nyquist representation indicates the resistivity against corrosion and also reflect single charge transfer process [29]. The increase in size of loop with increase in concentration of composite in the (FIG. 8 and 9) discloses that the composite gets adsorbed over the metal surface and prevent the flow of corrosion current and thereby act as a good inhibitor in strong acidic environment. The relationship reported earlier [27] is used to calculate the IE values.

The increase in Rct values display that the inhibitor forms a protective film at the electrolyte/metal interface [30]. Decrease in Cdl values exhibit that the electrical double layer thickness formed increases with the more addition of composite (TABLES 5 and 6).
| Conc. of composite (ppm) |
Rs (Ω) | Cdl (μ F cm-2) | Rct (Ω cm2) | Inhibition efficiency (%) | Surface Coverage (θ) |
|
|---|---|---|---|---|---|---|
| Blank | 0.9997 | 542 | 0.7675 | -- | -- | |
| 100 | 1.0490 | 552 | 1.051 | 27 | 0.2697 | |
| 200 | 1.0940 | 501 | 1.226 | 37 | 0.3738 | |
| 300 | 1.1540 | 552 | 1.275 | 40 | 0.2981 | |
| 400 | 1.0450 | 383 | 2.901 | 73 | 0.7354 | |
| 500 | 0.9898 | 320 | 3.846 | 80 | 0.8024 | |
Table 5: . Impedance parameters for mild Steel in 1 M blank and test solution.
| Conc. of composite (ppm) |
Rs (Ω) | Cdl (μ F cm-2) | Rct (Ω cm2) | Inhibition efficiency (%) | Surface coverage (θ) |
|---|---|---|---|---|---|
| Blank | 0.6058 | 850 | 0.4927 | -- | -- |
| 100 | 0.6994 | 887 | 0.5680 | 13 | 0.1325 |
| 200 | 0.6950 | 721 | 0.6015 | 18 | 0.1809 |
| 300 | 0.5549 | 594 | 1.0080 | 51 | 0.5112 |
| 400 | 0.6930 | 705 | 1.8660 | 75 | 0.7490 |
| 500 | 0.6479 | 538 | 2.040 | 76 | 0.7585 |
Table 6: Impedance parameters for mild steel in 2 M blank and test solution.
Conclusion
The universal solvent soluble, polymer coated metal oxide composite synthesized exhibit good protection efficiency upto 80% even in strong 2 M acidic condition and is also stable for more than three hours under corrosive environment. Similar increasing trend of protection efficiency with respect to the concentration of composite noticed in gravimetric method, OCP measurements and electrochemical studies implies that the water-soluble material can act as good safeguarding agent during industrial cleaning process.
Acknowledgement
The authors acknowledge the support from Dr. B.V., Dean for Research, SRM group of institutions, Dr. C. Jayaprabha, Associate Professor of Chemistry, University college of Engineering (Anna University) Dindigul-624622 and the Management of Rajalakshmi Engineering college, Chennai for the electrochemical analysis of samples on free of cost. This research did not receive any specific grant from funding agencies in the public, commercial or not for profit sectors.
References
- Verma C, Olasunkanmi LO, Ebenso EE, et al. Adsorption behavior of glucosamine-based, pyrimidine-fused heterocycles as green corrosion inhibitors for mild steel: experimental and theoretical studies. J Phy Chem C. 2016;120(21):11598-611.
- Gupta NK, Joshi PG, Srivastava V, et al. Chitosan: A macromolecule as green corrosion inhibitor for mild steel in sulfamic acid useful for sugar industry. Int J Biol Macromol. 2018;106:704-11.
- Goyal M, Kumar S, Bahadur I, et al. Organic corrosion inhibitors for industrial cleaning of ferrous and non-ferrous metals in acidic solutions: A review. J Mol Liq. 2018.
- Yadav M, Sharma U, Yadav P. Corrosion inhibitive properties of some new isatin derivatives on corrosion of N80 steel in 15% HCl. Int J Ind Chem. 2013;4(1):6.
- Zhang S, Li HJ, Wang L, et al. New pyrazine derivatives as efficient inhibitors on mild steel corrosion in hydrochloric medium. Chem Eng Transac. 2016;55:289-94.
- Kilinççeker G, Çelik S. Electrochemical adsorption properties and inhibition of copper corrosion in chloride solutions by ascorbic acid: experimental and theoretical investigation. Ionics. 2013;19(11):1655-62.
- Castilla CM. Adsorption of organic molecules from aqueous solutions on carbon materials. Carbon. 2004;42:83-94.
- El-Hajjaji F, Belghiti ME, Hammouti B, et al. Adsorption and corrosion inhibition effect of 2-Mercaptobenzimidazole (surfactant) on a carbon steel surface in an acidic medium: Experimental and Monte Carlo simulations. Portugaliae Electrochimica Acta. 2018;36(3):197-212.
- Awuzie CI. Conducting polymers. Materials Today: Proceedings. 2017;4:5721-6.
- Chauhan AK, Gupta SK, Taguchi D, et al. Enhancement of the carrier mobility of conducting polymers by formation of their graphene composites. RSC Advances. 2017;7(20):11913-20.
- Deshpande PP, Jadhav NG, Gelling VJ, et al. Conducting polymers for corrosion protection: A review. Journal of Coatings Technology and Research. 2014;11(4):473-94.
- Deshpande PP, Vagge ST, Jagtap SP, et al. Conducting polyaniline-based paints on low carbon steel for corrosion protection. Protection of Metals and Physical Chem Surfaces. 2012;48(3):356-60.
- Fang J, Xu K, Zhu L, et al. A study on mechanism of corrosion protection of polyaniline coating and its failure. Corrosion Sci. 2007;49(11):4232-42.
- Xu J, Gao L, Cao J, et al. Electrochemical capacitance of nickel oxide nanotubes synthesized in anodic aluminum oxide templates. J Solid State Electrochem. 2011;15(9):2005-11.
- Yoshimura K, Miki T, Tanemura S. Nickel oxide electrochromic thin films prepared by reactive DC magnetron sputtering. Japanese J App Phy. 1995;34(5R):2440.
- Liu F, Sang Y, Ma H, et al. Nickel oxide as an effective catalyst for catalytic combustion of methane. Journal of Natural Gas Science and Engineering. 2017;41:1-6.
- Daniel Lu, Wong CP. Electrically conductive adhesives (ECAs). Materials for Advanced Packaging. 2016;pp:421-68.
- Beresnev SM, Kuzin BL, Bronin DI. Nickel-cermet anode for fuel cells with the LSGM electrolyte. Russian J Electrochem. 2007;43(8):883-7.
- Sharanabasamma MA, Hajeebaba KI, Manjula VT. Characterization and electrical properties of polyaniline/nickel oxide nanocomposites. Int J Eng Res. 2016;5:119-22.
- Sivakumar S, Selvaraj KP, Selvaraj S. Inhibition property of water soluble Sr (ZnZr)1Fe10O19-PANI composite against Strong acidic condition for Mild Steel. Asian J Chem. 2016.
- Cai X, Cui X, Zu L, et al. Ultra high electrical performance of nano nickel oxide and polyaniline composite. Polymer. 2017;9:288.
- Kalyane S, Khadke UV. AC conductivity of polyaniline/mixed metaloxide (Pani/NiCoFe2O3) composites. Int J Pure and App Phy. 2017;13:201-9.
- Husain J, Sridhar BC, Ambika Prasad MVN. Synthesis, sensing and magnetic properties of polyaniline/nickel oxide nanocomposites. Int J Adv of Eng Technol. 2014;7:620-6.
- Ali SKA, Saeed MT, Rahman SU. The isoxazollidines: A new class of corrosion inhibitors of mild steel in acidic medium. Corrosion Sci. 2003;45:253-66.
- Wessling B, Posdorfer J. Corrosion prevention with an organic metal (polyaniline): Corrosion test results. Electrochim Acta. 1999;44:2139.
- Sathiyanarayanan S, Syed Azin S, Venkatachari G. A new corrosion protection coating with Polyaniline-TiO2 composite for steel. Electrochimica Acta. 2007;52:2068-74.
- Jafari Y, Ghoreishi SM, Nooshabadi MS. Electrochemical deposition and characterization of polyaniline-graphene nanocomposite films and its corrosion protection properties. J Polym Res. 2016;23:91.
- Mansfeld F, Kendig MW, Tsai S. Recording and Analysis of AC Impedance Data for Corrosion Studies. Corrosion. 1982;38(11):570-80.
- Qiang Y, Zhang S, Xu S, et al. Experimental and theoretical studies on the corrosion inhibition of copper by two indazole derivatives in 3.0% NaCl solution. J Colloid and Interf Sci. 2016;472:52-9.
- Olasunkanmi L, Obot IB, Kabanda MM, et al. Some Quinoxalin-6-yl derivatives as corrosion inhibitors for mild steel in hydrochloric acid: Experimental and theoretical studies. J Phys Chem. 2015;119:1604-19.
