Original Article
, Volume: 16( 2) DOI: 10.21767/0972-768X.1000266Modeling Using the Response Surface Methodology the Activation Process of Moroccan Oil Shale for Removal of Cd (II)
- *Correspondence:
- Nawal Elhammoudi , Department of Chemistry, Laboratory of Engineering and Materials LIMAT, University Hassan II de Casablanca, Casablanca 20000, Morocco, Tel:+212660365877; E-mail: nawal.elhammoudi@gmail.com
Received: April 09, 2018; Accepted: May 12, 2018; Published: May 15, 2018
Citation: Elhammoudi N, Oumam M, Mansouri S, et al. Modeling Using the Response Surface Methodology the Activation Process of Moroccan Oil Shale for Removal of Cd (II). Int J Chem Sci. 2018;16(2):266
Abstract
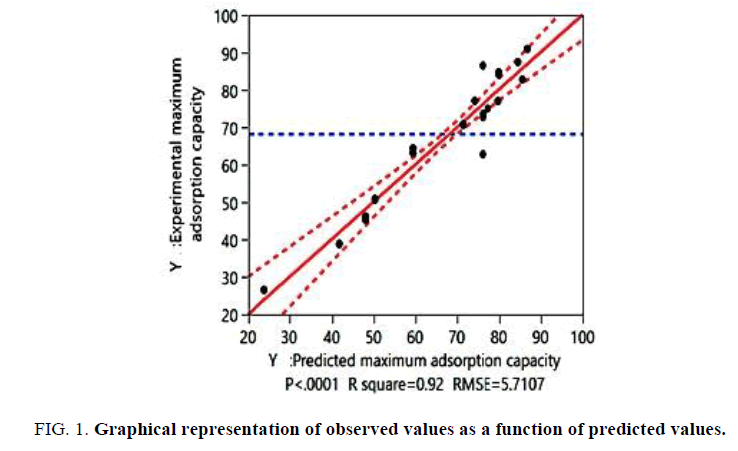
This study for the first time designed to modeling and optimize of activation process for removal of cadmium (II) ions by adsorption on Moroccan oil shale using the response surface methodology. The optimal activation parameters selection was carried out on the basis of three factors by central composite design (CCD). The factors that have been identified are: activation temperature, activation time and massic ratio (mH2SO4/mYC). The capacity of adsorption of the Cd (II), was chosen as a response. The measured parameters were found in accordance with the predicted values with a coefficient of determination (R2) of 0.92. The model has been confirmed by experimental tests to validate the results obtained. Based on the equation of the model and the desirability function, the activation temperature and activation time significantly effect of the adsorption capacity of Cd (II) ions. According to optimal activation conditions obtained using prediction profiler, the powder of oil shale mixed with H2SO4 at 213.8°C during 30 min in a ratio of 1.76, the adsorption capacity of Cd (II) ions is 68.38 (mg/g), the specific BET surface area of activated oil shale equal to 181.35 (m2/g).
Keywords
Modeling; Activation process; Moroccan oil shale; Adsorption; Cd (II); Response surface methodology
Introduction
Industrial wastewater containing cadmium is a threat to public health, due to its accumulation in aquatic life. It is a heavy metal of considerable toxicity with a destructive effect on most organ systems, this pollutant originating from the metallurgical alloying, industrial operations. The principal sources of contamination are welding contaminated food and beverages [1].
Experimental
The conventional processes for removing cadmium from aqueous solution include chemical precipitation, ion exchange, membranes and adsorption technologies [2]. Among these different physicochemical processes, adsorption has shown to be the best prospects owing to its economic feasibility [3]. Today the oil shale has received increasing interest in the removal of heavy metals. The oil shale is a sedimentary rock contained the organic and the mineral matter [4]; it is essentially an immature form of petroleum. Morocco has a great resource of the oil shale. The deposits that have been explored are the Timahdit and Tarfaya deposits, the Timahdit deposit is located about 250 kilometers southeast of rabat. The average sulfur content is two percent [5]. The deposits that have been strongly explored are the Timahdit and Tarfaya deposits. The total content from Moroccan oil shale is evaluated 86 billion tons [6]. The objective of the present study is to optimize and modeling of activation conditions of oil shale for removal of cadmium (II) ions using response surface methodology. The response surface methodology is one of statistical method to optimize of the parameters and reducing the number of experimental trials [7]. The initial step in planning the response surface design was to determine the activation parameters that have an influence on the removal of cadmium (II) ions [8]. The second step was the modeling of the response; it consists of selecting the appropriate plan and validating the model. For this reason, we employed a central composite design, to optimize of activation conditions of oil shale for removal of cadmium (II) ions. The final step was the optimization of the conditions for the working of the activation process [9]. The factors studied including, the activation temperature (X1), activation time (X2) and massic ratio (X3). The response measured, it is the adsorption capacity of Cd (II) ions: Qads(mg/g). The oil shale is composed of the organic and the mineral material essentially formed by calcite, dolomite, silicate and clay. The choice of the Moroccan oil shale for this application was eluted by two factors, the estimated reserve and its composition rich in organic matter constituted a carbon source.
Preparation of the activated oil shale
The oil shale (Y) is crushed then ground until we get a fine powder [10]. At a mass of the oil shale was leached with hydrochloric acid, to obtain the concentrated oil shale to be named (YC). The precursor (YC) was mixed with different ratio (mH2SO4/mYC) of the sulfuric acid. The mixture was heated in electric furnace under oxidant atmosphere gaze at different temperatures, after preprocessing at 140°C in oven under air. The product obtained (YCS) is thoroughly washed with distilled water in a soxhlet apparatus, to remove excess sulfuric acid (H2SO4) and to extract any soluble material, and then to dry at 80°C.
Experimental response
The measured response in this study was the adsorption capacity of Cd (II) ions. The removal of cadmium (II) ions on the activated oil shale (YCS) has been realized on the synthetic solution from cadmium chloride CdCl2. A solution of Cd (II) ions of concentration 20 mg/L was prepared by dissolving 32.62 mg of cadmium chloride CdCl2 in a 1000 mL. The pH of solution from cadmium chloride CdCl2 was adjusted with 0.1 N HCl or 0.1 N NaOH. In each adsorption test, 200 ml of cadmium solution of 20 mg/L was mixed with a 20 mg mass of activated oil shale (YCS), and then the mixture is stirred for 24 hours. The equilibrium concentration in Cd (II) ions was determined by atomic absorption spectroscopy (AAS), the quantity of Cd (II) ions adsorbed per unit mass of the activated oil shale (YCS) was calculated using the following form of eqn. (1):
Qads ((mg/g))=((C0-Ce)*V)/mYCS (1)
Where Qads is the adsorption capacity of Cd (II) ions (mg/g), V: volume of the solution of Cd (II) ions (L), C0: initial concentration of Cd (II) ions (mg/L), Ce: equilibrium concentration of Cd (II) ions (mg/L) and mYCS: mass of the activated oil shale (g).
Response surface methodology
Response surface methodology is a combination of mathematical and statistical techniques used to develop and optimize processes and to determine the relative significance and interaction of all variables, response surface methodology step followed by determination of the optimal region [11]. One of the most popular response surface methods is the Central Composite Design (CCD). The CCD was used to examine the influence of the activation parameters on the response [12,13]. In the central composite design step, experiments were randomly planned to minimize the effect of uncontrolled variables as shown in TABLE 1.
| Factors | Levels | ||
|---|---|---|---|
| Low (-1) | Central (0) | High (+1) | |
| (X1) | 160°C | 210°C | 260°C |
| (X2) | 15 min | 30 min | 45 min |
| (X3) | 1.5 | 2 | 2.5 |
Table 1: Experimental factors and levels in the central composite design.
A central composite design was used to determine the pertinence of the three factors: the activation temperature (X1), activation time (X2) and massic ratio (X3). The first step of this study is the choice of appropriate plan that suits us ideas to optimize the experimental conditions [14]. We have chosen to work with the composite plan on three factors with three levels. The chosen allows studying the influence of these factors on response. The plan consists of three parts: factorial design helps in optimizing the activation parameters [15], whose factors are two levels -1 and+1, experimental point in the center of the study area 0 and axial points on the axes of each factor. For three variables (n=3) and two levels (low (-) and high (+)), the total number of experiments was 16 determined by the expression: (2n (23TABLE 2=8: full factor points)+2n (2*3=6: axial points)+2 (center points)) (TABLE 2). The response measured was the adsorption capacity of Cd (II) ions, the design consisted of 16 experiments point carried out in random order. The suggested model for the quadratic model of the response variable, according to the independent variables [16], the mathematical relationship between the independent variables can be approximated by the second order polynomial model (eqn. 2):
R=a0+a1X1+a2X2+a3X3+a11X12+a22X22+a33X32+a12X1X2+a13X1X3+a23X2X3 (2)
| Matrix of the coded factors | Matrix of the reels factors | Comment | Experimental value of Qads |
1 | -1 | -1 | -1 | 160 | 15 | 1.5 | Full factorial | 75.1 |
|---|---|---|---|---|---|---|---|---|
| 2 | 1 | -1 | -1 | 260 | 15 | 1.5 | Full factorial | 63.12 |
| 3 | -1 | 1 | -1 | 160 | 45 | 1.5 | Full factorial | 50.61 |
| 4 | 1 | 1 | -1 | 260 | 45 | 1.5 | Full factorial | 62.74 |
| 5 | -1 | -1 | 1 | 160 | 15 | 2.5 | Full factorial | 76.99 |
| 6 | 1 | -1 | 1 | 260 | 15 | 2.5 | Full factorial | 72.69 |
| 7 | -1 | 1 | 1 | 160 | 45 | 2.5 | Full factorial | 62.74 |
| 8 | 1 | 1 | 1 | 260 | 45 | 2.5 | Full factorial | 16.52 |
| 9 | 0 | 0 | -1 | 210 | 30 | 1.5 | Axial point | 62.73 |
| 10 | 1 | 0 | 0 | 260 | 30 | 2 | Axial point | 62.74 |
| 11 | 0 | 1 | 0 | 210 | 45 | 2 | Axial point | 45.23 |
| 12 | 0 | 0 | 1 | 210 | 30 | 2.5 | Axial point | 38.68 |
| 13 | 0 | -1 | 0 | 210 | 15 | 2 | Axial point | 90.91 |
| 14 | -1 | 0 | 0 | 160 | 30 | 2 | Axial point | 82.74 |
| 15 | 0 | 0 | 0 | 210 | 30 | 2 | Center point | 98.61 |
| 16 | 0 | 0 | 0 | 210 | 30 | 2 | Center point | 87.41 |
Table 2: Experimental design in coded and reels variables for central composite design.
Where R is the predicted response: adsorption capacity of Cd (II) ions. Xis are the independent variables, (Activation temperature (X1), activation time (X2) and massic ratio (X3)), the parameter a0 is the model constant, a1, a2, a3 are the linear coefficients, a11, a22 and a33 are the quadratic coefficients and a12, a13 and a23 are the interaction effect [17]. The modeling is performed adjusting polynomial equation obtained by analysis of variance (ANOVA) [18].
Each experiment was repeated three times.
Results and Discussion
Acid attack of oil shale
The powder of oil shale (Y-layer) was added, with stirring a solution of hydrochloric acid HCl (1 mol/L) until the complete release of carbon dioxide, according to the following equations.

Activation process of oil shale
Activation processes can be classified into physical and chemical activation. During physical activation, the oil shale may undergo gasification produced during carbonization [19,20]. On the other hand, chemical activation consists of impregnating with chemicals such as ZnCl2, H3PO4, HNO3 or H2SO4 [21,22]. The concentrated oil shale (YC) was activated by sulfuric acid H2SO4 at the temperature 300°C for 1 hour. The product obtained, referenced by (YCS) where "S" denotes the activation with sulfuric acid H2SO4. The activation with sulfuric acid H2SO4 has become a widespread method for the manufacture of activated carbon. The use of sulfuric acid (H2SO4) has some environmental advantages such as easy recovery, low energy cost, plays two roles during the preparation of activated oil shale (YCS), acts as an acid catalyst to promote bond cleavage, dehydration, and may function as a template because the volume occupied by sulfuric acid in the interior of the activated is coincident with the micropore volume of the activated oil shale obtained [23].
Optimization using the response surface methodology
The variables studied are: the activation temperature (X1), activation time (X2) and massic ratio (X3) and the measured response was the adsorption capacity of Cd (II) ions (Qads(mg/g)). After choosing the response and the variables, we have sought to optimize and modeling of the activation process for removal of Cd (II) ions by oil shale using the response surface methodology. The central composite design to three levels was conducted to evaluate the influence of experimental factors on the adsorption capacity of Cd (II) ions. We realized an adsorption test of the 16 experiments. The experimental data have been reproduced three times to evaluate the statistical quality of the results (TABLE 2).
Evaluation of the quality of the model
The coefficient of adjusted regression R2 for the adsorption capacity was equal to 0.92. This indicated that more than 92% of the variation observed was explained by the direct effects of the factors. Therefore, the choice of quadratic model to modeling of activation process was best. The result of this test is shown in FIG. 1 and TABLE 3.
| Variable studied | Adsorption capacity of Cd (II) | |
|---|---|---|
| Regression analysis | R square (R2) | 0.92 |
| Adjusted R square (RA2) | 0.91 | |
| ANOVA test | F value | 50.82 |
| p-value | <.0001* | |
| Validation model | F value | 3.101 |
| p-value | <.0001* |
* Significant at the level 95%.
Table 3: Quality of quadratic model chosen to model the activation conditions for removal of Cd (II) ions.
Test of variance (ANOVA)
The validation quadratic model for the removal of Cd (II) ions on activated oil shale (YCS) was performed using the model analysis of variance (ANOVA) and the method of the absence of adjustment analysis, also called analysis bias. ANOVA was used to assess the variance of the model established in relation to the variance of the residue, using the test "Fisher Snedecor", the result was considered significant if (Fexp >> Fα, νmod, νres), where α=0.05. According to the result of ANOVA test, analysis of experimental give a factor Fexp=50.82. The theoretical values determined according to the table of Fisher Snedecor (for νmodel=9, νresidue=38 and confidence level=95%) was Fα, νmod, νres=F 0.05, 9, 38=2.19. This theoretical factor was much lower than the experimental factor, Fexp=50.82 >> Ftheo=2.19. The results of the lack of adjustment of analysis indicate that the p-value was largely experimental factor less than 0.05, these analyses were determined using the JMP12 software, shown in TABLE 3. The results of ANOVA test and the lack of adjustment showed that the quadratic model established was validated.
Equation of the model
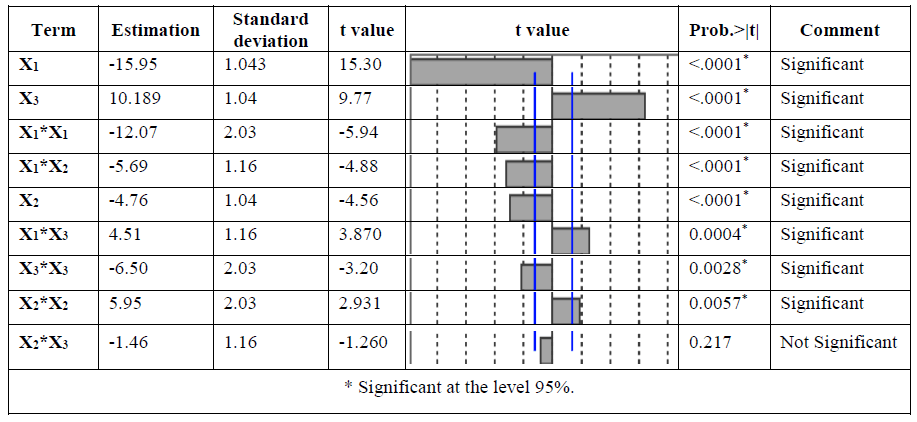
The significance of each coefficient was determined using the F-test and p-value given by JMP 12 software. A p-value less than 0.05 indicate the significance of an effect at 95% confidence level [24]. The significant effects and their coefficients are shown in TABLE 4. The effects coefficients of model showed that the adsorption capacity of Cd (II) ions was significantly affected by the quadratic term of activation temperature (X1) and massic ratio (X3), the antagonistic effect of activation time and massic ratio (X23), was not significantly, p-value larger than 0.05, we can neglect this coefficient from the equation of the adsorption capacity of Cd (II) ions. The fitted quadratic model for removal of Cd (II) ions given by eqn. (3).
Qads (mg/g)=76.15–15.95*X1–4.76*X2+10.19*X3–5.69 *X12+4.51*X13–12.07*X12+5.95*X22 – 6.50*X32 (3)
Desirability function
After validation of the quadratic model, the optimal conditions of the activation process for removal of Cd (II) ions by oil shale were determined using the desirability function. The function of desirability established to discover the optimal conditions based globally on the function of the desirability of Derringer [25]. The main advantage of the function of desirability is the ability to obtain answers by a simple processing and rapid response.
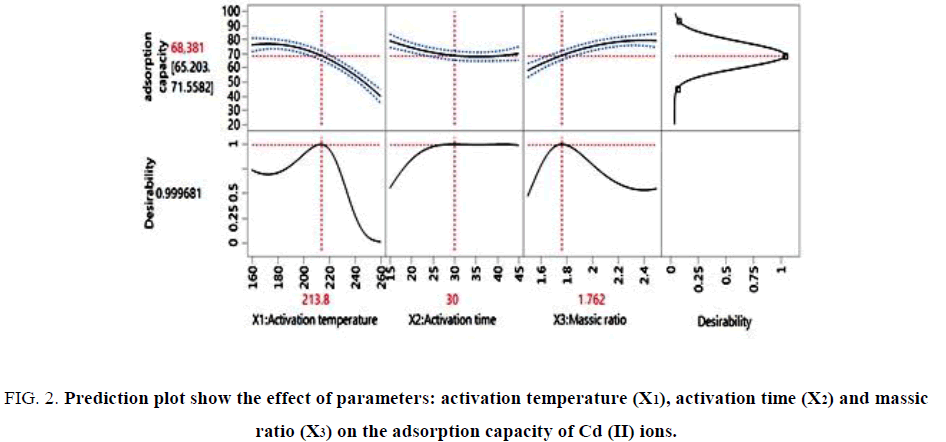
First and foremost, the response is converted to a function of a particular desirability in the range of 0-1. The value equal to 0 shows a minimum applicability [26]. The prediction plot showing the effects of various parameters, the factors that appear to be more influential are the activation temperature and activation time, allows to conclude that its factors affect the response Qads(mg/g). It is clear that an increase of the activation temperature and activation time causes an increase in the adsorption capacity of the activated oil shale (YCS).
The optimal condition determined using JMP 12 Software was represented in FIG. 2. On the other hand, the result indicated the highest adsorption capacity of Cd (II) ions of 68.381 mg/g was obtained to 213.8°C, during 30 min with 1.76 of massic ratio. Depending on the results presented in FIG. 2, we can conclude that the desirability function permitted to reduce activation temperature, activation time and massic ratio (mH2SO4/mYC) for a high adsorption capacity.
Figure 2: Prediction plot show the effect of parameters: activation temperature (X1), activation time (X2) and massic ratio (X3) on the adsorption capacity of Cd (II) ions.
Experimental validation
To confirm the quality of the results determined by experimental data, experimental tests have been realized to validate the results obtained. The values of the confirmation experiment trials present the same values compared to the optimal conditions for removal of Cd (II) ions on activated oil shale (YCS) obtained using the response surface methodology, no significant difference was observed between the experimental and predicted values, the results of this test are presented in the TABLE 5.
| Response | Activation conditions | Experimental results | Result of (RSM) |
|---|---|---|---|
| Adsorption capacity of Cd (II) ions (mg g-1) | (X1)=213.8°C; (X2)=30 min; (X3)=1.76 | 68.73 ± 0.96 | 68.38 |
| (X1)=160°C; (X2)=25 min; (X3)=1.5 | 66.58 ± 1.77 | 67.71 | |
| (X1)=200°C; (X2)=40 min ; (X3)=1.7 | 68.37 ± 0.24 | 70.94 |
Table 5: Confirmation experiment of optimal activation process for removal of Cd (II) ions.
N2 adsorption-desorption
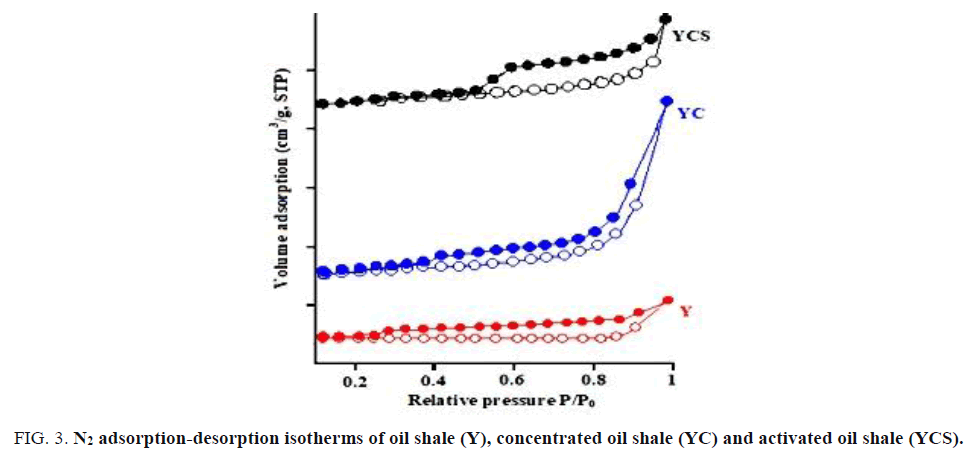
The surface area of the oil shale (Y), concentrated oil shale (YC) and activated oil shale (YCS) are obtained by the BET method (N2 adsorption in gaseous phase). The Nitrogen adsorption and desorption isotherms of the precursors are given in FIG. 3 and TABLE 6 respectively.
Figure 3: N2 adsorption-desorption isotherms of oil shale (Y), concentrated oil shale (YC) and activated oil shale (YCS).
| Sample | Y | YC | YCS |
|---|---|---|---|
| SBET(m2/g) | 7.14 | 23.92 | 181.35 |
Table 6: Specific surface obtained by the BET method.
The BET surface area of the (Y), (YC) and (YCS) materials were calculated and found to be 7.14 m2/g, 23.92 m2/g and 181.35 m2/g respectively. The results of analyzes specific surface SBET are summarized in TABLE 6. This table shows that the total surface area of the activated oil shale (YCS) is higher than that obtained by the two precursors (YC) and (Y) which allows that chemical activation with sulfuric acid causes an increase in the surface.
SEM analysis
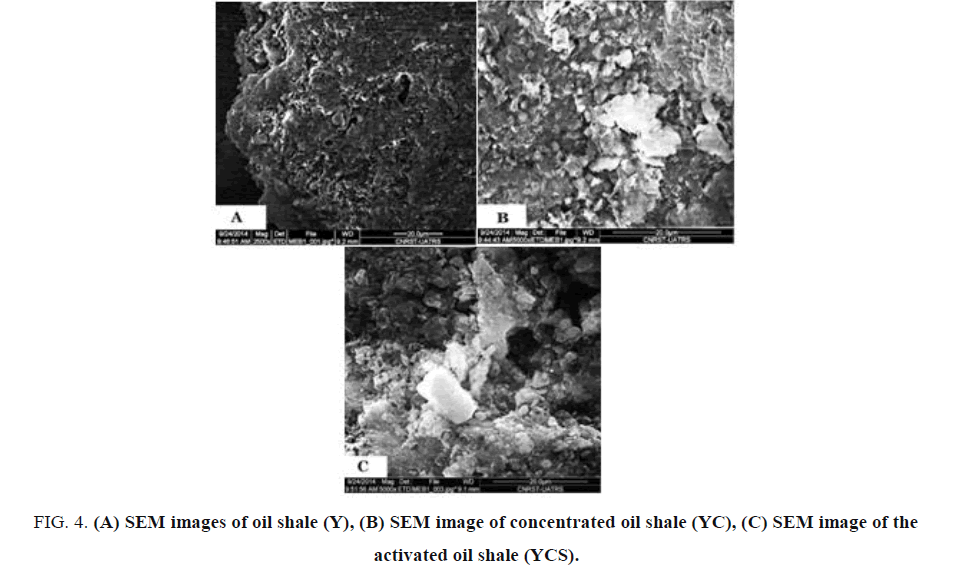
The scanning electron microscopy (SEM) was carried out for the activated oil shale (YCS) before and after activation in order to evaluate changes on their microstructures. The SEM analysis was executed in the Centre National de Recherche Scientifique et Technique (CNRST). As can be observed in FIG. 4, the rock of oil shale (Y) untreated and the concentrated oil shale (YC) present a rigid and very compact morphology, without any apparent porous structure, while the activated oil shale (YCS) has a porosity much developed compared to the rock of oil shale (Y) of departure where the grains are not consistent with the virtual absence of porosity. The SEM image of activated oil shale (YCS) clearly indicates surface alterations when compared to the rock of oil shale (Y) and the concentrated oil shale (YC), which may be due to oxidation of the organic matter existing in the (YC). The SEM photograph of the activated oil shale (YCS), demonstrate the catalytic role of the sulfuric acid in the chemical activation of oil shale and the development of microstructure.
Figure 4: (A) SEM images of oil shale (Y), (B) SEM image of concentrated oil shale (YC), (C) SEM image of the activated oil shale (YCS).
Conclusion
The activation conditions for removal of Cd (II) ions by oil shale were modeling and optimized using the response surface methodology under central composite design. The activated oil shale (YCS) was successfully prepared using a simple, low cost and highly efficient activation process. Under optimal activation conditions, the oil shale sample mixed with H2SO4 at 213.8°C during 30 min in a massic ratio of 1.76. The adsorption capacity of Cd (II) ions was 68.38 mg/g.
Acknowledgments
I have taken efforts in this project. However, it would not have been possible without the kind support and help of many individuals of the Laboratory of Engineering and Materials (LIMAT) and organizations of the Agence Universitaire de la Francophonie (AUF) for support of this work. I would like to extend my sincere thanks to all of them.
References
- Mohapatra M, Anand S, Mishra BK, et al. Review of fluoride removal from drinking water. J Environ Manage. 2009;91(1):67-77.
- Tan G, Yuan H, Liu Y, et al. Removal of lead from aqueous solution with native and chemically modified corncobs. J Hazard Mater. 2010;174(1-3):740-45.
- Tan IAW, Chan JC, Hameed BH, et al. Adsorption behavior of cadmium ions onto phosphoric acid-impregnated microwave-induced mesoporous activated carbon. J Water Process Eng. 2016;14:60-70.
- Knaus E, Killen J, Biglarbigi K, et al. An overview of oil shale resources. In: ACS Symposium Series. 1032;2010:3-20.
- Elhammoudi N, Oumam M, Mansouri S, et al. Preparation and development of a novel activated carbon based on moroccan oil shale using activation process. Am J of Chem. 2017;7(5):163-70.
- Goupy JL. Etude comparative de divers plans d?expériences. Revue de statistique appliquée. 1990;38(4):5-44.
- Rao KM, Subbarao GVR. Optimum fly ash for mechanical stabilization of expansive soils using 2 2 factorial experimental design. Natural Hazards. 2012;60(2):703-13.
- Tinsson W. La notion de plan d?expérience. In: Plans D?expérience: Constructions et Analyses Statistiques; 2010:3-37.
- Kribii A, Lemée L, Chaouch A, et al. Structural study of the Moroccan Timahdit (Y-layer) oil shale kerogen using chemical degradations. Fuel. 2001;80(5):681-91.
- Elharti M, Legrouri K, Khouya E, et al. Preparation of adsorbent material from Moroccan oil shele of Timahdit: Optimization of parameters processes and adsorption tests. Der Pharma Chem. 2012;4(5):2130-9.
- Roosta M, Ghaedi M, Daneshfar A, et al. Optimization of combined ultrasonic assisted/tin sulfide nanoparticle loaded on activated carbon removal of erythrosine by response surface methodology. J Ind Eng Chem. 2015;21:459-69.
- Alansi AM, Al-Qunaibit M, Alade IO, et al. Visible-light responsive BiOBr nanoparticles loaded on reduced graphene oxide for photocatalytic degradation of dye. J Mol Liq. 2018;253:297-304.
- Saeed MO, Azizli K, Isa MH, et al. Application of CCD in RSM to obtain optimize treatment of POME using Fenton oxidation process. J Water Process Eng. 2015;8:e7-e16.
- Ahmad MA, Afandi NS, Bello OS. Optimization of process variables by response surface methodology for malachite green dye removal using lime peel activated carbon. Appl Water Sci. 2015;pp:1-11.
- Tuzen M, Sari A, Saleh TA. Response surface optimization, kinetic and thermodynamic studies for effective removal of rhodamine B by magnetic AC/CeO2 nanocomposite. J Environ Manage. 2018;206:170-177.
- Asadollahzadeh M, Tavakoli H, Torab-Mostaedi M, et al. Response surface methodology based on central composite design as a chemometric tool for optimization of dispersive-solidification liquid-liquid microextraction for speciation of inorganic arsenic in environmental water samples. Talanta. 2014;123:25-31.
- Elatharasan G, Kumar VSS. Modelling and optimization of friction stir welding parameters for dissimilar aluminium alloys using RSM. Procedia Eng. 2012;38:3477-81.
- Sahu JN, Acharya J, Sahoo BK, et al. Optimization of lead (II) sorption potential using developed activated carbon from tamarind wood with chemical activation by zinc chloride. Desalination and Water Treatment. 2016;57(5):2006-17.
- Aboulkas A, Harfi K E. Study of the kinetics and mechanisms of thermal decomposition of Moroccan Tarfaya oil shale and its kerogen. In: Oil Shale. 2008;25:426-43.
- Li H, Sun Z, Zhang L, et al. A cost-effective porous carbon derived from pomelo peel for the removal of methyl orange from aqueous solution. Colloids Surfaces A Physicochem Eng Asp. 2016;489:191-9.
- Namane A, Mekarzia A, Benrachedi K, et al. Determination of the adsorption capacity of activated carbon made from coffee grounds by chemical activation with ZnCl2 and H3PO4. J Hazard Mater. 2005;119(1-3):189-94.
- Mui ELK, Cheung WH, Valix M, et al. Activated carbons from bamboo scaffolding using acid activation. Sep Purif Technol. 2010;74(2):213-8.
- Myers RH, Montgomery DC, Anderson-Cook C. Response surface methodology: Process and product optimization using designed experiments. Wiley Ser Probab Stat. 2009;pp:704.
- Khuri AI, Mukhopadhyay S. Response surface methodology. Wiley Interdiscip Rev Comput Stat. 2010;2(2):128-49.
- He Z, Zhu PF, Park SH. A robust desirability function method for multi-response surface optimization considering model uncertainty. Eur J Oper Res. 2012;221(1):241-7.
- Gadhe A, Sonawane SS, Varma MN. Optimization of conditions for hydrogen production from complex dairy wastewater by anaerobic sludge using desirability function approach. Int J Hydrogen Energy. 2013;38(16):6607-17.
