Original Article
, Volume: 13( 6)Knowledge, Handling Behavior Affecting to Food Safety of Industrial Kitchen Handlers
- *Correspondence:
- Nguyen Phuoc Minh Faculty of Food Technology, Department of Biotechnology, Dong A University, Da Nang City, Vietnam
Tel: +82 51-200-6114; E-mail: minhnp@donga.edu.vn
Received Date: December 11, 2017 Accepted Date: December 29, 2017 Published Date: December 29, 2017
Citation:Minh NP. Knowledge, Handling Behavior Affecting to Food Safety of Industrial Kitchen Handlers. Biotechnol Ind J. 2017;13(6):157.
Abstract
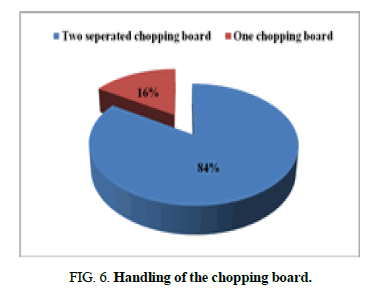
Worldwide, food-borne diseases are a major health burden leading to high morbidity and mortality. Our research focused on safe food handling knowledge and behaviors among industrial kitchen handlers. We described one research mentioned to the description of handling knowledge, behavior about food safety awareness of industrial kitchen handlers (IKHs). Our results demonstrated that most of IKHs were lack of general handling knowledge about food safety. About knowledge, there were 21.5% of IKHs without knowledge of egg selection; 60% of IKH without knowledge of cross-contamination during processing. About handling, there were 20.4% IKHs without awareness of product label data; 65% of IKHs without handling behavior of washing vegetable under running water tap; 16.0% of IKHs used the same chopping board without any separation between raw and cooked products.
Keywords
Knowledge; Handling; Food safety; Behavior; Industrial kitchen handler
Introduction
Food poisoning is a group of illnesses acquired by consumption of foods contaminated with a variety of causes. Foodborne diseases remain a major public health problem across the globe. The problem is more severe in developing countries because of lack of personal hygiene and food safety measures [1]. The global burden of infectious diarrhoea involves 3-5 billion cases and nearly 1.5 million deaths annually, mainly in young children, due to diarrhoeal disease caused by contaminated food and water. In a global scale addition, diarrhoeal disease has caused 3% mortality. The European Union summarized report on trends and sources of zoonoses, zoonotic agents and food-borne outbreaks in 2015. A total of 4,362 food-borne outbreaks were reported. In 2014, 864 foodborne disease outbreaks were reported in the US, resulting in 13,246 illnesses, 712 hospitalizations, 21 deaths, and 21 food recalls. The pathogenic organisms transmitted through contaminated foods are bacteria, viruses, protozoa and helminths. Foods that are contaminated may not look, taste or smell any different from foods that are safe to eat. Most commonly, the outbreaks take place due to the ingestion of pathogenic bacteria like Salmonella Typhi, Escherichia coli, Staphylococcus aureus, Vibrio cholera, Campylobacter jejuni, and Listeria monocytogenes [2]. Chemical contamination of food may result from various sources. Industrial or agricultural practices such as use of pesticides, fertilizers lead to entry of heavy metals such as cadmium, lead and mercury into the food chain.
Frederick et al. [3] suggested a critical need for action that is focused on preventing disease transmission within the food service industry. The challenges of foodborne pathogens and antimicrobial chemotherapy were shown [4]. Several factors contribute to foodborne illnesses like lack of self-hygiene of food handlers, no clean water supply and unclean environment [5]. Food handlers are the most common source of contamination because they can spread harmful organisms by means of fecal-oral route or skin lesions, as well as unclean kitchen utensils or kitchen counters [6]. Quinlan [7] reviewed the current state of what is known about foodborne illness among, and food safety risks for, minority and low socioeconomic populations, with an emphasis on the United States and Europe. Food safety in low and middle-income countries is also reviewed by Delia Grace [8]. These suggested that developing country consumers are concerned about foodborne disease; that most of the known burden of foodborne disease comes from biological hazards; and most foodborne disease was the result of consumption of fresh, perishable foods sold in informal markets. Foodborne disease was likely to increase in low and middle-income countries as the result of massive increases in the consumption of risky foods (livestock and fish products and produce) and lengthening and broadening value chains.
While foodborne illness is not traditionally tracked by race, ethnicity or income, analyses of reported cases have found increased rates of some foodborne illnesses among minority racial/ethnic populations. We carried out one research about knowledge, handling behavior affecting to food safety of industrial kitchen handlers.
Materials and Methods
Research scope
We focused on a survey of industrial kitchen handlers in the industrial zones located in the South of Vietnam. Samples were the industrial kitchen handlers (IKHs) via interview.

Whereas
n: Minimum sample size.
Z: Reliability of 95% equivalent to α = 0.05  Z = 1.96.
p: Ratio of industrial kitchen handlers having the fail processing practice, 43.6% (p= 0.436)
d: Acceptable difference 6% (d= 0.06).
 n = 262.
So, the minimum sample in this research would be 262. With 10% of reservation by rejection or absence, so the minimum sample size should be 289. However, during the research, several samples (IKHs) were removed owing to absence so the final sample size would be 274.
Research method
Method of sampling: Samples were the industrial kitchen handlers (IKHs) in the factories of industrial zones. Each factory would be selected one industrial kitchen handler for the interview. If there were more than two IKHs, they should be randomly lucky drawed to select one candidate.
Statistical analysis: Data of knowledge and handling of IKHs were collected by interview and observation with the support of an available check list. Time of the interview was about 20 minutes for one industrial kitchen handler. After receiving enough data, we did the statistical analysis by SPSS software version 19.0. Descriptive statistics (frequency, percentage %) was focused on personal characteristics, knowledge, handling of IKHs.
Results and Discussion
General information of IKHs
From Tables 1, 2 and 3, we could see variety of aspects such as age, gender, ethnic, education, career, working time, business type, shopping time and shopping duration relating to handling of IKHs.
| Variables | Description | Frequency (n) | Percentage (%) |
|---|---|---|---|
| Age (age group) (n=274) |
21 – 30 years old | 15 | 5.5 |
| 31 – 40 years old | 70 | 25.5 | |
| 41 – 50 years old | 82 | 29.9 | |
| Over 50 years old | 107 | 39.1 | |
| Gender (n=274) | Male | 22 | 8.0 |
| Female | 252 | 92.0 | |
| Ethnic (n=274) | Vietnamese | 260 | 94.9 |
| Chinese | 6 | 2.2 | |
| Khmer | 8 | 2.9 |
Table 1. Characteristics of age, gender and ethnic.
| Variables | Characteristics | Frequency (n) | Percentage (%) |
|---|---|---|---|
| Education (n=274) |
Illiteracy | 14 | 5.1 |
| Primary school | 130 | 47.4 | |
| Junior high school | 90 | 32.8 | |
| Senior high school | 21 | 7.7 | |
| University | 19 | 6.9 | |
| Background (n=274) |
Officer | 16 | 5.8 |
| House care | 140 | 51.1 | |
| Farmer | 35 | 12.8 | |
| Business | 60 | 21.9 | |
| Others | 23 | 8.4 | |
| Working time as the IKHs (n=274) | Below 5 years | 9 | 3.3 |
| 5 – 10 years | 80 | 29.2 | |
| Over 10 years | 185 | 67.5 |
Table 2. Characteristics of education, career and working time.
| Variables | Characteristics | Frequency (n) | Percentage (%) |
|---|---|---|---|
| Business type of company | Vietnamese local company | 36 | 13.1 |
| Foreign direct investment company | 238 | 86.9 | |
| Shopping time | Morning | 260 | 94.9 |
| Afternoon | 4 | 1.5 | |
| Any time | 10 | 3.6 | |
| Shopping duration | Comfort | 162 | 59.1 |
| Enough | 105 | 38.3 | |
| Not enough | 7 | 2.6 |
Table 3. Characteristics of business type, shopping time and shopping duration.
Food safety knowledge of IKHs
Knowledge of IKHs in selecting and shopping food:
From Table 4, we could see that IKHs selected red bright color 98.2%; while 4.7% didn’t know how to select raw meat.
| Description | Frequency (n) | Percentage (%) |
|---|---|---|
| Red bright color | 269 | 98.2 |
| Sticky | 63 | 23.0 |
| Elasticity | 51 | 18.6 |
| No rancidity | 131 | 47.8 |
| Veterinary check point | 196 | 71.5 |
| No answer | 13 | 4.7 |
Table 4. Knowledge of raw meat selection by vision (n=274).
From Table 5, we could see that IKHs selected live fish 98.5%; while 1.8% didn’t know how to select raw fish.
| Description | Frequency (n) | Percentage (%) |
|---|---|---|
| Live fish | 270 | 98.5 |
| Without losen by handling | 135 | 49.3 |
| Bright eye | 222 | 81.0 |
| Normal abdomen | 117 | 42.7 |
| No strange smell | 24 | 8.8 |
| No answer | 5 | 1.8 |
Table 5. Knowledge of raw fish selection by vision (n=274).
From Table 6, we could see that IKHs selected fresh vegetable 83.9%; while 2.9% didn’t know how to select raw vegetable.
| Description | Frequency (n) | Percentage (%) |
|---|---|---|
| Fresh | 230 | 83.9 |
| Rotten | 81 | 29.6 |
| Clean and without soil or damage | 228 | 83.2 |
| Strange smell | 4 | 1.5 |
| No answer | 8 | 2.9 |
| Others | 5 | 1.8 |
Table 6. Knowledge of raw vegetable selection by vision (n=274).
From Table 7, we could see that IKHs selected clean egg 67.5%; while 21.5% didn’t know how to select raw egg.
| Description | Frequency (n) | Percentage (%) |
|---|---|---|
| Clean egg with chalk on outer shell | 185 | 67.5 |
| No shake | 172 | 62.8 |
| No cracking | 86 | 31.4 |
| Egg screening | 4 | 1.5 |
| No strange smell | 23 | 8.4 |
| No answer | 59 | 21.5 |
Table 7. Knowledge of raw egg selection by vision (n=274).
From Table 8, we could see that IKHs selected edible cooked food 77.7%; while 23.4% didn’t select one. Good personal hygiene accounted for 54.7%, while clean chopping board was 10.2%.
| Variables | Description | Frequency (n) | Percentage (%) |
|---|---|---|---|
| Usually purchase edible cooked (n=274) | Yes | 213 | 77.7 |
| No | 64 | 23.4 | |
| Condition of shopping location (n=274) |
Far from drainage or contaminated location | 145 | 52.9 |
| Having shelf or cabinet | 165 | 60.2 | |
| Having clean chopping board to separate raw and cooked food | 28 | 10.2 | |
| Having clamp | 150 | 54.7 | |
| Good personal hygiene | 150 | 54.7 |
Table 8. Knowledge of shopping location for edible cooked food.
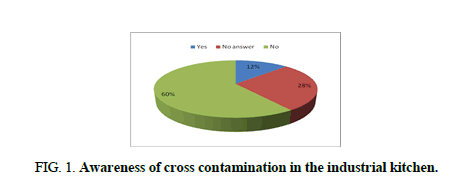
Knowledge of cross contamination in the industrial kitchen: From Figure 1, we saw 28% of IKHs awared of cross contamination. Meanwhile 60% of IKHs believed there would be none of cross contamination and 12% without any answer.
From Table 9, the risk of cross contamination in the industrial kitchen by none well done food or cross contamination between the cooked and raw food accounted for 25.2% and 73.0% without any answer.
| Description | Frequency (n) | Percentage (%) |
|---|---|---|
| Dirty raw material or contaminated tool | 36 | 13.1 |
| None well-done food or cross contamination between the cooked and raw food. | 69 | 25.2 |
| No prevention from dust, insect, fly or dirty hand | 52 | 19.0 |
| Contaminated water source | 22 | 8.0 |
| Toxic additives (color, borat) | 7 | 2.6 |
| No answer | 200 | 73.0 |
Table 9. Reason of cross contamination in the industrial kitchen (n=274).
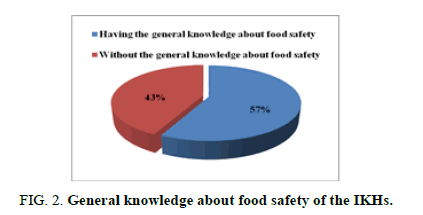
General knowledge about food safety of the IKHs: From Figure 2, there were 57% of the IKHs having the general knowledge about food safety.
Food safety handling of IKHs
Handling of selecting and processing food: From Table 10, we noted that 91.2% of IKHs usually bought canned and packaged food. Meanwhile 20.4% of IKHs didn’t care of information on product label.
| Variables | Description | Frequency (n) | Percentage (%) |
|---|---|---|---|
| Do you usually purchase canned or packed food (n=274) | Yes | 250 | 91.2 |
| No | 24 | 8.8 | |
| Observing information (n=254) | Name and address of processing company | 115 | 42.0 |
| Date | 215 | 78.5 | |
| Usage instruction | 60 | 21.9 | |
| Net weight | 6 | 2.2 | |
| Content | 26 | 9.5 | |
| No answer | 56 | 20.4 |
Table 10. Handling of observation on product label.
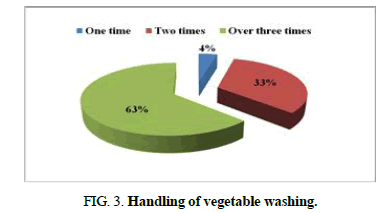
From Figure 3, there were 63% of IKHs washing vegetable in more than three times. Meanwhile, only 4% of IKHs washed vegetable in one time before cooking or eating.
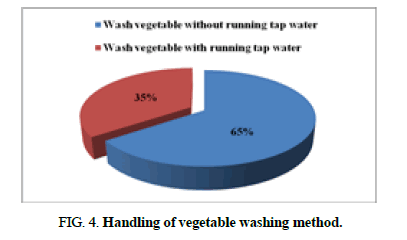
From Figure 4, we realized that 65% of IKHs washed vegetable without running tap water and 35% of IKHs washed vegetable under running tap water.
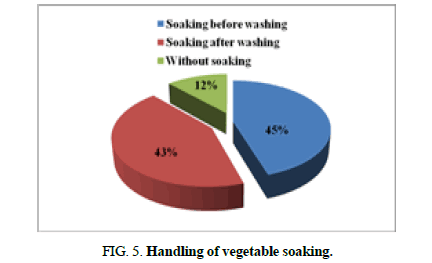
From Figure 5, we clearly noted that 45% of IKHs having habit of soaking vegetable before washing. Meanwhile 12% of IKHs without soaking vegetable.
From Table 11, we noticed there were 94.9% of IKHs having hand wash before cooking.
| Variables | Description | Frequency (n) | Percentage (%) |
|---|---|---|---|
| Washing hand before cooking (n=274) | Yes | 260 | 94.9 |
| No | 16 | 5.8 | |
| Hand wash protocol (n=274) | Wet hand | 189 | 69.0 |
| Rub with soap | 175 | 63.9 | |
| Wash hand by clean water | 255 | 93.1 | |
| Dry hand by clean towel | 154 | 56.2 |
Table 11. Handling of hand wash before cooking.
From Figure 6, we saw 84% of IKHs using the separated chopping board and 16.0% of IKHs using the same chopping board.
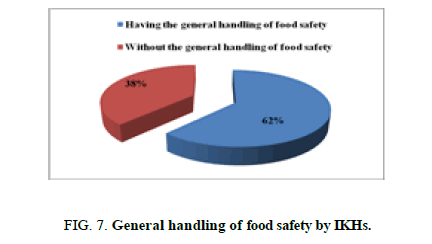
General handling of food safety by IKHs: From Figure 7, we noticed there were 62% of IKHs having the general handling of food safety.
Sanitary condition in the industrial kitchen of factory
From Table 12, we noticed that almost tools were met requirement. However, there were only 20.1% of the water tap derived from high barrel.
| Number | Description | Yes | |
|---|---|---|---|
| Frequency (n) | Percentage % | ||
| 1 | Seperated kitchen | 274 | 100.0 |
| 2 | Table and shelf | 274 | 100.0 |
| 3 | Water tap in the kitchen | 205 | 74.8 |
| 4 | Water contained in the kitchen: Stored in the static barrel Runned from the high barrel |
230 55 |
83.9 20.1 |
| 5 | Storing cabinet having shelf or cup | 272 | 99.3 |
| 6 | Chop stick, spoon stored in the hygiene tube | 274 | 100.0 |
| 7 | Shelf for keeping knife in dry location | 274 | 100.0 |
| 8 | Wash basin (amount): 1 2 3 Over 3 |
3 75 85 114 |
1.1 27.4 31.0 43.4 |
| 9 | Basket to store fruit and vegetable (amount): 2 3 Over 3 |
48 79 152 |
17.5 28.8 55.5 |
| 10 | Scrub, washcloth | 274 | 100 |
| 11 | Soap or detergent | 274 | 100 |
| 12 | Water drainage: dry and free | 271 | 98.9 |
Table 12. Sanitary condition in the industrial kitchen of factory.
Public information about food safety
From Table 13, we saw that 32.1% of IKHs having enough self-confidence about the food safety.
| Description | Frequency (n) | Percentage (%) |
|---|---|---|
| Enough | 88 | 32.1 |
| Not enough | 106 | 38.7 |
| Not clear | 80 | 29.2 |
Table 13. Self-confidence on food safety (n=274).
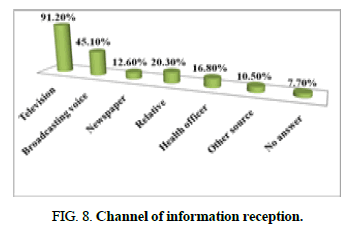
From Figure 8, the IKHs received food safety information via television 91.2%; broadcasting voice 45.1%; relative relation 20.3%; other sources 10.5%. Meanwhile, there were 7.7% of IKHs without food safety information.
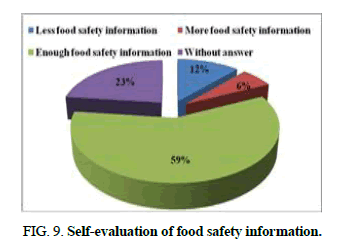
From Figure 9, there were 59% of IKHs receiving enough food safety information; 12% of IKHs receiving less food safety information; 6% of IKHs receiving more food safety information and 23% of IKHs without answer.
From Table 14, up to 90.1% of IKHs believed information useful; 1.8% of IKHs believed information nonsense; 8% of IKHs was without any answer.
| Description | Frequency (n) | Percentage (%) |
|---|---|---|
| Yes | 247 | 90.1 |
| No | 5 | 1.8 |
| No answer | 22 | 8.0 |
Table 14. Benefit of food safety information reception (n=274).
From Table 15, IKHs should be strengthened about food safety information. In this survey, group of food selection knowledge accounted for 67.9%; knowledge and skill of food preservation accounted for 48.5%; information of contaminated food accounted for 42.7% and the lowest percentage accounted for 5.5% belonged to govermental regulation about food safety. Moreover there were 15.7% of IKHs without any answer.
| Description | Frequency (n) | Percentage (%) |
|---|---|---|
| Knowledge of food selection | 186 | 67.9 |
| Knowledge and skill of food preservation | 133 | 48.5 |
| Information of contaminated food | 117 | 42.7 |
| Govermental regulation about food safety | 15 | 5.5 |
| Correct handling information during processing and preserving food | 91 | 33.2 |
| No answer | 43 | 15.7 |
Table 15. Information group should be advocated (n=274).
From Table 16, we noticed that the most preferred channel would be television 87.6%; next was the broadcasting voice with 28.1% and the lowest one was the newspaper with 5.8%. Moreover, there were 7.3% of IKHs receiving information via other source.
| Description | Frequency (n) | Percentage (%) |
|---|---|---|
| Broadcasting voice | 77 | 28.1 |
| Speaker | 19 | 6.9 |
| Newspaper/ magazine | 16 | 5.8 |
| Television | 240 | 87.6 |
| Other source | 20 | 7.3 |
Table 16. Channel of food safety information reception preferred (n=274).
Conclusion
We successfully established a research of description of handling knowledge, behavior about food safety awareness of industrial kitchen handlers. This study would be a basic demonstration for the industrial kitchen handlers as well as the Vietnamese government to propagate the importance of food safety so that public health would be enhanced.
References
- Hayajneh FMF. Awareness of food borne pathogens and food poisoning among consumers in Taif - Kingdom of Saudi Arabia. Sky Journal of Food Science. 2015;4:010-4.
- Abdul-Mutalib NA, Syafnaz AN, Sakai K, et al. An overview of foodborne illness and food safety in Malaysia. International Food Research Journal. 2015;22:896-901.
- Angulo FJ, Jones TF, Angulo FJ, et al. Eating in restaurants: A risk factor for foodborne disease. Clinical Infectious Diseases. 2006;43:1324-8.
- Nyenje ME, Ndip RN. The challenges of foodborne pathogens and antimicrobial chemotherapy: A global perspective. African Journal of Microbiology Research. 2013;7:1158-72.
- Meftahuddin T. Review of the trends and causes of food borne outbreaks in Malaysia from 1988 to 1997. The Medical Journal of Malaysia. 2002;57:70-9.
- Linscott AJ. Food-borne illnesses. Clinical Microbiology Newsletter. 2011;33:41-5.
- Quinlan JJ. Foodborne illness incidence rates and food safety risks for populations of low socioeconomic status and minority race/ethnicity: A review of the literature. Int J Environ Res Public Health. 2013;10:3634-52.
- Grace D. Food safety in low and middle-income countries. Int J Environ Res Public Health. 2015;12:10490-507.
