Research
, Volume: 17( 1) DOI: 10.37532/environmental-science.2021.17.181Increasing users occupation rate and comfort in a hot arid area through the evaluation of the outdoor urban spaces thermal environment
- *Correspondence:
- Abdelhalim Assassi
Institute of Architecture and Urbanism, University of Batna, Algeria
Tel: +95 9954 575 418
E-Mail: abdelhalim.assassi@univ-batna.dz
Received: December 08, 2020; Accepted: December 23, 2020; Published: January 28, 2021
Citation: Assassi A, Mebarki A, Hanafi A, et.al. Increasing user’s occupation rate and comfort in a hot arid area through the evaluation of the outdoor urban space’s thermal environment, J Environ Sci. 2021; 17(1):181
Abstract
The present research aims to evaluate the urban thermal environment in an arid area to enhance users comfort conditions. Our hypothesis is to correlate between air temperature degree and occupancy rate. Our idea is to conduct simultaneously measurement campaigns and questionnaires in urban districts that constitute the city; these representative samples are composed of: traditional, colonial and contemporary district to gain the maximum of sought after information to verify correspondence degree of the results between quantitative and qualitative indicators that have an impact on the thermal environment and outdoor space occupancy, linking cause and effect.
Keywords
Outdoor urban space; thermal environment; on-site measurement; questionnaire; hot arid area
Introduction
This research work aims to understanding the interdependence between the thermal environment and the degree of occupation in the outdoor urban spaces. To understand the appropriate thermal conditions in an open urban space requires careful design that takes the different quantitative and qualitative morpho-thermal aspects [1]. The objective of this work is to evaluation of the quantity and the thermal quality in these streets and estimate air temperatures as well as occupancy rates in inter-urban urban spaces. Through surveys and in situ measurement campaigns, the on-site measurements were carried out using a digital thermometer and observation scans of ordinary users to quantify occupancy rates [2].
Presentation of the case study
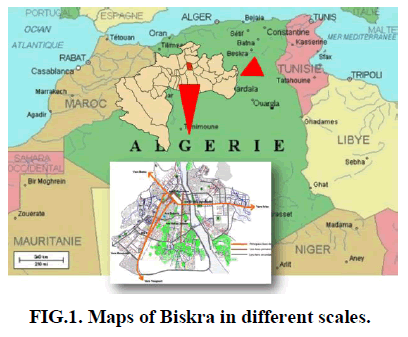
Biskra downtown
Due the territorial reorganization in 1974, the town of Biskra became an important regional urban centre. Located in an arid zone, the climate of Biskra is characterized by cool winters and hot dry summers. The dominant winds are those of the Northwest (cold winds) that blow from November to May; and hot southeast winds blowing from July to September.
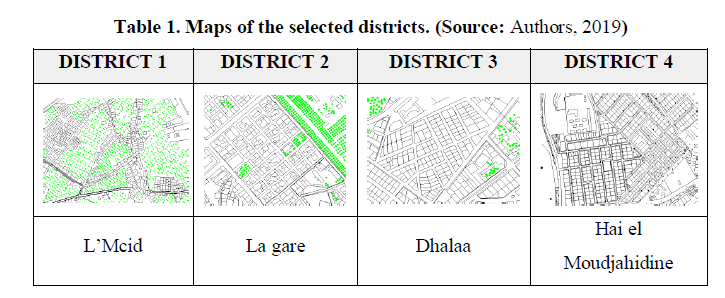
Urban districts of Biskra
Currently, the urban image of the Biskra downtown reflects the synthesis of the successive stages of its historical development. The urban districts reflect easily to a chronological reading and can notably detect them.
• The traditional district (old core): L’Mcid. • The colonial district: La gare. • The spontaneous districts: Dhalaa. • Recent extensions (communal and cooperatives housing): Hai el Moudjahidine.
Measurement campaigns
The selected streets
The urban areas chosen for the research are inter-district streets, having for criterion of choice the variation morphology: height of the vertical surfaces, L/W of the streets, colour and texture, presence and type of vegetation. Inside each district, we have chosen streets, to cover a maximum of the characteristics of the fabric, but also to cover all the possible orientations as well as the heights and the different physical changes in the street (green space, Colour ...) which are factors having an imminent impact on the thermal environment.
Choice of measurement stations
Measurement points inside each street have been selected for the realization of our challenges. To cover the impact of street morphology on the thermal environment in urban areas, the measurement points were multiplied (5 points from the beginning to the end of the street) and this for several periods of the day. The points located in a route are respected throughout the measurement campaign, localized and specified through plans and photos.
We have chosen the middle of the street, which represent an important element of the urban planning (a structuring element at different scales in the city), and which is also the last horizontal plane to receive the direct solar radiation and reflected rays of the constructions. Also, an element easily located in situ. The multiplication of the measurement points in the same street, can also unveiled certain factors of the urban form and the physical elements of the environment that influence the air temperatures and the relative humidity.
Measuring air temperatures/relative humidity
Air temperature and relative humidity represent of the most important photometric quantities for the quantitative evaluation of the thermal environment. The objective of the measurements campaign is to determine the elements of the urban environment which influence and intervene in the control of the thermal environment, and allows us to extract indicators for solar protection to achieve a pleasant thermal comfort to the urban space users.
Measuremen t instruments
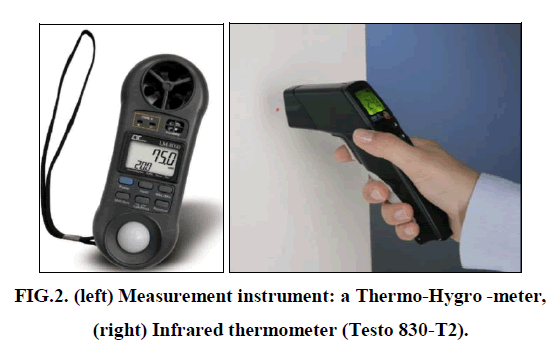
The first monitoring instrument used to measure air temperature, and the relative humidity is an “LM/FI 20” a digital multifunction measurement instrument: anemometer, hygrometer. The second monitoring instrumentation is a testo 830-T2 - Infrared thermometer with 2-point laser marking (12:1 optics) enables you to carry out efficient, non-contact surface temperature measurements with connectable temperature probe (TC type K). The two monitoring instruments records values with high accuracy.
Figure 2:(left) Measurement instrument: a Thermo-Hygro -meter, (right) Infrared thermometer (Testo 830-T2).
Quantitative results analysis
Measurement protocol
The measurements were taken during the hottest summer days and the coldest days in winter, by a team of three people, the duration of each survey was 20 minutes maximum, for each of the sites, to collect values approximated in time between the different measuring points. The surveys were carried out in multi-temporalities of the day; from 06:00 am to 10:00 pm, these measurement times have as criteria:
• Measure the daily variation of air temperatures and relative humidity.
• The hours when sunshine reigns over the urban space.
• Contain all the effects of solar radiation especially on the measuring points.
Collected data treatments After the achievement of the measurement campaigns, during the months of the summer and winter seasons, the following averages were calculated:
a. Calculation of air temperature averages of a street

Ts: the average value of air temperature of a street
Tp: the value of the illumination of a point in a street.
N: the number of points measured in a street.
The calculation of T/HR averages in a street is established for each season, in order to establish the seasonal and annual air temperature cumulus. During the analysis we will try, as far as possible to give explanations to the phenomena observed, as well as the causes of the unexpected or unusual increases in T/HR.
b. Calculation of air temperature averages of a district

Td: The district's air temperatures average
N: The number of selected streets in a district (in our case N = 5)
The average of the neighborhood T/HR is calculated for the summer and winter seasons, to determine the annual variations of the T/RH.
During the analysis we will try, as far as possible, to give explanations to the thermal fluctuations examined.
Quantitative results discussion
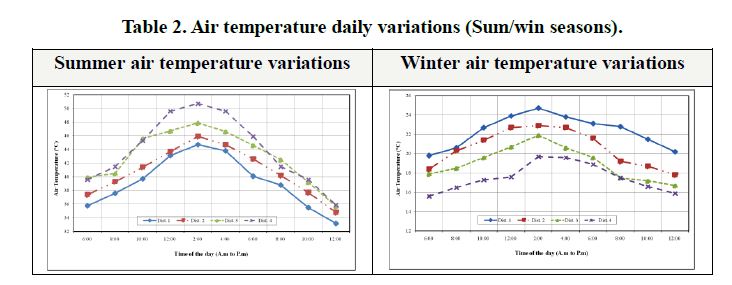
The average values (the cumulative averages of the different values measured along the streets) allow the identification of the air temperatures and the average relative humidity values in each district, which indicates the impact of the morphology of the urban space, with all these characteristics, on the thermal environment.
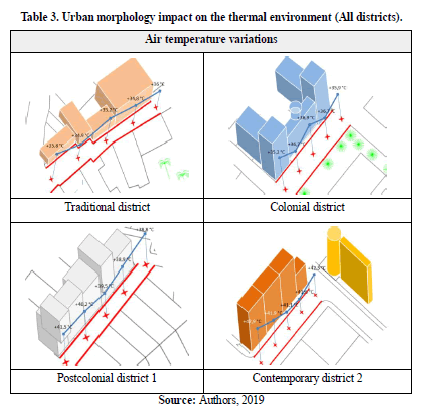
The different urban morphologies of the case study district samples shows different thermal environment; each morphology impacts differ and depend on the street characteristics (H/W ratio, coating of the horizontal and vertical surfaces, color, texture and vegetation). The table below shows the thermal environment resulting by the different urban morphologies studied.
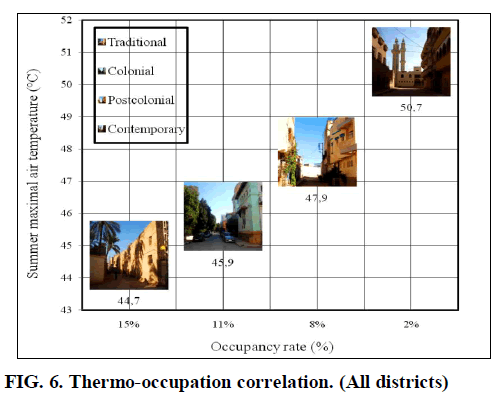
From the results, we can admit that the traditional urban entities generate a better thermal comfort, and it is due to the mo rphological characteristics such as: the narrow streets, the building materia ls (brick of earth), the non reflective textures … etc.
Qualitative results analysis
In this part we will introduce the notion of the qualitative evaluation of thermal environments, for the same on site measurement samples of the districts; the objective is to establish a correlation between the thermal environment and the occupancy rates of the outd oor urban spaces [3] 3]. Throughout the interview’s questioner, in the context of semi structured interviews, we clarify the position of the interviewee vis à vis photography. In the logic of a comprehensive approach, we sought to get as far as possible from the support of subject vis à vis the perception of the urban thermal environment, and vis à vis the paradigm of occupancy and the use of urban spaces. We don’t use direct questions to the subjects about the thermal comfort, but we will focus the attention of the subjects about the thermal qualities, to let emerge, more interaction between the characteristics of the urban morphology [ The criteria related to th e thermal quality, throughout the interviews, qualify their perceptions more easily by impressions related to their daily life (Amphoux, 2004), the photographs were presented to the subject that was invited to express in a guided approach, t o qualify urban street.
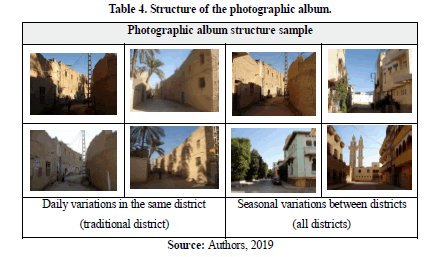
These photographs were presented and grouped in an objective way corresponding to the daily and seasonal thermal variations [ 5], the questions aim to reveal to subjects the reason of the classification chosen for the photography, which helps the emergence of a sensitive and subjective vocabulary translating the activation of mental images related to their experience in those urban spaces. As a qualitative survey, we sought a statistical representativeness of the sample of interviewers, but we mad e sure to differentiate between different variables (age, sex, experience...). Subjects were interviewed for about a 1/2 hour. All discussions were interpreted.
Investigation protocol using a questionnaire based on photographic album
Type of questions for the interview
Due to the difficulty related to the weakness on sensitive appreciation of the urban thermal ambiance, the photography album was presented to subjects to express in a guided manner on parameters related to the temperatures qualities, which en able them, throughout the interview, to q ualify easily their perceptions. The first category constitutes the qualification “thermal perceptual quantity”; we have chosen to structure it in one hierarchical level describing the comfort aspects visible in spa ce. The second stage of the questionnaire aims to deepen subject’s expression on photographs; to clarify the role of sunlight in updating with their perception of scenes; to extract the subject’s expression of the supposed reality reflected by photography [ 5]. The second category includes adjectives of spaces classified in terms of their living ambiance, with qualitative adjectives to express their sens ation (especially thermal sensations) that describes the ambiance that immerses in space.
The quality and quantity semantic concepts scales allow establishing transversal links between terms. In our case, these links based on logical relationships that highlight the qualities and quantities of thermal perception with other morphological elements mak ing up a th ermal ambiance, and using determinants to qualify (cause and effect).
The selected scenes presented to subjects, which represent district’s street samples, depending to their districts representa tive degree. Digital photographic campaigns realized in the selected streets of each district; the scenes chosen to represent the daily variation between the beginning and the end of the day, we have established the same work to assess seasonal variation. We attempt to deepen the reflection on advantages and disadvantages of using photographic supports, it is obvious that photography accurately records sunlight; therefore, we have:
• Considered photography as a sign, which includes a hardware part (urban outdoor space), and another part effect of a phenomenon (heat);
• Chosen to presen t only photographs of famous sites known by interviewees, which serve to induce subjects to remember the sites they know, and express on this memory more than the photographed sites;
• In all the experimentation, all sites photographed from the same angle of view, and in the same direction of vision, centered in the middle of the street, to illustrate the field of view along a street.
Logic structure of the photographic album
We worked under the assumption that it is insufficient to ask subjects to distingu ish the appropriate roles of the heat and other thermal environmental qualities by their perception of a scene. Therefore, our idea is to present to architects different urban dayti me scenes, crystallized reality at a time “t” t”, with a basic the photography album is accompanied by a semi structured questionnaire, related to light quality and sunlight effects, which play a role in the perception of an urban scene.
Otherwise, photographs used to stimulate word from the respondents, which have n ot always evoked expression easily, especially regarding affective dimensions of what the respondents felt. Another survey on the perception of the thermal effect, had also demonstrated difficulty of urban residents to express on the sun lighting of their city [ 2], and the use the photographs in these interviews had trigger discussion and sensory reactivation.
The photographic album of the city consists of three important variations (Photographs of daily variation reference + photogr aphs of seasonal variati on reference + Morphological variations between tissues reference) for each of the four selected districts.
Qualitative results discussion
The subjects are more attentive to the visibility and the markers (these streets are categorized as axes of transit, of displacement), we still find that the criteria are very limited and centered on the quantity and the feeling of security ; while for the latter, the architectural enhancement and symbolization of the dynamic character of the site seem more important, th e evaluations rely much more on multiple criteria, and include in particular the thermal ambiance, the subjects seem very attentive to the heat sensation they feel, a ccording to them, safe, for other streets, they seem more attentive to the architectural q uality.
The second scale includes the qualifying adjectives of classified areas in terms of their atmosphere, for example: pleasant spaces, tedious spaces ...etc. However, this facet is not exhaustive in view of the large number of spaces that exists. It mainly involves th e qualification of spaces illustrated by our picture set, with qualifying adjectives for writing the sensa tion (especially thermal), which describes the atmosphere that immerses in space.
This relationship makes it possible to describe transversal links between the terms. In our case, these links are based on the logical relationships that relate the qualities and quantities of thermal environment with perceptual moods using adjectives to quali fy the effect and the one that pro duces the effect.
To specify the order of perception (conscious/unconscious) of environmental factors in the streets, most of the inter viewers give a similar order of the environmental factors that are more perceptive in an outdoor urban space. a Heat, b Sun, c Humidity, d Noise; e Winds; f Light
Results I nterpretention
The important results are placed in two stages:
Step 1:
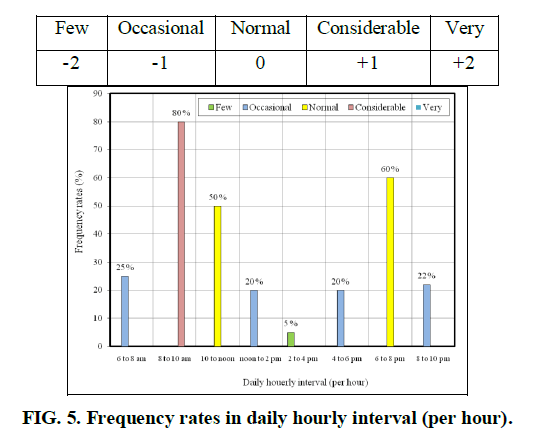
The fi rst step was to know the hours of use of the urban space by the subjects to validate temporalities chosen for the measurement campaign [2] 2]. It was conducted in the form of a questionnaire. Each of the subjects, respond to the questionnaire related to the p hotographic image support and prepare them for the second stage.
Step 2:
The objective of this second step was to verify the relevance of the concepts we have used for the qualification of the image s in order to validate them for future uses. They were sho wn the 48 images in a photographic album (two images per page) asking them to characterize each of the urban scenes they perceive.
We emphasize the fact that these images are accompanied by key words, in order to guide the choice of subjects towards our go als of the experimentation. Thereafter, we have proposed to the subjects of the experiment the same images but in a second time accompan ied with questions include a set of qualifying adjectives, used to qualify these images. Before exposing the results, we emphasize to the designated subjects to respond while looking at an image, their point of view about the urban space, rel ating to their lives experience. First, to characterize the thermal environment in the outdoor spaces, and to identify the vocabulary validated by the subjects, we will verify if the whole of this vocabulary corresponds to the measured quantities: thermal ambiance of a space, the external surf aces component.
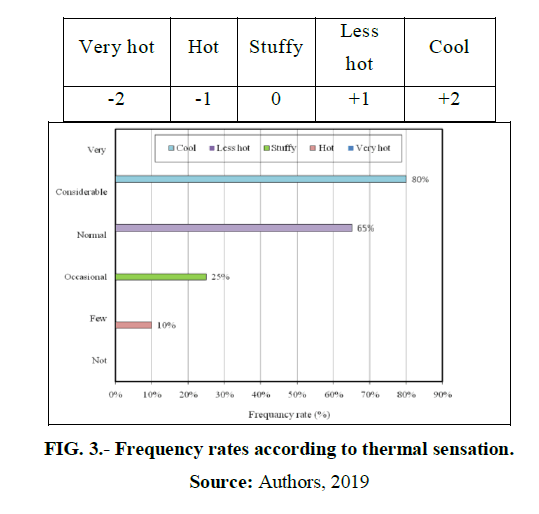
With regard to the re levance of the characterization criteria, we note that those relating to the quantity of thermal environment appear on the majority of the images and often with an important frequency, especially summer season. Later, we deduce that the first p erception of an atmosphere is most of the time a quantitative perception.
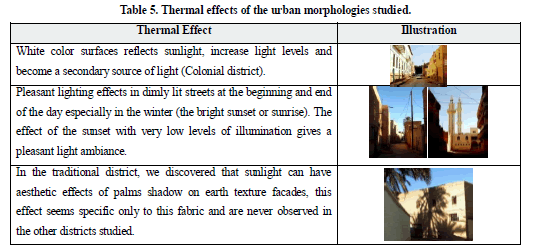
On the other hand, in both summer and winter solstices, where the sunlight are in both extremes; maximum for the summer and i n the minimum for the winter [7] 7], it was noticed a contrast between t he two quantitative and qualitative qualifications. The table 4 summarizes some thermal effects of the urban morphologies studied.
Conclusion
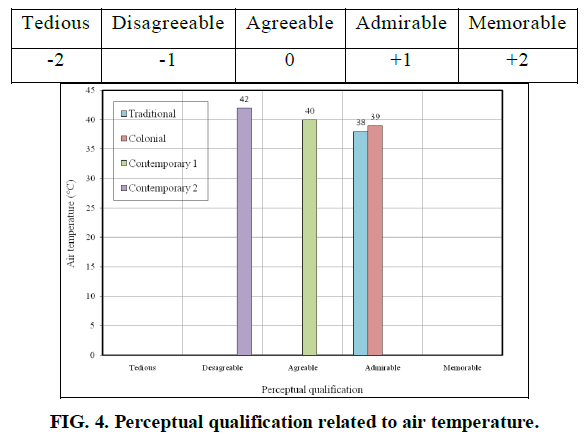
According to the characteristics of the districts, we found that the streets of various: Height/width ratios, orientations, c olors and textures, Has an impact on the quantity and the quality of t he thermal environment, and also on the frequency rate of the urban spaces, where an intense solar radiation dominating most of the year. The perceptions of the urban spaces users have significantly nourished our work; they allowed us to validate the propo sed qualification of our experimental part (quality of thermal environment/quality of the urban space). It was mentioned that classify by defining a new category of the sun effects and sensations produced by sunlight. The most relevant conclusion shows tha t the qualitative characterization of the urban space scenes by a perceptual study is independent from the quantities measured in situ, which implies that the perception of users is beyond any quantitative values of physica l comfort, and morphological and social cultural parameters are also a part of a psychological comfort.
References
- Guedouh, M, S. et al. Effet de la morphologie urbaine sur l’environnement lumineux extérieur. Cas des zones arides et chaudes. ISUF 2011: Urban morphology and the post-carbon City 26-29 August, Concordia University, Montréal .2011.
- Report RUROS. Rediscovering the urban realm and open spaces : Concevoir des espaces extérieurs en environnement urbain : une approche bioclimatique, Centre for Renewable Energy Sources, Department of Buildings. 2004.
- Cherqui, F. Methodologie d'évaluation d'un projet d'aménagement durable d'un quartier, méthode ADEQUA ; HAL, Université de la Rochelle. 2005.
- Hégron, G, Torgue, H. Ambiances architecturales et urbaines, de l’environnement urbain à la ville sensible. HAL, Grenoble. 2007.
- Chelkoff, G. Écologie sensible des formes architecturale : recherche et experimentation ; HAL, Marseille. 2006.
- Amphoux, P. Ambiances urbaines et espaces publics ; Le Mirail, Université de Toulouse. 2004.
- Jallouli, J. La réalité virtuelle comme outil de caractérisation des effets solaires dans l’espace urbain ; Mémoire de DEA, école polytechnique de l’université de Nantes. 2004.
