Original Article
, Volume: 13( 5)Improved Mixing Efficiency and Scaling of Microfluidic Mixer for miRNA Based Diagnostics
- *Correspondence:
- Salim B, Nanotech Research Innovation and Incubation Centre, PSG Institute of Advanced Studies, Coimbatore, Tamil Nadu, India, Tel: +91 9790039955; Fax: +91 422 2573833; E-mail: bbs@psgias.ac.in
Received: April 24, 2017; Accepted: October 13, 2017; Published: October 28, 2017
Citation: Salim B, Arumugham K, Madhu G, et al. Improved Mixing Efficiency and Scaling of Microfluidic Mixer for miRNA Based Diagnostics. Nano Sci Nano Technol. 2017;13(5):150
Abstract
Diagnostics and prognostics have made revolutionary changes with the advent of Micro RNA (miRNA) biomarker based detection of diseases. Currently, much research attention is on designing and developing suitable microfluidic platforms for lab-on-chip type configuration of diagnostic devices. In this paper, a microfluidic nanoscale fluid mixer for hybridizing target miRNA with its conjugate probe was designed and its performance was evaluated. In a microfluidic channel, the fluid flow is laminar, and mixing can happen by way of convection and diffusion. The governing equations of low Reynolds number flows in microchannel include additional terms to the continuity equation and the classical Navier-Stokes equations to incorporate mass transfer effects. Moreover, since there is a diffusion component in the continuity, momentum and energy equations, they need to be solved as simultaneous equations. Comsol Multiphysics 5.2a is capable of modeling such flows and is used for the simulation of the mixer. The principle used for detection of target miRNA is based on fluorescence detection upon hybridization with a quenched probe. In this study, mixers were designed aiming at better hybridization by adding mechanical structures to increase the interaction between the fluid streams and improve the convective contribution to the mixing process. Three types of microfluidic mixers were designed and fabricated with pillar structures for altering the flow pattern in different manners to enhance the hybridization for detection of target miRNA and the performance is compared with a plain T mixer. The design parameter of interest is the length of the channel which is sufficient for hybridization for a chosen flow rate. A study is performed to assess the mixing effectiveness at various lengths for a channel of fixed length. The major conclusion is that the mixer with zig-zag structure provides the best mixing among the three structures tested, where convection and diffusion were both contributing to mixing, with the convective component significantly enhanced compared to the plain T mixer. The fabricated devices were Y type for simplicity.
Keywords
Microfluidics; Mixers; miRNA hybridization; Diagnosis; Biomarker
Introduction
Microfluidics plays an important role in disease diagnostics based on biomarkers [1]. The concept of microfluidic chip has evolved to lab-on-a-chip which supports point of care medical diagnostics. As the chip grows to a lab, the microfluidic components on the chip includes filter, channel for PCR, pump, mixer, collection chambers etc. The behavior of fluids in micro channels differs from that in a macro channel. One of the major issues is the flow of fluid at extremely low Reynolds number and therefore being laminar, which results in restricted convective mixing [2] and due to lack of hydrodynamic instability [3]. Hence microfluidic devices take the advantage of smaller lengths where the mixing is dominated by diffusion, rather than convective momentum and mass transfer. To enhance the mixing due to convection, the channel should be provided with additional mechanical structures to facilitate mixing of the interacting fluids. The Reynolds number in these flows is normally less than 10 and in some cases as low as 0.1 assuming water as the fluid [4].
Materials and Methods
One of the most commonly used technique for diagnostics is micro mixing for hybridizing a target with its complementary probe. Since the flow is laminar in micro channels, mixing seldom happens. Hence it is required to induce certain means for enhanced mixing. Active micro fluidic devices are provided with piezo-electric or magnetic excitation to enhance mixing [5]. In the case of a straight channel micromixer, mixing takes place only by diffusion. This necessitates larger flow length for mixing which increases cost in terms of the reagent requirement as well as size. If some structures are made in microchannel, it creates lamella, which enhances mixing and reduces required channel length.
The application of the mixers proposed in this paper are used for miRNA based diagnostics. The principle behind diagnostics is hybridization of miRNA in the serum obtained from a patient with a conjugate miRNA probe. The probe is commercially available with a quenched fluorophore. Once the probe molecules get bound to the target molecules of the serum, the probe will release fluorescence. The intensity of fluorescence is a measure of over expression of a particular miRNA that is the identified biomarker for a disease.
The design parameters for this application normally considered are the channel volume, time of flow and channel length. The length of the channel should be sufficient to provide required time for the serum and probe to interact, resulting in maximum hybridization. Three designs of mixers are attempted with a nano sized channel and simulated for studying the mixing performance. The first one has a row of pillars in the channel, the second one has pillars arranged in zig-zag manner and the third one with micro pillar structures for split and recombination of fluid in the channel. Many passive mixer structures have been considered and the results published with analysis on the mixing time and mixing length [4]. In this review, several passive architectures are discussed like zig-zag, coaxial, serpentine and twisted channels with dimensions of the order of 100s of micrometers and a comparison of mixing efficiency is reported. In these cases, the Reynolds numbers are above 0.1 and up to 500. As Reynolds number is low, the mixing efficiency is poorer. Active micromixers are good candidates when the time and length required are constrained [6], but there is the complexity involved due to additional activation elements.
For lab-on-a-chip application, the channel array need to be miniaturized and in this study nano sized channels with nano structures are simulated where in the Reynolds number is of the order of 1e-3.
Fluid properties
The fluid used is serum which has a viscosity of 1.75 mPa-s at room temperature and has a density of 1020 kg/m3. Diffusion coefficient of miRNA in water is calculated to be 100 μm2/s against the miRNA radius of 2 nm [7]. The serum and plasma behave like a Newtonian fluid where the shear stress is a linear function of the velocity gradient, whereas blood is a Non-Newtonian fluid [8]. The parameter definitions are set based on the values indicated above. The diffusion coefficient of serum is 61 μm2/s. The Reynolds number for the system is calculated to be 0.006 for nanochannels and hence the flow is laminar. The calculation is shown below for reference.

Where,
ρ: Density of serum=1020 kg/m3
U: Fluid Velocity =2.75 m/s
L: Characteristic Length (Hydraulic diameter)=4e-9 m
μ: Fluid Viscosity=1.75e-3 Pa-s
Re: Reynolds number=0.006
Peclet number which indicates the ratio of mass transport by convection to mass transport by diffusion is calculated as 11e-5 for nano channel and 0.11 for microchannel. Reynolds number for micro channel is calculated to be 6.29, where the flow remains laminar [9] and inertial convective mass transport effects are not possible.
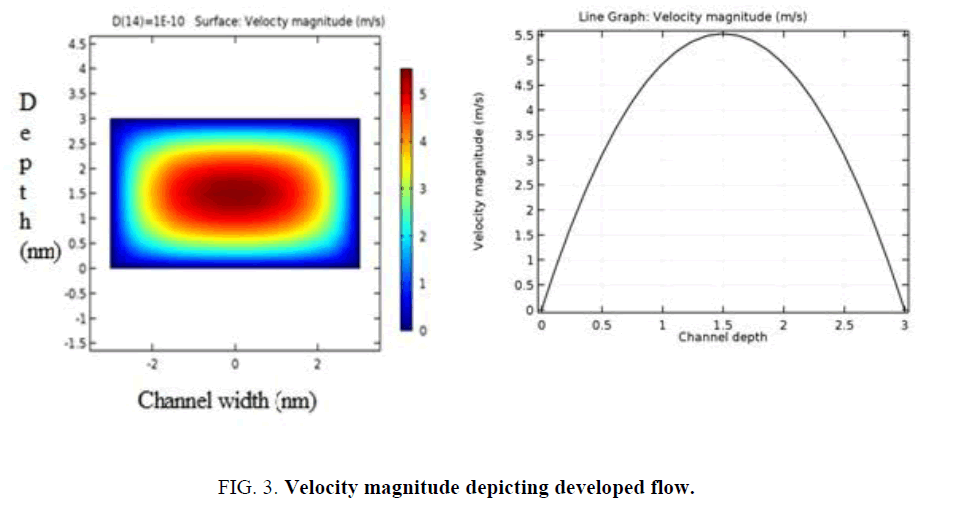
The second fluid for mixer is called a probe which is a detector of miRNA and the molar concentration of the probe is chosen to be 0.5 μM or 5×10⁻⁴ moles/m3. The viscosity and density of the fluids are assumed not to depend on concentration of the solution and hence uncoupled flow study is performed. The entrance length (Lentry=0.05 Re × Hydraulic diameter) is calculated to be 1.2e-3 nm. Therefore, the flow is fully developed in the channel before the fluids start interacting. Since the flow in the device is laminar, mixing happens primarily due to diffusion. The diffusion coefficient of serum and the sample being high, mixing happens quite quickly and justifies scaling down of fluidic channels to nanoscale.
Design and simulation of microfluidic mixer
Design criteria: In any micro system, the size of the device is always one of the design constraints. In addition to the size, other parameters of interest are based on the application. The application identified in this work is miRNA based diagnostics, making use of the binding of the target molecules of the sample with the conjugate probe molecules. Thus, it is required to provide a platform for maximum molecular interaction for better accuracy of detection. This necessitates longer channels and thereby the required quantity of probe increases which in turn increases the cost of diagnosis. Since the flow in micro channels is laminar in nature, there is the need to provide additional structures to ensure adequate interaction so that better molecular diffusion occurs. By providing additional structures, the required channel length can be reduced. The mixer designs considered is of T structure at the input stage and further structures are incorporated for better diffusion. A mixing comparison study is made for 3 designs with pillar structures in the channel taking a simple T mixer as reference.
Results and Discussion
Simulation studies
While studying molecular interaction in micro fluidic channels, it is essential to understand the contribution due to diffusion of species due to the concentration gradient [10]. The modified Navier-Stokes equation for the flow in microchannel considering diffusion flux is derived in this thesis. COMSOL Multiphysics 5.2a microfluidic module is capable of modeling such flows and is used for 3D simulation studies. The split and recombination mixer using pillar structures designed and simulated using COMSOL 5.1 was validated [11] for screening retinoblastoma based on miRNA 18a biomarker. These results were further validated with Real Time PCR for over expression of miRNA18a. 20 samples consisting of 10 healthy and 10 retinoblastomas were used for this study. The successful validation of the COMSOL model by Salim provided the confidence to use the same tool for the current simulation also [11].
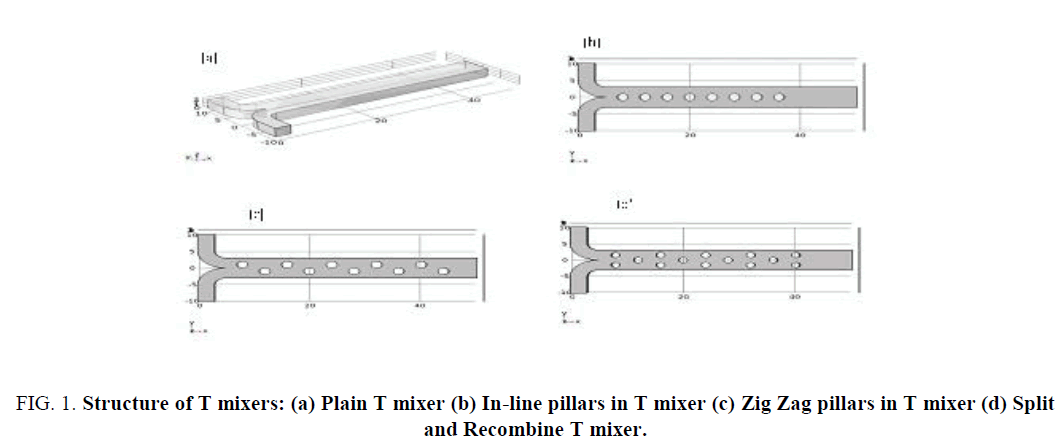
Simulation studies are performed on a simple T mixer as a reference for mixing and three modified mixers with pillars introduced in the fluid path. The structures designed are easy to fabricate and enables velocity modulation of fluid flow and enhanced mixing. The dimensions are in nm and the structures of the mixer are as shown in Figure 1 (a-d).
Figure 1: Structure of T mixers: (a) Plain T mixer (b) In-line pillars in T mixer (c) Zig Zag pillars in T mixer (d) Split and Recombine T mixer.
The structure shown in Figure 1(a) is a plain T mixer which is taken as a reference to study enhanced mixing achieved by the addition of structures in the channel. The length of the channel is 50 nm, depth 3 nm and width 6 nm; the inlets are of 3 nm wide and 10 nm long. Figure 1(b) has 8 pillars 4 nm apart lined up along the center of the channel with pillar diameter of 1 nm. Figure 1(c) has 8 pillars of diameter 1 nm, arranged in zigzag form spaced 4 nm apart in x direction and offset by ± 1 nm in the Y direction. Figure 1 (d) uses pillars of 1 nm diameter arranged forming split and recombine structure [11]. The parameter specifications for simulation are as shown in Table 1.
| Name | Value | Description |
|---|---|---|
| D | 1.0E−4 m2/s | Diffusion coefficient |
| fr | 5.0E−17 m3/s | Flow rate |
| c0 | 5.0E−4 mol/m3 | Concentration at inlet 1 |
| c1 | 0 | Concentration at inlet 2 |
Table 1: Parameter specification.
The flow rate is chosen as 0.05 pl/s to have a flow velocity of 2.75 m/s in the channel. The molar concentration of probe is 0.5 μM corresponding to a concentration of 5e-4 mol/m3. The concentration of miRNA in the serum is zero by design. The study is on velocity modulation that happens due to structures in the channel to enhance the convective component of the mixing. The average concentration at the output, concentration along the width of the channel and the concentration along the channel depth are plotted for various values of diffusion coefficients. While the fluid is flowing in a microfluidic channel, convection and diffusion occur. The convective and diffusive flux in the channel are also plotted to understand the mechanism of mixing.
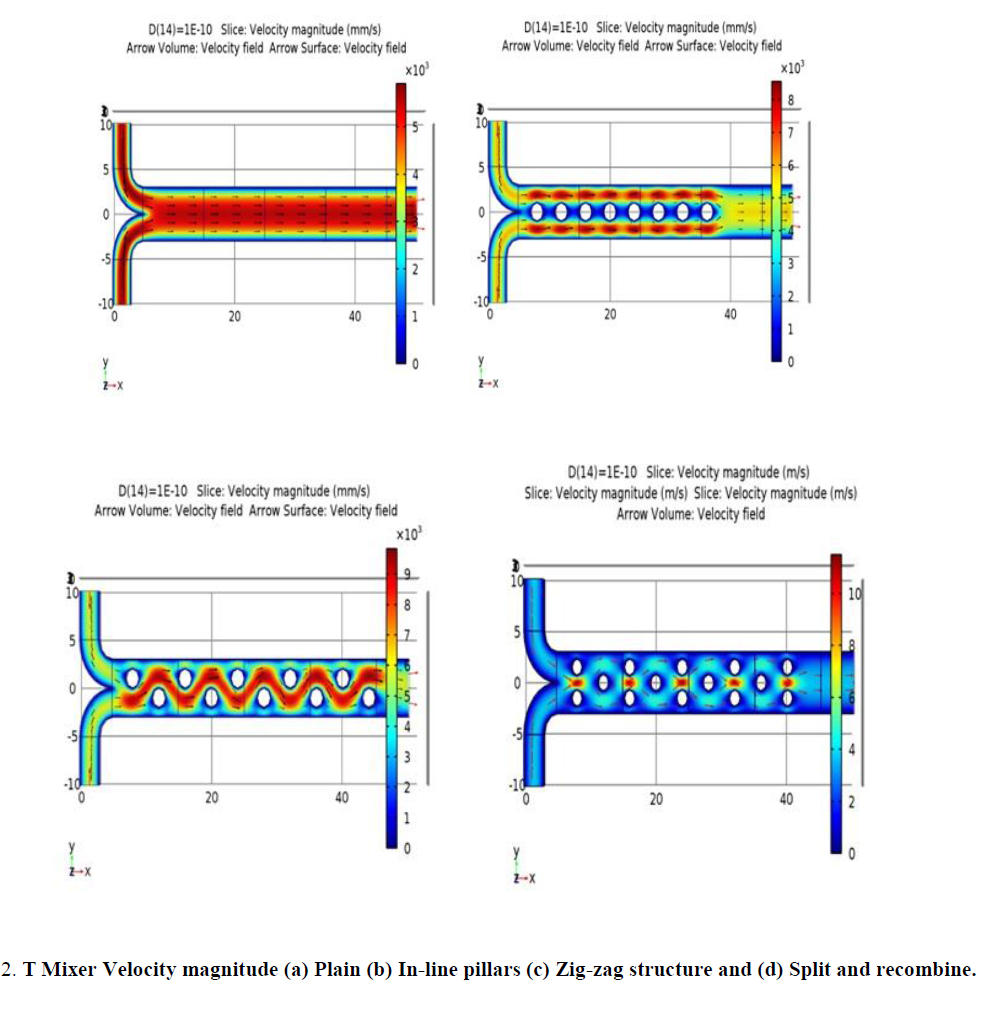
Figure 2 shows the velocity magnitude for all the four structures. In a plain mixer, the fluid flows with a uniform velocity averaging to 2.75 m/s in any cut plane as shown in Figure 3 and 4. The flow is fully developed in the channel as per the calculated entrance length of 1.2e-3 nm. Figure 2(b, c, d) demonstrate a modulated velocity magnitude due to the pillar structures in the path of the fluid.
Figure 2: T Mixer Velocity magnitude (a) Plain (b) In-line pillars (c) Zig-zag structure and (d) Split and recombine.
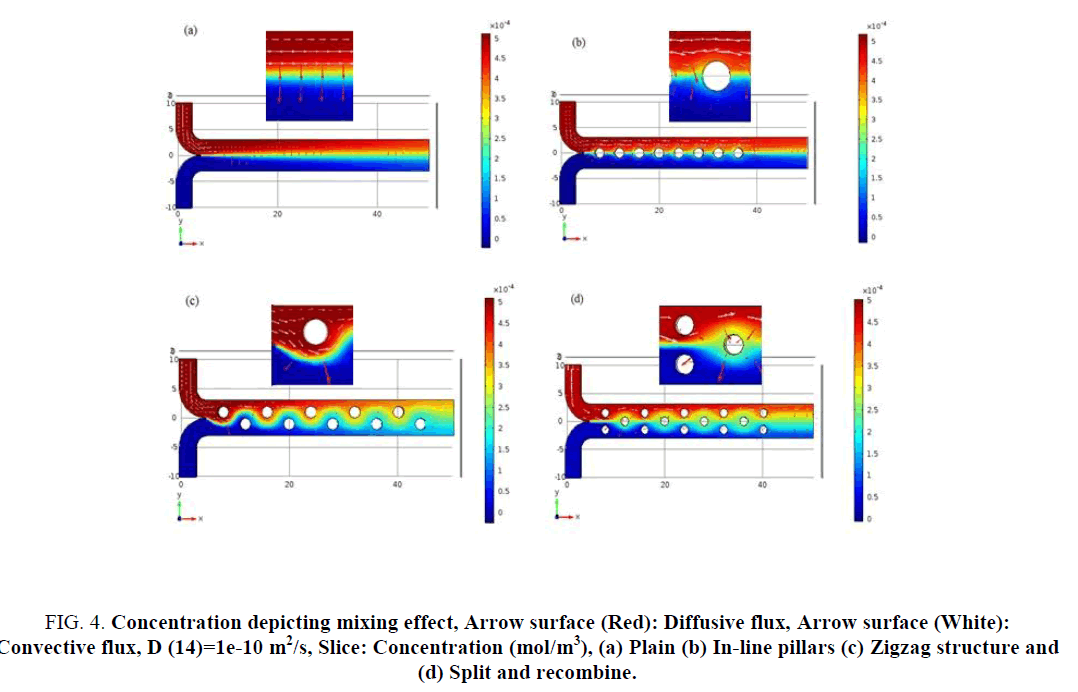
Figure 4: Concentration depicting mixing effect, Arrow surface (Red): Diffusive flux, Arrow surface (White): Convective flux, D (14)=1e-10 m2/s, Slice: Concentration (mol/m3), (a) Plain (b) In-line pillars (c) Zigzag structure and (d) Split and recombine.
Arrows in the figures show the velocity vectors of the flow in the channel. These arrows clearly show the change in velocity vectors caused by structures. In Figure 2 (a) all the vectors are in same direction, while in (b) vector directions are slightly changed and (c, d) demonstrate substantial deviations in the velocity vectors.
The mixing capability of all the four mixers is analysed based on the concentration across a parallel slice along the channel. The concentration along with the convective flux and diffusive flux are shown in Figure 4. The convective flux is indicated with white arrow lines whereas the diffusive flux is indicated using red arrows. From Figure 4, easy comparison of the quantum of diffusive interaction from structure to structure can be made based on the red diffusive flux lines. In the case of plain mixer (Figure 4 (a)) the diffusion flux lines are aligned in one direction, resulting in mixing only at the lamella interface. In case of the mixer in Figure 4 (b, c, d), the diffusion flux lines are direction modulated as seen in inset. This may enhance self-diffusion also. Once the structures are incorporated in the channel, convective flux also starts contributing to mixing. Figure 4 (c) shows the convective flux adding to mixing process and is demonstrating the best result.
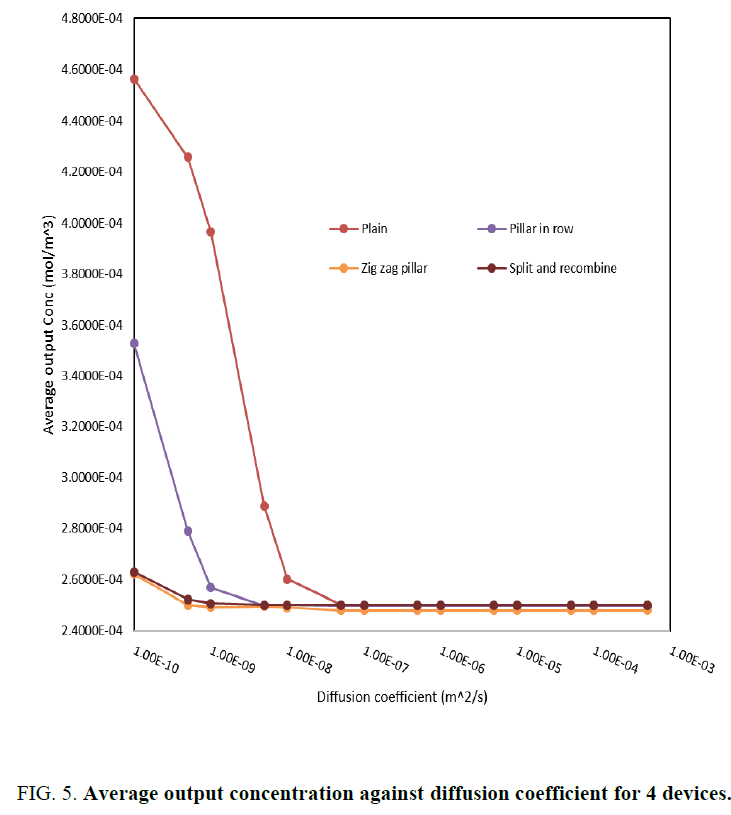
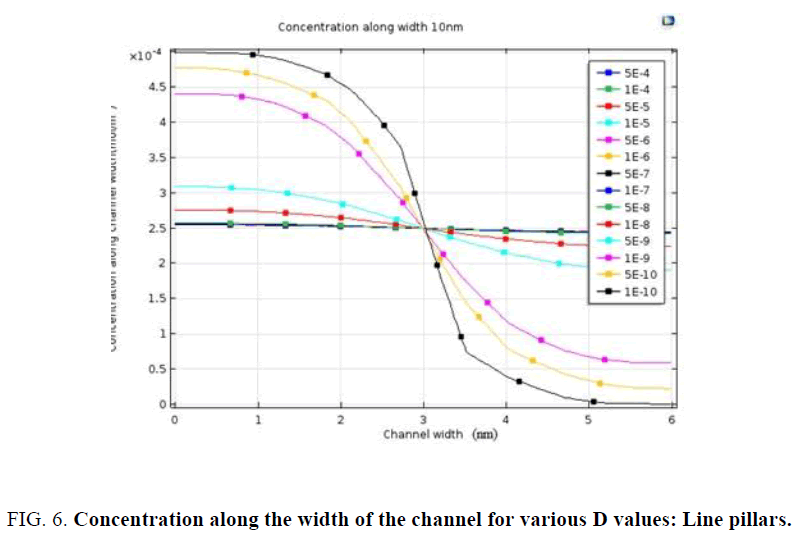
The average concentration at the output port is a measure of how effective the mixing has been. A plot of the average output concentration against diffusion coefficient is extracted for each of the structures as given in Figure 5(a-d). This plot gives information on dependency of diffusion coefficient on mixing capability. The structure with zigzag pillars exhibits best mixing as is seen from Figure 4 and Figure 5. As was mentioned in the introduction, one of the design parameters for diagnostic mixers is the length of the channel, which should be sufficient to support maximum hybridization. In this case when the fluid is the probe whose diffusion coefficient is of the order 1e-4, diffusion happens at very small lengths of the order of 10 to 20 nm. Another interesting inference is on the concentration plot along the width of the channel for various values of diffusion coefficient, which is shown in Figure 6. The dependency of channel length for complete mixing to attain an average concentration of 2.5 mol/m3 is no more a constraint for fluids with diffusion coefficient above 1e-8 m2/s. Since the diffusion coefficient of miRNA based probes were of the order of 1e -4 m2/s or 1e-5 m2/s; one can conclude that there is a definite possibility of miniaturization to nano scale while designing microfluidic platform for miRNA based diagnosis.
Figure 5: Average output concentration against diffusion coefficient for 4 devices.
Fabrication of microfluidic mixer
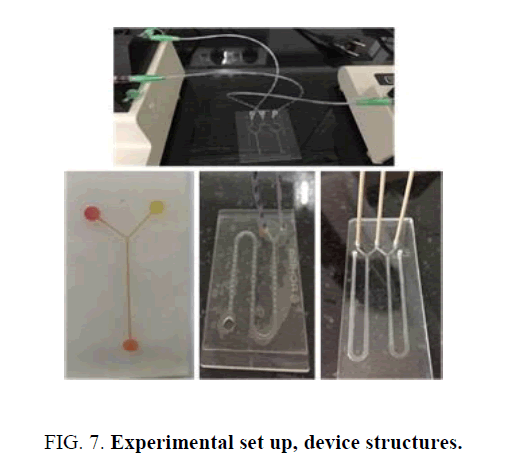
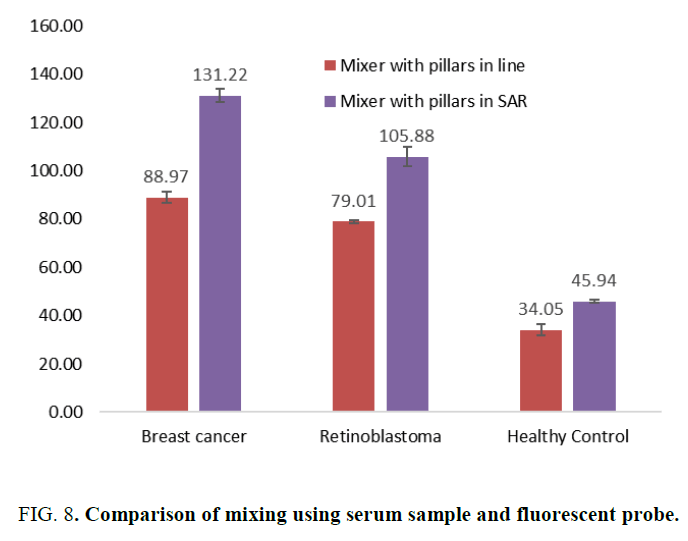
Microfluidic devices were fabricated using PMMA micromachining and fluidic experiments were conducted. Due to limited resource in fabricating nano scale device, micro scale devices were fabricated with 3 of the simulated structures namely plane, pillars in line and SAR pillar structure. Simple Y mixer was fabricated on PDMS using mold. The length of the channel 29.39 mm, width 2.5 mm and depth 0.25 mm. This device was not used for experimenting. Device with pillar structure was fabricated on PMMA with a channel length of 29.84 mm, width. 1 mm, depth 0.25 mm and pillar diameter of 0.5 mm. This was fabricated in S shape and straight channel to study effect of channel length. The third structure had SAR arrangement of pillars in the channel. Channel width 1.2 mm, depth 0.25 mm, pillar diameter 0.3 mm and channel length of 29.5 mm. Comparison of mixing was done among device with line pillars and the device with split and recombine structures at 29 mm distance from entry point. Images of the devices and experimental set up are shown in Figure 7. Micro syringe pumps were used to allow the fluids to flow through channels at flow rate of 1 micro liter per min. The fluids were molecular beacon probe at 0.06 μM concentration and serum of breast cancer patients. Samples were collected against ethical clearance no. IHEC 16/180 dated 07-9-2016, 14/173 dated 26-1-2014. The molecular beacon probe is miRNA 21 and miRNA 18a (Taqman) which on hybridization with miRNA 21 or miRNA 18a from the serum releases fluorophore molecules. These molecules when excited by 645 nm wavelength light will emit 665 nm wavelength fluorescence. Fluorescence microscope was used to measure the concentration of miRNA 21 or miRNA 18a in terms of fluorescence intensity. The results obtained are shown in Figure 8 which indicated better efficiency for split and recombine structure.
Scalability
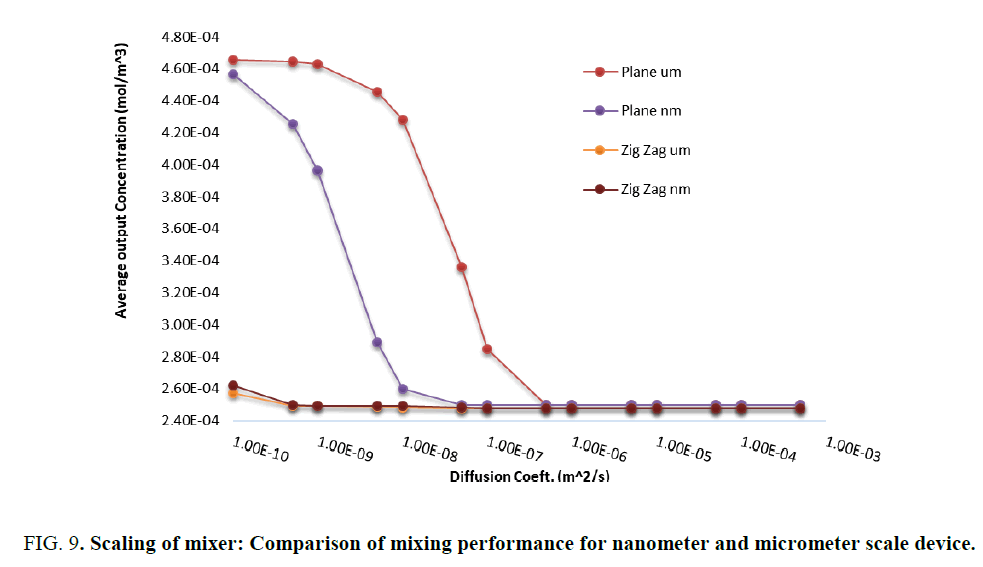
Simulation studies are performed on the scalability of design by changing the unit to micrometers for the same device. The result presented in Figure 9 is a comparison of plain mixer with zig-zag mixer demonstrating the scalability. The plain structure shows minor difference in mixing capability while scaling down from micrometer to nanometer scale, mixing is found to be better in nanoscale device. However, the zig zag mixer shows similar performance upon scaling. Effect of meshing was experimented which did not have any impact on results.
Figure 9: Scaling of mixer: Comparison of mixing performance for nanometer and micrometer scale device.
The objective of this work was to study the capability of mixing in a nanofluidic channel for diagnostic applications considering the contributions of diffusion and convection towards better mixing. In this work the basic structure of channel is maintained same and the flow is made zigzag or split and recombine by incorporating simple pillars unlike in studies reported in the literature, wherein the channel itself is designed with complex structures. Though split and recombine is a newer concept compared to zigzag or serpentine structures, in this study zigzag structure resulted in better mixing as seen in Figure 5. In biomedical diagnostics, serum is the most common fluid. The diffusion coefficient of serum or miRNA in water is of the order of 1e-4, which suggests as per Figure 6 that mixing due to diffusion is very effective even in low Reynolds number fluid flow channels. These designs are simple to fabricate with the new tools like e-beam lithography, X-Ray lithography or LIGA process [9] Hence scaling down of microfluidic platforms for lab-on-chip applications involving fluid flow does not get constrained by the length of the channel for effective hybridization as seen from Figure 6 and Figure 9. Most of the experiments on microfluidic platforms require the use of micro syringe pumps and once scaling down is done, appropriate means to pump fluid at flow rate of Pico liters per sec need to be incorporated. Therefore, one can conclude that there is a clear possibility of miniaturization of diagnostic devices using microfluidics at low cost.
Conclusion
The objective of this work was to study the capability of mixing in a nanofluidic channel for diagnostic applications considering the contributions of diffusion and convection towards better mixing. In this work the basic structure of channel is maintained same and the flow is made zigzag or split and recombine by incorporating simple pillars unlike in studies reported in the literature, wherein the channel itself is designed with complex structures. Though split and recombine is a newer concept compared to zigzag or serpentine structures, in this study zigzag structure resulted in better mixing as seen in Figure 5. In biomedical diagnostics, serum is the most common fluid. The diffusion coefficient of serum or miRNA in water is of the order of 1e-4, which suggests as per Figure 6 that mixing due to diffusion is very effective even in low Reynolds number fluid flow channels. These designs are simple to fabricate with the new tools like e-beam lithography, X-Ray lithography or LIGA process [9]. Hence scaling down of microfluidic platforms for lab-on-chip applications involving fluid flow does not get constrained by the length of the channel for effective hybridization as seen from Figure 6 and Figure 9. Most of the experiments on microfluidic platforms require the use of micro syringe pumps and once scaling down is done, appropriate means to pump fluid at flow rate of Pico liters per sec need to be incorporated. Therefore, one can conclude that there is a clear possibility of miniaturization of diagnostic devices using microfluidics at low cost.
Acknowledgment
We wish to acknowledge the support and encouragement extended by Prof. P Radhakrishnan, Director, PSG Institute of Advanced studies, Coimbatore.
References
- Wang, Jin, Jinyun C, et al. MicroRNA as biomarkers and diagnostics. J Cell Physiol. 206;231(1):25-30.
- Beebe, David J, Glennys M, et al. Physics and applications of microfluidics in biology. Annu Rev Biomed Eng. 2002;4:261-86.
- Capretto, Lorenzo, Cheng W, et al. Micromixing within microfluidic devices. Top Curr Chem. 2011;304:27-68.
- Lee, Chia Y, Chin LC, et al. Microfluidic mixing: A review. Int J Mol Sci. 2011;12(5):3263-87.
- Suh, Yong K, Sangmo K. A review on mixing in microfluidics. Micromachines. 2010;1(3):82-111.
- Meijer HEH, Mrityunjay KS, Tae GK, et al. Passive and active mixing in microfluidic devices. Macromol Symp. 2009;279(1):201-9.
- Milo R, Moran U, Jorgensen PC, et al. Bionumbers the database of key numbers in molecular and cell biology. Nucleic Acids Res. 2010;38(1):D750-3.
- Exiqon. Biofluids Guidelines Analyzing microRNAs in Liquid Biopsies. 2015.
- Madou M. Fundamentals of Microfabrication. Ceramics, Japan, 2001.
- Sambasivam, Rajamani. Extended Navier-Stokes Equations: Derivations and Applications to Fluid Flow Problems. 2013.
- Salim B. PMMA platform based micro fluidic mixer for the detection of microRNA-18a from retinoblastoma serum. J Anal Bioanal Tech. 2015;6(4):4-10.
