Review
, Volume: 16( 1)Identification of Threat to Air Quality in a Tropical Coastal Region, Kerala, India
- *Correspondence:
- Anu N
Viswesaraya National Institute of Technology
Nagpur, India
Tel: +91-9496344127
E-Mail: anuukfcet@gmail.com
Received: January 02, 2020; Accepted: January 17, 2020; Published: February 20, 2020
Citation: Sheela AM, Anu N, Anna A. Identification of Threat to Air Quality in a Tropical Coastal Region, Kerala, India. Indian J. Environ. Sci. 2020;16(1):103.
Abstract
Air pollution and its adverse impacts are one of the greatest problems faced by mankind. The study was conducted to assess the threat to air quality in a tropical region. The diurnal variation of particulate matters (PM10 and PM2.5), SO2, NO2, NOx, NO, CO, ozone, and ammonia in ambient air of the coastal city, Thiruvananthapuram, Kerala, India has been assessed. Factor analysis was conducted to identify the critical factors affecting the air quality. The study reveals that the concentration of carbon monoxide, PM10, and PM2.5 is nearing to the limiting standards. Hence, immediate attention should be taken for the reduction of these parameters. Ozone pollution factor, Aerosol pollution factor, and Ammonia pollution factors are the critical factors controlling the ambient air quality in a tropical region.
Keywords
Air quality; Tropical region; Ozone; Aerosol; Ammonia; Carbon monoxide
Introduction
Air pollution is one of the serious environmental concerns of the urban Asian cities including India where the majority of the population is exposed to poor air quality [1]. Particulate matters of size less than 10 μm and 2.5 μm (PM10 and (PM2.5) as well as gaseous pollutants can cause an impact on metabolic features in blood and which in turn cause malfunction of human organs [2,3]. Emissions from vehicular exhaust [4,5] industrial stack [6], domestic heating (in temperate climates) [7], burning of garbage [8,9] construction and demolition activities [10,11] are potential risks for large air pollution exposures [12]. The rapidity of economic development combined with the lack of emission controls makes Asia’s megacities prone to more serious air pollution problems than similar cities in industrialized nations. The routine pollutants in urban air include sulphur dioxide, nitrogen oxides, and suspended particulate matter. There is also a server threat from a range of other air toxins such as carbon monoxide, small particulate emissions, lead, benzene, Polycyclic Aromatic Hydrocarbons (PAH), and ozone. Generally, all the elements exhibited a seasonal trend with a higher level in the dry season as compared to those in the rainy season [13]. Toxic air pollutants such as benzene and formaldehyde are substances from automobile emissions that are known to cause or are suspected of causing cancer, genetic mutation, birth defects or other serious illnesses in people even at relatively low levels (https://fortress.wa.gov/ecy/publications/documents/0002008.pdf).
Air pollution in many cities around the world is increasingly reaching levels that threaten people’s health, according to a study by the World Health Organization. Motor vehicles and fossil fuel power plants are among the major contributors. According to a WHO [14], more than two million premature deaths each year can be attributed to the effects of urban outdoor and indoor air pollution (caused by the burning of solid fuels). Outdoor air pollution is among the most significant environmental threats to human health [15]. India’s population is exposed to dangerously high levels of air pollution [16]. The Central Pollution Control Board reveals that 77% of Indian urban agglomerations exceeded the National Ambient Air Quality Standard (NAAQS) for irrespirable suspended particulate matter (PM10) in 2010 [17]. India has the highest rate of death caused by chronic respiratory diseases anywhere in the world [16].
In the current research work identification of major air pollutants in Thiruvananthapuram, the capital city of Kerala, located in the southern part of India and investigated the emission inventory to assess the source contribution impact due to anthropogenic activities nearby location.
The Climate of Thiruvananthapuram City
Thiruvananthapuram city, through in the tropics enjoys fair weather. http://shodhganga.inflibnet.ac.in/bitstream/10603/6758/10/10_chapter%203.pdf). The average temperature is about 29°C and the annual rainfall is around 1700 mm with concentration outbursts during both South-West and North-East monsoons. There is no demarcation of seasons. However, the summer period is generally taken from March to May followed by monsoon season (South-West and North-East) which lasts up to November. The post-monsoon period from December to February is relatively cool
Materials and Methods
The diurnal variation of ambient air quality from the CAQMMS installed by the Kerala State Pollution Control Board at Plamood, Thiruvananthapuram city on 9th December 2015 has been used in the study TABLE 1, Factor analysis was conducted using SPSS software.| CO | Ozone (µg/m3) | NO | NO2 | NOX | NH3 | SO2 | PM2.5 | PM10 | T (°C) | H (%) | S | D | R | BP | RF | |
|---|---|---|---|---|---|---|---|---|---|---|---|---|---|---|---|---|
| (mg/m3) | (µg/m3) | (µg/m3) | (µg/m3) | (µg/m3) | (µg/m3) | (µg/m3) | (µg/m3) | (m/s) | (deg.) | (W/m2) | (mmHg) | (mm) | ||||
| 0:00 | 1.64 | 2.8 | 0.7 | 5.4 | 6.2 | 9.4 | 4.9 | 10 | 18 | 25.9 | 88 | 1 | 240 | 19 | 748 | 0 |
| 1:00 | 1.59 | 4.2 | 0.7 | 5.4 | 6.2 | 9.3 | 3.9 | 12 | 22 | 25.9 | 87 | 0.6 | 212 | 19 | 746 | 0 |
| 2:00 | 1.55 | 1.9 | 0.8 | 5.5 | 6.3 | 9.3 | 3.5 | 12 | 20 | 25.8 | 87 | 0.5 | 177 | 19 | 745 | 0 |
| 3:00 | 1.46 | 4.4 | 0.7 | 5.4 | 6.1 | 9.4 | 3.9 | 11 | 23 | 25.6 | 88 | 0.5 | 224 | 19 | 745 | 0 |
| 4:00 | 1.35 | 1.3 | 0.7 | 5.4 | 6.1 | 9.2 | 3.6 | 14 | 28 | 25.6 | 88 | 0.4 | 295 | 19 | 746 | 0 |
| 5:00 | 1.29 | 1.4 | 0.6 | 5.5 | 6.2 | 9.3 | 5.1 | 15 | 28 | 25.6 | 89 | 0.5 | 252 | 19 | 747 | 0 |
| 6:00 | 1.3 | 0 | 0.8 | 5.6 | 6.4 | 9.3 | 6.1 | 17 | 36 | 25.6 | 89 | 0.4 | 306 | 20 | 749 | 0 |
| 7:00 | 1.31 | 0.5 | 1 | 5.7 | 6.6 | 9.3 | 6.8 | 41 | 68 | 25.9 | 89 | 0.5 | 290 | 66 | 750 | 0 |
| 8:00 | 1.45 | 5.6 | 0.8 | 6.5 | 7.3 | 9.3 | 7.9 | 50 | 66 | 27.5 | 83 | 0.5 | 148 | 228 | 752 | 0 |
| 9:00 | 1.42 | 9.8 | 1 | 6.9 | 7.9 | 9.3 | 14.8 | 26 | 53 | 29.1 | 74 | 1.6 | 94 | 382 | 753 | 0 |
| 10:00 | 1.47 | 11.4 | 0.7 | 6.5 | 7.2 | 9.6 | 11.7 | 11 | 27 | 29.3 | 72 | 1.5 | 124 | 388 | 752 | 0 |
| 11:00 | 1.26 | 15.8 | 0.7 | 6.1 | 6.8 | 9.6 | 7.5 | 8 | 18 | 30.3 | 68 | 1.2 | 218 | 680 | 750 | 0 |
| 12:00 | 1.25 | 14.6 | 0.7 | 4.9 | 5.6 | 9.7 | 3.9 | 7 | 17 | 31 | 62 | 1.5 | 236 | 557 | 749 | 0 |
| 13:00 | 1.27 | 12.1 | 1 | 5.4 | 6.4 | 10.4 | 3.9 | 6 | 13 | 30.7 | 64 | 2.3 | 149 | 498 | 747 | 0 |
| 14:00 | 1.24 | 16.3 | 1 | 5.9 | 6.9 | 10.6 | 4.7 | 22 | 42 | 29.7 | 70 | 3.2 | 83 | 446 | 746 | 0 |
| 15:00 | 1.2 | 18 | 1 | 5.6 | 6.6 | 10.4 | 4.8 | 9 | 18 | 29.2 | 72 | 2.8 | 77 | 241 | 746 | 0 |
| 16:00 | 1.07 | 14.2 | 1.1 | 5.6 | 6.7 | 10.7 | 4.5 | 10 | 20 | 29.3 | 71 | 2.5 | 86 | 212 | 746 | 0 |
| 17:00 | 1.04 | 11.9 | 0.9 | 5.7 | 6.6 | 11 | 3.6 | 12 | 26 | 28.6 | 76 | 2.4 | 96 | 55 | 747 | 0 |
| 18:00 | 1.04 | 7.7 | 1.1 | 6.3 | 7.4 | 10.9 | 6.2 | 25 | 55 | 28.2 | 78 | 1.4 | 112 | 18 | 748 | 0 |
| 19:00 | 1.12 | 5.4 | 1.3 | 7.1 | 8.4 | 10.6 | 7.9 | 32 | 57 | 28.2 | 79 | 1.1 | 66 | 18 | 749 | 0 |
| 20:00 | 1.29 | 3.5 | 1.2 | 7.7 | 8.8 | 10.5 | 7 | 34 | 65 | 28 | 80 | 0.7 | 94 | 18 | 750 | 0 |
| 21:00 | 1.26 | 5.7 | 1.1 | 7.4 | 8.4 | 10.4 | 7.7 | 28 | 46 | 27.8 | 82 | 0.7 | 265 | 18 | 751 | 0 |
| 22:00 | 1.26 | 2.8 | 1.1 | 7.2 | 8.3 | 10.3 | 6.9 | 31 | 54 | 27.6 | 84 | 0.5 | 187 | 18 | 751 | 0 |
| 23:00 | 1.24 | 4 | 1 | 7 | 8 | 10.2 | 6.1 | 15 | 29 | 27.3 | 83 | 0.9 | 303 | 18 | 751 | 0 |
Table 1: Ambient air quality data on 9-12-2020.
Results and Discussion
Variation of air quality parameters
Carbon monoxide (CO): Carbon monoxide is a colorless, odorless, poisonous gas emitted from the vehicle’s exhaust as a result of incomplete combustion. It interferes with the blood’s ability to carry oxygen to the brain, heart, and other tissues. Unborn or newborn children and people with heart disease are in greatest danger from this pollutant, but even healthy people can experience headaches, fatigue, and reduced reflexes due to CO exposure. The anthropogenic sources of CO are motor vehicles, coal combustion, fuel oil combustion, industrial processes, solid waste disposal, and refuse burning (http://www.yourarticlelibrary.com/air-pollution/7-air-pollutants-commonly-found-in-urban-atmosphere-of-india/19768/). In motor vehicles air to fuel ratio has a direct impact on carbon monoxide emissions. At lower air to fuel ratio, carbon monoxide emissions are increased due to incomplete combustion in the low presence of oxygen. The highest levels of CO typically occur during the colder months of the year when inversion conditions (when the air pollution becomes trapped near the ground beneath a layer of warm air) are more frequent (www.tceq.texas.gov/airquality/sip/criteria-pollutants/sip-co). It is a pollutant than affects methane carbon dioxide, and tropospheric (lower atmospheric) ozone (http://www.giss.nasa.gov/research/briefs/shindell_09/).
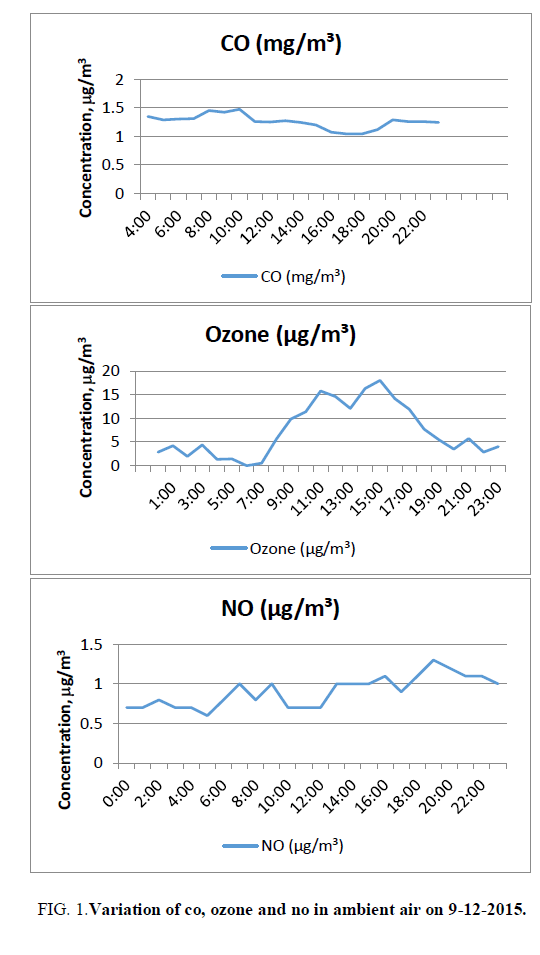
CO varies from 1.04 ppm (17:00 and 18:00) to 1.64 ppm (0:00). The average value of CO is 1.31 ppm against the standard of 2 ppm (8 hours). The average value is around 66% of the limiting standard FIG. 1.
The concentration of CO reaches a maximum in the early morning hours due to peak early morning traffic and the second peak of CO concentration is usually observed corresponding to the late afternoon traffic period and decreases to low levels during the night (http://www.yourarticlelibrary.com/air-pollution/7-air-pollutants-commonly-found-in-urban-atmosphere-of-india/19768/).
Ozone: Ozone is formed in the atmosphere by photochemical reactions in the presence of sunlight (high levels of ultraviolet radiation) and precursor pollutants, such as the oxides of nitrogen (NOx) and volatile organic compounds (WHO, 2006). Sunlight, cloud cover, temperature, wind direction, and low wind speed contribute to ozone formation. Sunlight stimulates the volatile organic carbons and NOx chemicals to recombine to create ground-level ozone (http://www.wmcac.org/airquality/factors.html). When there are a few or no clouds, or only high transparent clouds, solar insulation is more able to penetrate to ground level, enabling the photochemistry that generates ground-level ozone to occur. When cloud cover increases, the likelihood of elevated ozone levels decreases. High temperature enhances the ozone formation chemistry and increases the evaporative emissions of volatile organic compounds. Low wind speeds (less than 3 m/s) are necessary for the accumulation of precursors of ozone formation and subsequent formation of ozone. Higher wind speeds tend to dilute or disperse emissions. Dry weather allows ozone to remain in the air and therefore low levels of precipitation can contribute to ozone formation. Widespread rain will cleanse the atmosphere of ozone.
Excessive ozone in the air can cause breathing problems, trigger asthma, reduce lung function and may cause lung diseases. Increased episodes of mortality are associated with high ozone days in cities. Burning of fossil fuels is a major man-made cause of nitrogen dioxide, while the use of motor vehicles, solvents, and industrial processes in the petrochemical industry are the sources of volatile organic compounds (http://dwb.unl.edu/teacher/nsf/c09/c09links/www.casahome.org/ozone.htm). These man-made emissions are more concentrated in urban and industrialized areas. It can induce breathing problems, reduce lung function, and aggravate asthma and other lung diseases.
Ozone varies from 0 (6:00) to 18 microgram/cubic meter (15:00). The mean value is 7.3 microgram/cubic meter against the standard of 100 micrograms/cubic meter. The average value is around 7% of the limiting standards FIG. 1. The variation of ozone in ambient air begins to rise in the morning and then decreases after the Sunset in the evening. Ozone concentration increases as the solar radiation and temperature increase during the day. The combination of a favorable environment and high nitrogen oxide emissions makes high ozone concentrations during the day. Solar radiation declines until sunset and the temperature also decreases. As nightfall approaches, there is a lower likelihood that ozone will form because there is not enough sunlight (ultraviolet radiation) to cause the reactions necessary to form ozone. The nitrogen oxide emissions thus serve an interesting role due to their abundance. Instead of contributing to ozone formation, the nitrogen oxides react with the ozone present in the atmosphere and cause a reduction of ozone concentrations during the nighttime. This occurs because nitrogen oxide molecules, in the absence of heat and strong sunlight, remove the third oxygen atom from the unstable ozone molecule.
Nitric oxide: At the point of discharge from man-made sources, nitric oxide, a colorless, tasteless gas, is the predominant form of nitrogen oxide. Nitric oxide is readily converted to much more harmful nitrogen dioxide by chemical reaction with ozone present in the atmosphere. Automobile exhaust has more NO than NO2, but once the NO is released into the atmosphere it quickly combines with oxygen in the air to form NO2 (http://www.windows2universe.org/physical_science/chemistry/nitrogen_oxides.html&edu=high) NO varies from 0.6 (5:00) to 1.3 μg/m3 (19:00). The average value is 0.9 μg/m3 FIG. 1.
Ammonia: Ammonia is a highly and soluble alkaline gas. It originates from both natural and anthropogenic sources. Anthropogenic sources include agricultural activities (manures, slurries and fertilizer application, break down and volatilization of urea) and non-agricultural sources namely catalytic converters in petrol cars, landfill sites, sewage works, composting of organic matter, combustion, industry, and wild mammals and birds [18].
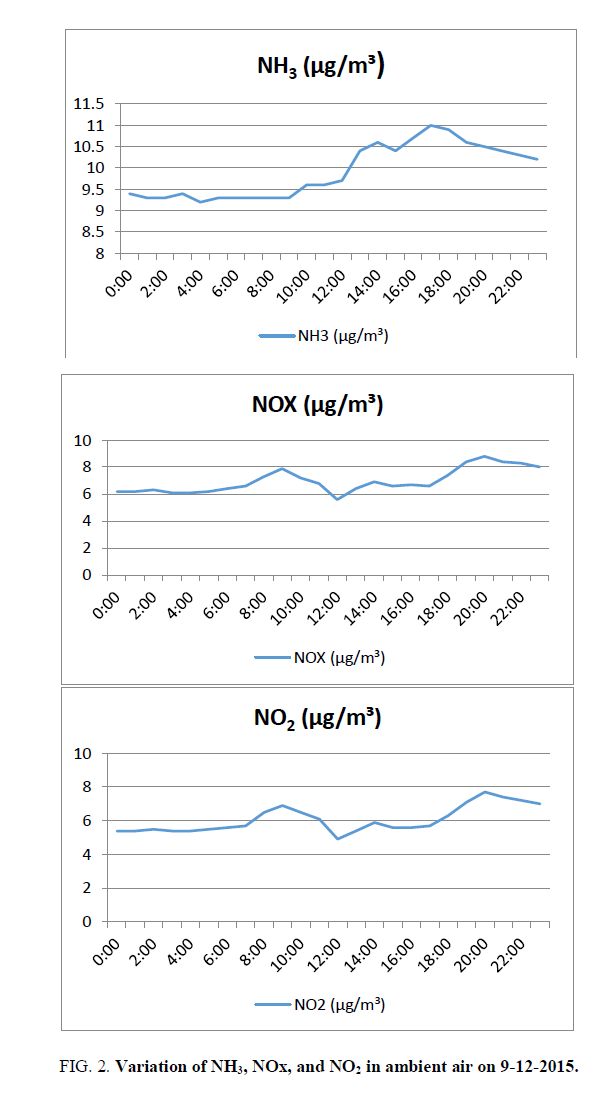
Ammonia varies from 9.2 (4:00) to 11 μg/m3 (17:00). The average value is 9.9 microgram/cubic metre against the standard of 100 μg/m3 FIG. 2. The average value is 10% of the limiting standard.
NOx: Nitrogen oxides (NOx) in the ambient air consist of Nitric oxide (NO), and Nitrogen dioxide. These two forms are significant pollutants of the lower atmosphere. Another form, nitrous oxide (N2O) is a greenhouse gas.NOx varies from 5.6 (12:00) to 8.8 μg/m3 (20:00). The average value is 7 μg/m3 FIG. 2.
Nitrogen dioxide: Nitrogen dioxide is a yellowish-orange to reddish-brown gas with a pungent, irritating odor, and it is a strong oxidant. The automobile exhaust is one of the largest sources of nitrogen dioxide emission in the ambient air, as these are formed during combustion as a result of oxidation of atmospheric nitrogen and organic nitrogen (http://www.yourarticlelibrary.com/air-pollution/7-air-pollutants-commonly-found-in-urban-atmosphere-of-india/19768/). The residence time of NO2 in the atmosphere is about a few days and is scavenged from the atmosphere through the formation of nitric acid, nitrites or nitrates and through their dry dissociation. The effect of NOx exposure on the respiratory system is similar to that of ozone and sulphur dioxide (https://fortress.wa.gov/ecy/publications/documents/0002008.pdf).
NO2 varies from 4.9 (12:00) to 7.7 microgram/cubic meter (20:00). The higher values of NO2 during morning and evening are in agreement with the finding that NO2 peaks coincide with traffic peaks (http://www.yourarticlelibrary.com/air-pollution/7-air-pollutants-commonly-found-in-urban-atmosphere-of-india/19768/). The average value is 6.1 micrograms/cubic meter against the standard of 80 micrograms/cubic meter FIG. 2, The average value is around 13% of the limiting standard.
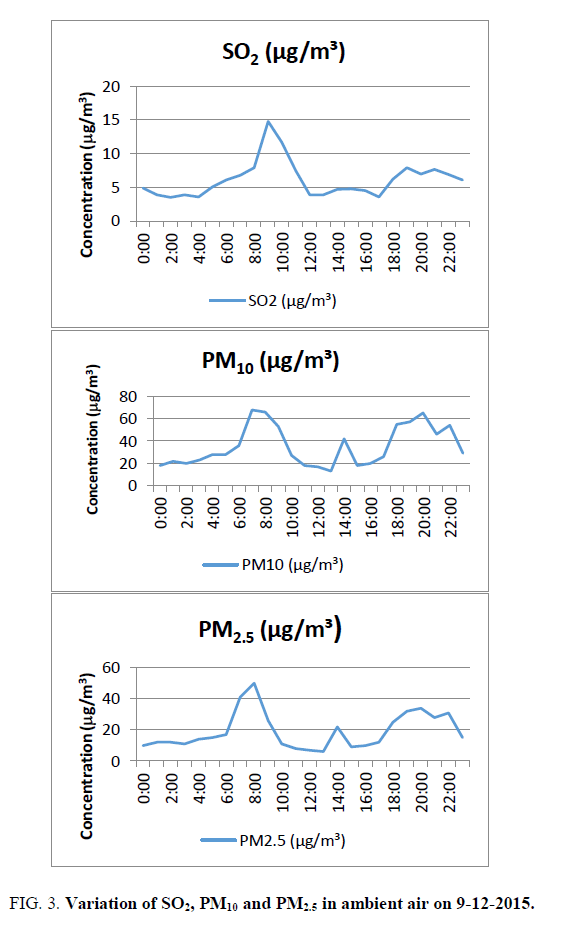
SO2: The anthropogenic sources of sulphur dioxide emission arise mainly from the combustion of fuels because of the trace amount of inorganic and organic sulphur contained in fossil fuels and ores. SO2 is emitted when fuel containing sulphur is burnt in diesel engines. Sulphur dioxide exposure constricts air passages, creating problems for people with asthma and for young children whose small lungs need to work harder than adult’s lungs (https://fortress.wa.gov/ecy/publications/documents/0002008.pdf). SO2 varies from 3.5 (2:00) to 14.8 microgram/cubic meter (9:00). The average value is 6.1 microgram/cubic meter against the standard of 80 micrograms/cubic meter. It is around 8% of the limiting standard FIG. 3, But it is 30.5% of the standards of 20 micrograms/cubic meter (24-hour mean) prescribed by WHO (2006).
Respirable particulate matter (PM10): PM with an aerodynamic diameter greater than 10 micrometers known as suspended inhalable particulate matter/Respirable Suspended Particulate Matter (RSPM or PM10), remains in the atmosphere for longer periods because of its low settling velocity [19]. Particulate matter includes microscopic particles and tiny droplets of liquid. Because of their small size, these particles are not stopped in the nose and upper lungs by the body’s natural defenses but go deep into the lungs, where they may become trapped and cause irritation (https://fortress.wa.gov/ecy/publications/documents/0002008.pdf). Exposure to particulate matter can cause wheezing and similar symptoms in people with asthma or sensitive airways. PM can serve as a vector of toxic air pollutants.
Large aerosol particles (usually 1 to 10 micrometer in diameter) are generated when the wind blows sea salt, dust, and other debris into the atmosphere (www.learner.org/courses/envsci/unit/pdfs/unit11.pdf). Fine aerosol particles with diameters less than 1 micrometer are mainly produced when precursor gases condense in the atmosphere. Major components of fine aerosols are sulphate, nitrate, organic carbon, and elemental carbon. Sulphate, nitrate, and organic carbon particles are produced by atmospheric oxidation of SO2,NOx, and VOCs.
Low wind speeds, high-pressure air masses, wind direction, high relative humidity, cooler temperatures, mixing heights, atmospheric stability, and winds aloft affect the accumulation of particulate matter. The longer the period of low wind speeds in an area, the greater the likelihood that particulate matter will accumulate (http://dwb.unl.edu/teacher/nsf/c09/c09links/www.casahome.org/ozone.htm). High-pressure air masses that last several days may create stagnant conditions that allow for the buildup of particulate matter levels. Accumulation will continue until a change in weather patterns brings less polluted air into the region. High relative humidity enhances the formation of nitrate and aerosol particles. Cooler temperatures promote nitrate formation in winter, and warmer temperatures promote sulphate formation in summer. If the mixing depth is shallow, mixing is restricted and particulate levels will become more concentrated.
High concentrations of aerosols are a major cause of cardiovascular disease and are also suspected to cause cancer. Fine particles are especially serious threats because they are small enough to be absorbed deeply into the lungs, and sometimes even into bloodstream (https://www.learner.org/courses/envsci/unit/pdfs/unit11.pdf). Emissions from motor vehicles do not only include exhaust particles, but also include abrasion products from tires, breaks, clutches, and the road’s surface. Particles are emitted by resuspension of previously deposited particles by vehicle induced turbulence.
Particles of 10 micrometers or less (PM10) particles can penetrate into the lungs and enter the bloodstream, which can cause heart disease, lung cancer, asthma, and acute lower respiratory infections. PM10 varies from 13 (13:00) to 68 (7:00) microgram/cubic meter. The average value is 35 microgram/cubic metre against the standard of 100microgram/cubic meter FIG. 3, It is 35% of the standard value. But it is 70% of the standards of 50 micrograms/cubic meter (24 hours mean) prescribed by WHO (2006).
PM2.5: PM2.5 can be formed in the atmosphere as aerosols from chemical reactions that involve gases such as SO2, NOx, and VOCs. Sulphates which are commonly generated by conversion from primary sulphur emissions make up the largest fraction of PM2.5 by mass. PM2.5 can be formed as a result of the solidification of volatile metals salts as crystals following the cooling of hot exhaust gases from vehicles in ambient air as well. Since the depth to which particulate matter can penetrate the respiratory system is dependent on size, fine particles (PM2.5) have a higher probability of deposition in the alveoli of the lungs and are associated with a greater health risk than larger particles (http://www.ivhhn.org/index.php?option=com_content&view=article&id=87). Particles of this small size also have residences times of days to weeks in the troposphere and can travel distances of hundreds to thousands of kilometers allowing them to be widely dispersed.
Recent studies suggest that, even at low levels (<100 micrograms/cubic meter), short term exposure to PM of any size range is associated with health effects, and that strong aerosol acidity or high sulphate content may contribute to the effects associated with PM2.5 (http://www.ivhhn.org/index.php?option=com_content&view=article&id=87). Epidemiological studies have shown that both daily mortality and hospital admissions increase with increasing particulate matter in the surface boundary layer and the effects fir PM2.5 are amplified over those for PM10.
PM2.5 varies from 6 (13:00) to 50 μg/m3 (8:00). The average value is 19 micrograms/cubic meter against the standard of 60 μg/m3 (FIG. 3). It is 32% of the standard prescribed by the Central Pollution Control Board. But it is 76% of the standards of 25 μg/m3 (24 hours mean) prescribed by WHO (2006).
Identification of factors influencing air quality
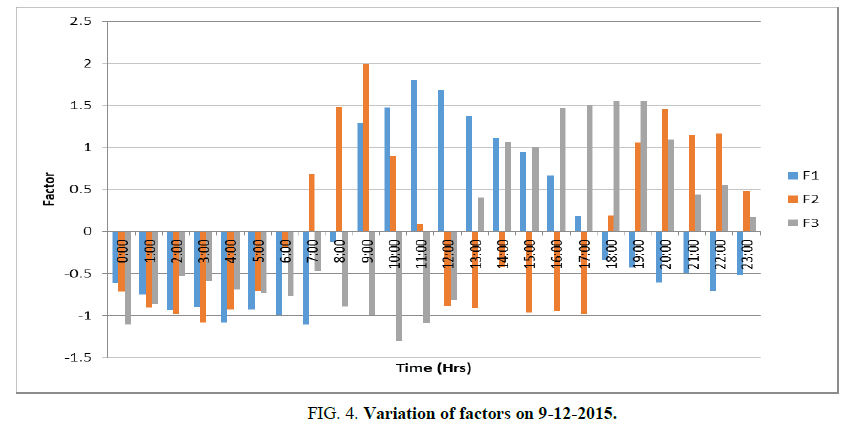
Principal components with Eigen values>1 are considered to be the most important components. Three components have Eigen value greater than 1. From the percentages of the total variances of the three extracted components accumulated, it is evident that these three components account for 84.6% of the original data. Thus, the complete variance of the data can be attributed to three components TABLE 2 and FIG. 4.
| Rotated Component Matrix | |||
|---|---|---|---|
| Component | |||
| 1 | 2 | 3 | |
| CO | -0.21 | -0.016 | -0.786 |
| Ozone | 0.908 | -0.187 | 0.285 |
| NO | -0.014 | 0.479 | 0.805 |
| NO2 | -0.082 | 0.874 | 0.309 |
| NOX | -0.075 | 0.841 | 0.427 |
| NH3 | 0.231 | 0.037 | 0.937 |
| SO2 | 0.285 | 0.84 | -0.224 |
| PM2.5 | -0.348 | 0.768 | 0.147 |
| PM10 | -0.321 | 0.807 | 0.231 |
| ATC | 0.921 | 0.107 | 0.313 |
| RH | -0.942 | 0.046 | -0.259 |
| WS | 0.719 | -0.273 | 0.511 |
| WD | -0.466 | -0.155 | -0.584 |
| SR | 0.933 | -0.016 | -0.207 |
| BP | 0.184 | 0.889 | -0.233 |
Table 2: Rotated Component Matrix of air quality data on 9-12-2015.
Factor 1 (F1) explains 30.7% of the total variance, is mainly contributed by Ozone (0.908), air temperature (0.921), relative humidity (-0.942), wind speed (0.719), and solar radiation (0.933). F1 has a strong positive factor loading with ozone, temperature, wind speed, and solar radiation. F1 is denoted as the Ozone pollution factor. It increases with temperature, wind speed and solar radiation. This is in agreement with the finding of Tarasova OA et al. [20] that 70% of the day-to-day ozone variability could be explained by changes in temperature, relative humidity, and wind speed [21] indicated that 67% of the variation in ozone concentrations during the summer of 2002 could be accounted for by changes in temperature, solar radiation, and wind speed. The studies indicate that considerable variability of ozone concentration is not only as a result of changes in precursor emissions but also of meteorology [22,23]. A low wind speed of less than 3 m/s prevailing in the area favors the formation of ozone. This is in agreement with the finding of Husar RB et al. [24] that at low wind speeds (<3 m/s), ozone levels do not vary substantially with wind direction and that the highest concentrations are found in the northeastern urban corridor. The ozone level in Madras is also in conformity with the present finding [25]. As per FIG. 1, Ozone pollution factor began to increase at 9 AM and becomes a maximum at 11 AM and then it began to decrease and reached the minimum at 5 PM.
Factor 2 (F2) explains 30.6% of the total variance, being mainly contributed by NO2 (0.874),NOx (0.841), SO2 (0.84), PM2.5(0.768), PM10 (0.807), and barometric pressure (0.889). F2 has strong positive factor loading with NO2, NOx, SO2, with PM2.5, and PM10 and barometric pressure. F2 is termed as Aerosol pollution factor. This indicates the association of NO2, NOx, SO2, with PM2.5, and PM10. It also depends on barometric pressure. The rise in particulate matter with barometric pressure is in agreement with the finding of Langner M et al. [26]. Aerosol pollution factor begins to rise at 7 AM, increases to a maximum at 9 AM and it reduces to a minimum at 11 AM. Again it begins to increase at 6 PM, becomes maximum at 8 PM and then it begins to reduce to a minimum at 12 Midnight. From the above, it can be seen that the influence of ozone pollution becomes less at the time of aerosol pollution. Aerosol pollution is more intense in the early morning before the occurrence of ozone pollution and in the late evening.
Factor 3 (F3) explains 23.3% of the total variance, being contributed by NO (0.805), CO (-0.786),NOx (0.427), ammonia (0.937), wind speed (0.511), and WD (-0.584). F3 has a strong factor loading with nitric oxide and ammonia. It has a mean positive factor loading with wind speed and negative mean factor loading with WD. F3 is termed as Methane pollution factor. The variation of CO with NH3 and NO can be observed. This is in agreement with the finding of NASA. According to NASA, CO readily reacts with the hydroxyl radical (OH) forming a much stronger, greenhouse gas removed from the atmosphere is when it reacts with hydroxide, and hence the formation of carbon dioxide leaves fewer OH for methane to react with thus increasing methane’s concentration.s-carbon dioxide. This, in turn, increases the concentration of methane, and another strong greenhouse gas, because the most common way methane is removed from the atmosphere is when it reacts with hydroxide, and hence the formation of carbon dioxide leaves fewer OH for methane to react with thus increasing methane’s concentration.
Ozone pollution can be reduced by emission from cars, trucks, gas-powered lawn, and garden equipment, boats, and other engines by keeping equipment properly tuned and maintained. During the summer, fill the gas tank during the cooler evening hours, and careful not to spill gasoline. Reduce driving, carpool, use public transportation, walk, or bicycle to reduce ozone pollution, especially on hot summer days. Low VOC paints and solvents shall be used and shall be ready to read labels for proper use and disposal.
Conclusion
The study was conducted to assess the threat to air quality in a tropical region. The study reveals that the concentration of carbon monoxide, PM10, and PM2.5is nearing to the limiting standards. Hence immediate attention is to be paid for the reduction of these parameters. The factor analysis reveals that the Ozone pollution factor, Aerosol pollution factor, and Ammonia pollution factors are the main factors controlling the ambient air quality. The ozone pollution factor is intense during day time. It increases with temperature, wind speed and solar radiation. The aerosol pollution factor becomes intensive during the early morning and late evening, whereas the Ammonia pollution factor becomes intense in the evening. Aerosol pollution is more intense in the early morning before the occurrence of ozone pollution and in the late evening. CO readily reacts with the hydroxyl radical (OH) forming a much stronger, greenhouse gas-carbon dioxide. This, in turn, increases the concentration of methane, because the most common way methane is removed from the atmosphere is when it reacts with hydroxide, and hence the formation of carbon dioxide leaves fewer OH for methane to react with thus increasing methane’s concentration.
References
- Saxena RC, Thirumurthy G, Puri M. Status of the vehicular pollution control programme in India. Central Pollution Control Board, East Arjun Nagar. 2010.
- Vlaanderen JJ, Janssen NA, Hoek G, et al. The impact of ambient air pollution on the human blood metabolome. Environ Res. 2017;156:341-48.
- Gupta GP, Kulshrestha. Biomonitoring and remediation by plants. In: Kulshrestha U, Saxena P (eds). Plant Res Air Pol. 2016:119-32.
- Nelson FP, Tibbett RA, Day SJ. Effects of vehicle type and fuel quality on real-world toxic emissions from diesel vehicles. Atmos Environ. 2008;42:291-303.
- Schauer JJ, Lough CG, Shafer MM, et al. Characterization of metals emitted from motor vehicles. Research report. Health Effects Institute. 2006.
- Li S, Feng K, Li M. Identifying the main contributors of air pollution in Beijing. J Clean Prod. 2017;163:S359-65.
- Giuntoli J, Caserini S, Marelli L, et al. Domestic heating from forest logging residues: environmental risks and benefits. J Clean Prod. 2015;99:206-16.
- Chen J, Li C, Ristovski Z, et al. A review of biomass burning: Emissions and impacts on air quality, health, and climate in China. Sci. 2017;579:1000-34.
- Zhang T, Wooster JM, Green CD, et al. New field-based agricultural biomass burning trace gas, PM2.5, and black carbon emission ratios and factors measured in situ at crop residue fires in Eastern China. Atmos Environ. 2015;121:22-34.
- Diapouli E, Manousakas M, Vratolis S, et al. Evolution of air pollution source contributions over one decade, derived by PM10 and PM2.5source apportionment in two metropolitan urban areas in Greece. Atmos Environ. 2017;164:416-30.
- Guttikunda KS, Goel R, Pant P. Nature of air pollution, emission sources, and management in the Indian cities. Atmos Environ. 2014;95:501-10.
- Larssen S, Gronskei KE, Hanegraaf MC, et al. Urban air quality management strategy in Asia-Guidebook. Asia Environment and Natural Resources section. 2016.
- Sehgal M, Suresh R, Sharma VP, et al. Variation in air quality at fuel refilling stations in Delhi. Int J Environ. 2011; 68(6):845-49
- WHO Air quality guidelines for particulate matter, ozone, nitrogen dioxide and sulfur dioxide. 2006.
- https://ccacoalition.org/en/resources/case-studies-improving-urban-air-quality
- Greenstone M, Nilekani J, Pande R, et al. Lower pollution. Longer lives life expectancy gains if India reduced particulate matter pollution. Econ Polit Wkly. 2015;1(8):40-6.
- CPCB. National ambient air quality status and trends in India-2010: Central Pollution Control Board, New Delhi. 2012.
- Wilson LJ, Bacon PJ, Bull J, et al. Modeling the spatial distribution of ammonia emissions from sea birds in the UK. Environ Pollut. 2004;131:173-85.
- Shivaji B. Effect on human health and mitigation measures. Vehicle Engineering. 2013;1(2).
- Tarasova OA, Karpetchko AY. Accounting for local meteorological effects in the ozone time-series of Lovozero (Kola Peninsula). Acp. 2003;3:941-49.
- Andric k, Brana JE, Gvozdic V. Impact of meteorological factors on ozone concentrations modeled by time series analysis and multivariate statistical methods. Ecol Inform. 2009;4(2):117-22.
- Pekey B, Ozaslan U. Spatial distribution of SO2, NO2, and O3 concentrations in an industrial city of Turkey using a Passive Sampling Method. Clean-Soil Air Water. 2013;41:423-28.
- Psiloglou B, Larissi I, Petrakis M, et al. Case studies on summer time measurements of O3, NO2, and SO2 with a DOAS system in an Urban Semiindustrial Region in Athens. Environ Monit Assess. 2013;185:7763-74.
- Husar RB, Renard WP. Ozone as a function of local wind direction and wind speed: evidence of local and regional transport. Elsevier. 1997
- Pulikesi M, Baskaralingam P, Elango D, et al. The effects of weather on surface ozone formation. Ecosyst Serv. 2005.
- Langner M, Draheim T, Endlicher W. Perspectives in urban ecology. Springer-Verlag. 2011.
