Original Article
, Volume: 16( 1)Highly Sensitive Square Wave Voltammetric Technique for Determination of Nepafenac in Bulk Powder, Pharmaceutical Dosage Form and Blood Serum
- *Correspondence:
- Ahmed K Heliopolis University for Sustainable Development, Belbis road, Cairo, Egypt, Tel: 002-010-0333-6797; E-mail: dr.kholoud.ahmedalhabashy@gmail.com
Received Date: January 02, 2018 Accepted Date: January 18, 2018 Published Date: January 22, 2018
Citation:Daabees HG, Talaat W, El-Shal M, et al. Highly Sensitive Square Wave Voltammetric Technique for Determination of Nepafenac in Bulk Powder, Pharmaceutical Dosage Form and Blood Serum. Int J Chem Sci. 2018;16(1):242
Abstract
It introduces a square wave voltammetric (SQV) technique for the determination of Nepafenac in pharmaceutical dosage form and human serum with accepted accuracy and precision to be applied for routine analysis of nepafenac. Carbon paste (CPE) electrode is modified with carbon multiwalled nanotube (CMWNT), 1-n-butyl-3-methylpyridinium hexafluorophosphate ion crystal (BMH) and sodium dodecyl sulfate (SDS), [(CMWNT-BMH-SDS) electrode], for determination of NPF in bulk powder, pharmaceutical dosage form and biological fluid. The proposed voltammetric technique was established on electro-oxidation of nepafenac at (CMWNT-BMH-SDS) electrode in 0.04 M B-R electrolyte with pH=7.0. All procedures were performed in 0.04 M B-R electrolyte with pH=7.0. Experimental and instrumental parameters for quantitative determination were optimized. The peak current concentration relationship was rectilinear over the range 0.333-6.327 μg/mL. Detection and quantification limits were found to be 0.081 and 0.272 μg/ml, respectively. Precision and accuracy for the suggested method were checked by recovery studies with acceptable repeatability and reproducibility, the suggested method was applied successfully to the dosage form and human serum. The suggested electrode was considerably stable. Electrode preparation is easy, simple and available surface renewal. The modified electrode demonstrated higher selectivity towards nepafenac in routine analysis.
Keywords
Square wave voltammetry; Ionic crystal; Nepafenac; Surfactant and biological fluid
Introduction
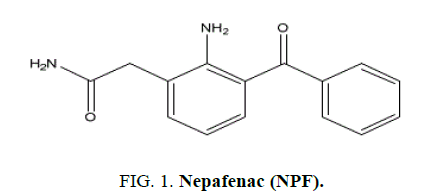
Nepafenac (NPF), 2-amino-3-benzoyl benzene acetamide, is non-steroidal anti-inflammatory drug (NSAID) prepared as an ophthalmic suspension dosage form. NPF is the pro-drug of amfenac, very effective nonselective cyclo-oxygenase COX-1 and COX-2 inhibitor. It is used to treat and prevent ocular pain and inflammation that can be present after cataract surgery by lowering the production of prostaglandins in the eye [1,2].
The removal of diclofenac sodium ophthalmic solution as a viable pharmaceutical entity in September 1999 from the US market gained considerable interest in the general safety and effectiveness of topical ophthalmic NSAIDs for treatment of anterior segment inflammation. In late 1999 the use of topical ocular NSAIDs decreased in the US as result of incidents involving corneal melts and toxicity surrounding use of generic diclofenac. However, since removal of diclofenac sodium ophthalmic solution from the market place, ophthalmic NSAIDs have regained use as viable pharmacotherapeutic entities. Moreover, new ophthalmic NSAID products have recently been introduced for commercial use in the US including the novel chemical entity NPF [3].
The purpose of this report is to revisit the use of topical ophthalmic NSAIDs for the treatment of surgically induced anterior segment inflammation with focus on NPF. NPF is a prodrug deaminated to amfenac, a highly effective non-selective cyclo-oxygenase inhibitor. In the case of topical ophthalmic NSAIDs, practitioners should carefully weigh the cost-benefit of implementing “highly potent” new drug products because perturbations in pharmacodynamic response due to the inherent novelty in terms of chemical designs may outweigh the demonstrated replicative pharmacologic action of all topical ophthalmic NSAIDs [3].
NPF was determined in ophthalmic dosage form using several methods including UV spectrophotometry [4-6], HPLC [6-9]. Many of the reported methods require the use of sophisticated equipment and expensive reagents. Some are exhausting, requiring prolonged sample pretreatment, strict control of pH and long reaction times. Chemically modified electrodes (CMEs) have recently gained interest due to their prominent advantages such as providing noticeable peak current and lowering overpotential for redox systems. Modification of electrodes with several modifiers such as transition metal complexes [10], nanostructures [11], molecular sieves [12] and organic compounds [13] has been reported in recent years. The carbon paste electrode (CPE), which is made of graphite and organic liquids, has been widely applied in the electroanalytical field because its cheap, easily fabricated, highly sensitive and possesses renewable surface [14-16]. To improve the sensitivity, selectivity, detection limit and other parameters of CPE, chemically modified carbon paste electrodes (CMCPEs) have been used [17-19]. The operation mechanism of such CMCPEs depends on the properties of the modifier used to improve selectivity and sensitivity for the target drug [20].
Ion liquid crystals have importance recently as it improves determination of drugs in voltammetry. Carbon electrodes modified with ionic crystals introduce benefits over ordinary CPEs, such as marked conductivity and sensitivity and rapid electron transfer. Ionic liquid modified electrodes proved good electro catalytic activities and used in several applications as in electrochemistry [21].
Gold nanoparticles, with large surface area, better biocompatibility, improved conductivity and electro catalysis properties, have been used to improve the detection limits in electrochemical studies [22-26]. They are suitable for surface immobilization and can act as tiny conduction centers and facilitate electron transfer [15,16,27-32]. In the present study, Carbon paste (CPE) electrode is used (Figure 1). CPE was modified with carbon multiwalled nanotube (CMWNT), 1-n-butyl-3-methylpyridinium hexafluorophosphate ion crystal (BMH) and sodium dodecyl sulfate (SDS) for determination of NPF in bulk powder, pharmaceutical dosage form and biological fluid.
Experimental
Chemicals and reagents
NPF was supplied from Orchidia company, potency was certified to be 101.7%. Nevaxal® eyedrops labeled to contain 1 mg/5 mL NPF from Orchidia company (Cairo, Egypt) were purchased from local market. A stock solution of 100 μg/mL NPF was freshly prepared by dissolving the weighed amount 5 mg in 50 ml methanol (HPLC grade) and stored in refrigerator 4°C. Britton-Robinson (B-R buffer) of concentration 0.04 M was prepared by mixing phosphoric acid, acetic acid and boric acid [33] with appropriate amount of 0.1 M NaOH to obtain the desired pH range (2-10). Sodium dodecyl sulphate (SDS) was prepared as 1 × 10⁻³ M solution in distilled water. All solutions were prepared from analytical grade chemicals and deionized water. All materials and reagents were used as received without further purification.
Instrumentation
Voltammetry measurement: Voltammetric experiments were performed using Metrohm electro analyzers Model 797VA Computrace. The measurements recorded using VA Computrace version 1.3.1 (Metrohm), running under windows 7. The three electrodes system consisted of working electrode, Ag/AgCl (3 M KCl) electrode as the reference electrode, and a platinum wire as the auxiliary electrode. A JENWAY 3510 pH meter (England) with glass combination electrode was used for pH measurements. The pH was calibrated using standard buffer pH (2-9). A Mettler balance (Toledo-AB104) was used for weighing the solid materials, U.S.A. A micropipette (Eppendorf-multi pipette plus) was used throughout the experimental work, German. Ultrasonic Cleaner, United Jeveiry Tool Supplies, model UTA-60, 6L capacity, Italy. Deionized water used throughout the present study was supplied from a burette still plus deionized connected to a Hamilton-Aquametric deionized water system, U.K. All experiments were carried at an ambient temperature of 25 ± 1°C.
Impedance spectroscopy measurements: Electrochemical impedance spectroscopy was performed using a Gamry-750 system and a lock-in-amplifier that are connected to personal computer. The data analysis software was provided with the instrument and applied non-linear least square fitting with Levenberg-Marquardt algorithm.
The parameters in electrochemical impedance experiment were as follows: different potential values ranging from 0.890 V to 0.950 at frequency range of 0.1-100000 Hz with amplitude of 5 mV, were applied on the prepared electrodes.
Preparation of the electrodes
Preparation of the bare CPE: Carbon paste electrode (CPE) was prepared by mixing graphite powder (0.5 g) with paraffin oil (0.3 mL) in a glassy mortar. The carbon paste was packed into the hole of the electrode body and smoothed on a filter paper until its shiny appearance.
Preparation of the modified CPE with CMWNT: CPE modified with 10% CMWNT was prepared by hand mixing 202.5 mg graphite powder, 22.5 mg CMWNT and 0.14 ml paraffin oil in an agate mortar to get homogeneous carbon paste. The carbon paste was packed into the hole of the electrode body and smoothed on a filter paper until a shiny appearance was achieved.
Preparation of the modified CPE with BMH ionic crystals (BMH-CPE): CPE modified with BMH ion crystals were prepared by hand mixing different ratios of (10%) w/w BMH ion crystals with suitable percentage of graphite powder to complete to 225 mg and pasted with 145 mg paraffin oil in an agate mortar to get homogeneous carbon paste. The carbon paste was packed into the hole of the electrode body and smoothed on a filter paper until a shiny appearance was achieved.
Preparation of the modified CPE with CMWNT, BMH ion crystals and SDS (CMWNT-BMH-SDS): CPE modified with 10% CMWNTT and 10% BMH ion crystals was prepared by hand mixing a ratio of 22.5 mg w/w CMWNT and 22.5 mg w/w BMH ion crystals with suitable percentage of graphite powder to complete to 225 mg and pasted with 145 mg paraffin oil in an agate mortar to get homogeneous paste. The modified paste was packed into the hole of the electrode body and smoothed on a filter paper until a shiny appearance was achieved. The surface of the electrode was wetted with 20 μl of the prepared SDS solution and allowed to dry in air without being touched.
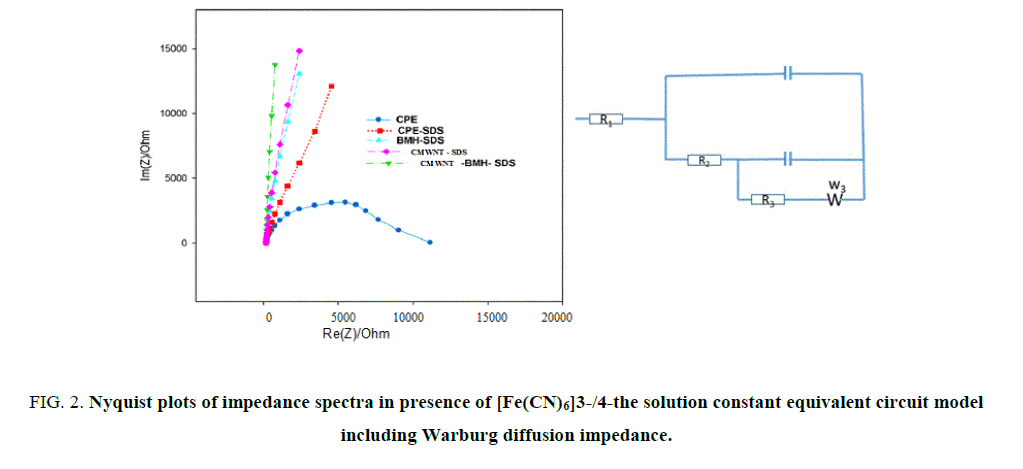
Electrochemical impedance spectroscopy (EIS) studies: EIS technique is precise important tool to investigate the interface electro properties of surface electrodes. EIS outcomes data were achieved at ac frequency varying range between 0.1 Hz and 100 kHz. As exposed in Figure 2 (A, B), the impedance responses of K4 [Fe(CN)6] display great difference between the five electrodes, Impedance plots are shown as Nyquist plots, it displays a semicircle at high frequency and a line at low frequency. The semicircle agrees to a charge transfer resistance and the line corresponds to a diffusion route. The better model applied to fitting the experimentations (Figure 3) is a two-time steady model 41-44 involves of Rs (solution resistance), R1, R2 (resistances of inner and outer layers, respectively) W (Warburg impedance) and C1, C2 (capacitances of inner and outer layers, respectively).
The data simulated to this equivalent circuit with a reasonable fit (2% average error). W is related to the linear region at low frequency (diffusion process), R1, R2 are related to the semicircle at high frequency (charge transfer resistances of inner and outer layers, respectively). So, the reaction mechanism depends on both charge transfer and diffusion process. The fitting performed using EC-Lab® software45. Table 1 lists the impedance fitting parameters for the five electrodes. The CMWNT-BMH-SDS electrode shows higher value for the inner capacitance (5.113 μF), Warburg impedance (1158 Ω s-1/2) and lower values for the charge transfer resistance (184 Ω) indicating a higher conductivity compared to other electrodes (3000 Ω). These results indicate well the highest peak of oxidation current obtained from CV’s results to CMWNT-BMH-SDS electrode (Table 1).
| Rs (Ohm) | R1 (Ohm) | R2 (Ohm) | C1 (µF) | C2 (µF) | S2 (Ohm.s-0.5) | X2 | x/n0.5 | |
|---|---|---|---|---|---|---|---|---|
| CPE | 220 | 592 | 5 384 e-3 | 3.37 | 3.665 | 1 341 | 0.240 | 0.085 |
| CPE-SDS | 776.1 | 989.9 | 1.22 e-3 | 1.757 | 1.323 | 1299 | 0.073 | 0.047 |
| CMWNT-SDS | 245.1 | 721.3 | 1.121 e-3 | 2.813 | 2.306 | 1202 | 0.039 | 0.038 |
| BMH-SDS | 235 | 944.6 | 0.603 e-3 | 4.813 | 2.182 | 2291 | 0.044 | 0.041 |
| CMWNT-BMH-SDS | 184.8 | 668 | 0.574 e-3 | 5.113 | 4.744 | 1158 | 0.032 | 0.033 |
Table 1. Electrochemical impedance spectroscopy fitting data corresponding to Figure 2 (A, B).
Recommended experimental procedure
Assay of pure form
In the electrochemical measurements, voltammetric analyses were performed in 15 ml of B-R buffer solution at all prepared electrodes, respectively. Appropriate aliquots of the drug solution of NPF were introduced into the electrolytic cell while 8 mm of CPE was immersed into the supporting electrolyte, the calibration curves of NPF using Square Wave voltammetric technique were constructed by plotting the peak current I (μA) against drug concentration (μg/mL) for the first anodic peak which appeared nearly at 0.89 V to 0.95 V as it introduced better, narrower, sharper symmetrical and smooth peaks without noise with the calibration experiment.
Analysis of pharmaceutical dosage form: A portion of 1 mL suspension of Nevaxal® eyedrop were carefully transferred in a 10 mL volumetric flask and diluted to the mark with methanol then filtered to prepare a stock concentration of 20 μg/mL. The amount of NPF was calculated using the linear regression equation obtained from the calibration curve of pure NPF [34].
Standard addition technique: Standard addition technique was applied by adding different additions of standard solution to a fixed concentration of drug dosage solution. The amount of NPF was calculated using the linear regression equation obtained from the calibration curve of pure NPF [34].
Application to human spiked serum samples: Drug-free human blood Samples gotten from healthy volunteers (after having obtained their written consent), was centrifuged (4000 rpm) for 15 min at room temperature and separated serum samples were stored frozen until assay. After thawing, an aliquot appropriate volume of sample was fortified with NPF dissolved in bi-distilled water to required concentration and preserved with 0.5 ml of acetonitrile as serum protein precipitating agent, then the volume completed to 2 ml with serum sample. The tubes were vortexed for 50 sec. and then centrifuged 5 min. at 4000 rpm for getting rid of protein residues. The supernatant was taken carefully. Appropriate volume of supernatant liquor was transferred in the voltammetric cell containing supporting electrolyte. Voltammograms were recorded as in pure NPF. Different amounts of acetonitrile were tried. The best results were obtained with 0.5 ml acetonitrile. The concentration of NPF was varied in human serum samples. Quantifications were performed by means of calibration curve method from the related calibration equation.
Results and Discussion
Electrodes surface morphology study
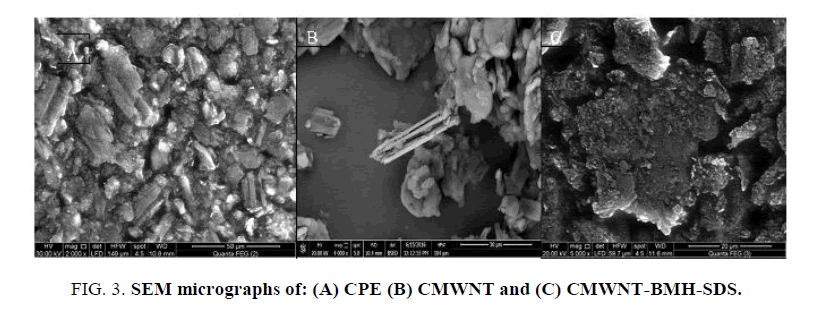
The surface morphology of modified sensors greatly affected the efficiency and the catalytic performance headed for NPF oxidation. Figure 3 (A-C) shows the SEM of CPE, CMWNT and CMWNT-BMH-SDS respectively. The SEM of CPE electrode displayed discrete asymmetrical graphite peel (Figure 3A). Upon modification with CMWNT, smooth superficial nanostructures have been formed (Figure 3B). The presence of CMWNT and BMH achieved a blurred character with superior surface area, modest viscosity and marked high conductivity. The presence of the exceedingly conductive ionic liquids crystal (ILC) between the graphite flakes affected greatly the conductivity of the paste and moreover achieved more well-ordered films because of the solid structure of ILC and its distinctive molecular orientation so ILC plays main dual roles as a binder and a link or ions transferor among the graphite fragments improving the conductivity of the film. In case of the existence of SDS, squishy films of SDS were collected at surface of electrode (Figure 3C). These films assisted the accumulation of NPF drug on the surface.
Electrochemical behavior of NPF
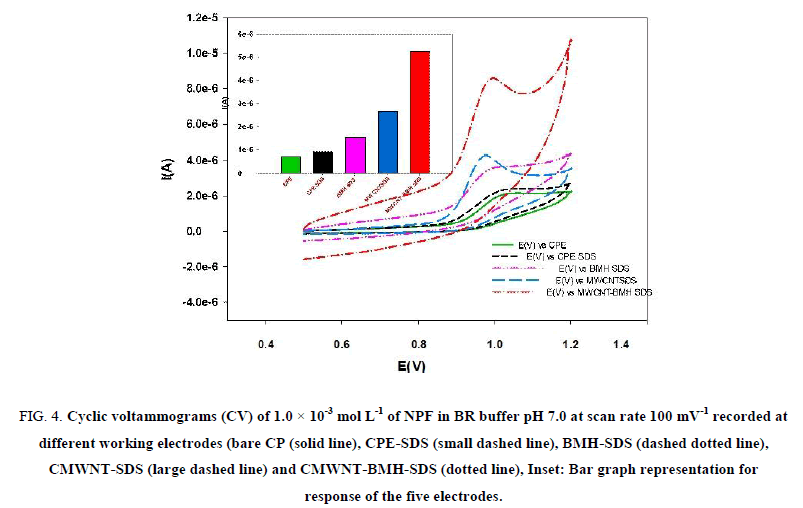
The voltammetric behavior of NPF was recorded in the range of 500 mV to 1200 mV using CV. Figure 4 shows representative cyclic voltammograms of NPF in B–R buffer pH 7, at a scan rate of 100 mV s-1 recorded at five different working electrodes: (bare CPE), (CMWNT-CPE), (BMH-CPE) and (CMWNT-BMH-CPE). For bare CPE the anodic peak oxidation of NPF appeared at 936 mV. The electrochemical reaction kinetics was studied by CV at CWNT-BMH-CPE where Ep=936 mV (with current value of 0.711 μA) and Ep=913 mV (with current value of 5.211 μA), which is higher than the current observed at CPE.
Figure 4: Cyclic voltammograms (CV) of 1.0 × 10⁻³ mol L-1 of NPF in BR buffer pH 7.0 at scan rate 100 mV-1 recorded at different working electrodes (bare CP (solid line), CPE-SDS (small dashed line), BMH-SDS (dashed dotted line), CMWNT-SDS (large dashed line) and CMWNT-BMH-SDS (dotted line), Inset: Bar graph representation for response of the five electrodes.
The increased peak current indicated that the CMWNT contributed to NPF electro catalysis by increasing the surface area. In addition, BMH can assist the direct electron transfer between the drug and the electrode surface. Moreover, when CMWNT-BMH-SDS was used, an increase in the current response was observed as the anodic peak current increased to value of 66 mA. It was most likely that there was an electrostatic attraction between the cationic NPF and the anionic BMH which enhances the diffusion of NPF through the electrode surface. Also, there was interaction between the positively charged NPF and anionic BMH which enhances hydrogen bond formation between NPF and BMH and promotes faster electron transfer kinetics. The schematic representation for the interaction of the CMWNT-BMH-SDS electrode with NPF is illustrated in the following Figure 4.
Effect of operational parameters
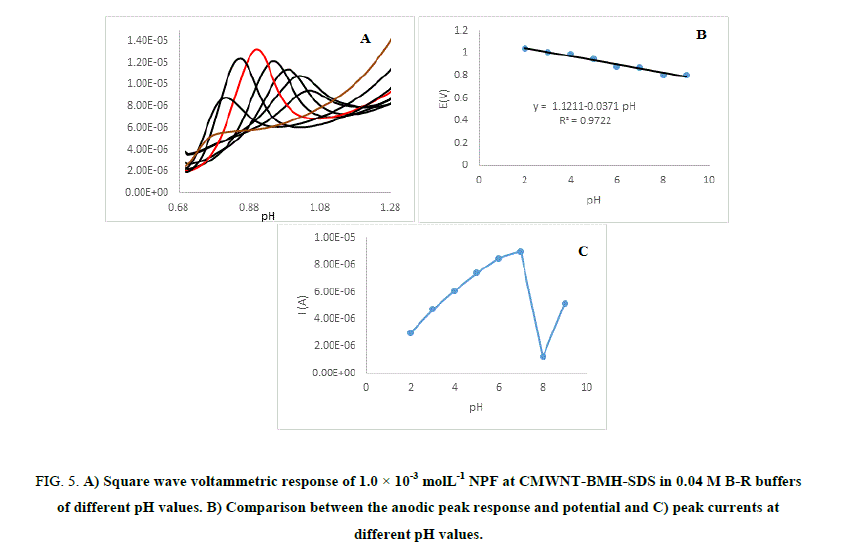
Effect of solution pH: The effect of electrolyte pH on the oxidation of NPF at CMWNT-BMH-SDS was studied by the square wave voltammograms techniques using B–R buffer within the pH range of (2-9) shown in Figure 5 (A-C). The anodic peak potentials lifted negatively with the rise in the electrolyte pH, indicating that the oxidation of NPF is a pH-reliant reaction and displaying that protons have occupied part in the electrode reaction routes.
Figure 5: A) Square wave voltammetric response of 1.0 × 10⁻³ molL-1 NPF at CMWNT-BMH-SDS in 0.04 M B-R buffers of different pH values. B) Comparison between the anodic peak response and potential and C) peak currents at different pH values.
The correlation between the anodic peak potential and the solution pH value with the pH range of 2-9 could be fitted into the linear regression equation E (V)=1.121–0.0371 pH, with a correlation coefficient r=0.9722. NPF anodic current responses gave highest value at pH 7 and at high pH values the current responses were higher than those at low pH values; this is due to the pKa value of NPF which is 9.08 therefore, NPF can be attracted by the negative charges of the electrode. The highest oxidation peak current was obtained at pH 7.0. Thus pH 7.0 was employed for the determination of NPF to achieve higher sensitivity.
Mechanism: In the proposed method, the electro-oxidation of NPF involves one electron and one proton transfer process, the plausible mechanism is as shown in Figure 6. Here the amino group (-NH2) is attached to the carbon atom (C-2) of the benzene ring. During electrolysis when the first proton is removed, nitrogen losses one negative charge and an anionic species is formed. To stabilize the anionic form, hydrogen atom attached to the carbon (C-2) of the cyclohexane undergoes further electro oxidation and stable product 7-oxo paclitaxel is formed.
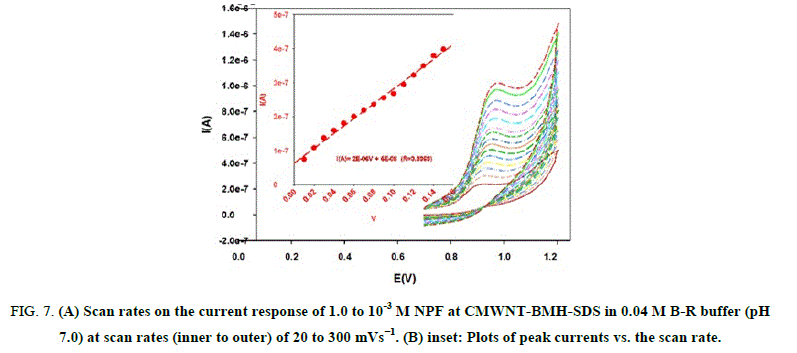
Effect of scan rate: Effect of different scan rates on the current response of 1.0 x 10⁻³ M NPF at CMWNT-BMH-SDS in 0.04 M B–R buffer (pH 7.0) was investigated (Figure 7). A plot of current peak height (I μA) versus of scan rate (ν) resulted in straight linear relation for scan rate of 20 mV s-1 to 300 mV s-1 with correlation coefficient r=0.9969 (Figure 7). This indicated that the charge transfer was partially under adsorption control.
Figure 7: (A) Scan rates on the current response of 1.0 to 10-3 M NPF at CMWNT-BMH-SDS in 0.04 M B-R buffer (pH 7.0) at scan rates (inner to outer) of 20 to 300 mVs−1. (B) inset: Plots of peak currents vs. the scan rate.
The redox peak currents increased with the linear regression as: I (A)=2E-06 V+6 E-08 (r=0.9969). The Tafel plot was drawn by using the increasing part of the current-voltage curves of NPF inspected at a scan rate of 10 mV s-1. This part of voltammograms, identified as the Tafel area, is influenced by electron transfer kinetics between the substrate molecule (NPF) and CMWNT-BMH-SDS surface, Anodic Tafel slope=n (1-α) F/2.3RT .The slope of this plot was 5.929 mV. This slope indicates a transfer coefficient of α=0.64 for a one electron transfer process.
Effect of deposition time: The choice of the deposition time is related to the current response of NPF using CMWNT-BMH-SDS in B–R buffer pH 7 (Figure 7). By increasing the deposition time, the signal increases until saturation of the signal (t=80 sec). After 80 sec. deposition time, the current decreases.
Effect of deposition potential: The interfacial adsorptive character of NPF was studied by CV technique. The effect of deposition potential as a function of the peak current was evaluated at a concentration level of 5 μg/mL showing -300 mV to be the best value to be applied in whole experiments NPF as shown in Figure 7. The adsorptive peak current at the electrodes' surfaces appear to be dependent on the deposition potential.
Diffusion coefficients of NPF: The reliance of the peak current density with scan rate is used for the investigation of the “apparent” diffusion coefficient (Dapp) for NPF. Dapp value were studied by using Randles Sevcik equation [35]. If the solution is at 25°C, Ip=268, 600 n 3/2 AD1/2 Cv1/2 Where the constant parameters have units (i.e., 1.982 × 10⁻⁶ C mol-1V-1/2), Ip is the peak current charge density (mA cm-2), n is the number of electrons acting in the half-reaction on behalf of the redox pair, v is sweep rate at which the potential is swept (V s-1 10-6 mol cm-3), A is the electrode area (0.085 cm-2), and D is the diffusion coefficient (cm-2 s-1) of electro active compound. Dapp of NPF at CMWNT-BMH-SDS in 0.04 M B–R buffer (pH 7.0) calculated using CV technique and was found to be 1.62 × 10⁻⁵ cm-2 s-1. This indicated that the fast electron transferal process of the measured species compounds at interface between the electrode surface and the solution.
Validation of the Proposed Method
International Conference on Harmonization (ICH) guidelines for method validation were followed for validation of the suggested method.
Linearity and range
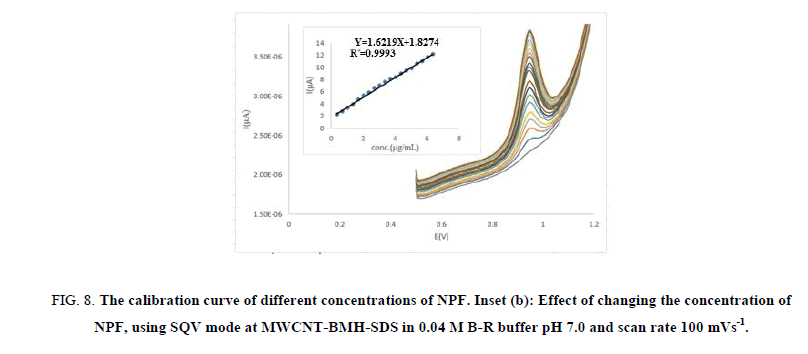
For quantitative drug determination, we designated the SQV technique because the peaks are sharp. SQV technique was achieved using CMWNT-BMH-SDS electrode in 0.04 M B-R buffer at pH 7.0 solution containing different concentrations of NPF as illustrated in Figure 8 (A, B). The calibration graph range was carried out through consideration of the essential practical series to contribute to accurate, precise and rectilinear consequences. The calibration range of the suggested technique is specified in Table 2. The results displayed that the peak height currents of NPF oxidation at the surface of CMWNT-BMH-SDS were linear dependent on the NPF concentrations, over the range of 0.333 μg/ml-6.327 μg/ml with a slope 1.6219 μA and correlation coefficient of 0.9993, respectively.
Figure 8: The calibration curve of different concentrations of NPF. Inset (b): Effect of changing the concentration of NPF, using SQV mode at MWCNT-BMH-SDS in 0.04 M B-R buffer pH 7.0 and scan rate 100 mVs-1.
| Parameters | - |
|---|---|
| Linearity range (µg/ml) | - |
| Slope | 1.640 µA |
| Intercept | 1.768 |
| SE of Slope | 0.096 |
| SE of Intercept | 0.118 |
| Correlation Coefficient (r) | 0.9969 |
| LOD (µg/ml) | 0.081 |
| LOQ (µg/ml) | 0.269 |
| Repeatability of the peak current a (RSD %) | 0.0441 |
| Reproducibility of the peak current a (RSD %) | 0.365 |
| Repeatability of the peak potential a (RSD %) | 0.009 |
| Reproducibility of the peak potential a (RSD %) | 0.011 |
a: Obtained from an average of five experiments
Table 2. Regression data of the calibration curve for quantitative determination of NPF by the SQV method.
Detection and quantitation limits
According to ICH recommendations the methodology based on both the standard deviation of the oxidation peak current and the slope of the standardization calibration curve was used for computation the detection and quantitation limits as stated in Table 2. The LOD was computed via the equation LOD=3S/x and the quantitation limit (LOQ) was estimated via the equation LOQ=10S/x where S is the standard deviation of the oxidation peak current (n=5) and x is the slope of the calibration curve. The estimated LOD was found to be 0.082 μg/ml and LOQ was found to be 0.272 μg/ml. These precise low values of LOD and LOQ can be attributed to the presence of CMWNT and BMH in the structure of the improved modified electrode.
Accuracy
To prove the accuracy of the proposed method, the results of the assay of NPF in pure form assessed by the proposed voltammetric methods were compared with those obtained using the reported spectrophotometric method [5]. Statistical comparison of the results obtained by the proposed method and those obtained by the reported method using student’s t-test and F-test revealed no significant difference between the two methods as shown in Table 3.
| Parameter | Proposed method | Reported method [5] | ||
|---|---|---|---|---|
| - | Amount taken (µg/mL) | Amount found (µg/mL) | R % | R% |
| 2 | 2.02 | 101.00 | 99.50 | |
| 3 | 2.99 | 99.67 | 99.60 | |
| 5 | 5.03 | 100.60 | 100.12 | |
| Mean ± SD | - | - | 100.42 ± 0.68 | 99.74 ± 0.330 |
| Variance | - | - | 0.462 | 0.109 |
| t-Tabulated at p=0.05 | - | - | 0.794 (t tab=2.78) |
- |
| F-tabulated at p=0.05 | - | - | 4.23 (F tab=19.00) |
- |
Table 3. Accuracy of the proposed SQV voltammetric method for determination of NPF in its pharmaceutical dosage form.
Precision/reproducibility
The precision of the method was investigated by performing three series of measurements (each three runs) with three different concentrations of NPF solution within one day to evaluate the within-day (repeatability) variability. RSD% values were calculated to check the ruggedness and the precision of the method. To calculate between day fluctuations of the analytical signal (reproducibility), three series of measurements were carried out on two successive days (reproducibility of the same modified electrode) and using three consecutive newly modified electrodes (reproducibility of renewed modified electrodes), Table 4.
| Conc. (µg/mL) | 2.0 | 3.0 | 5.0 |
|---|---|---|---|
| Intra-day* (Repeatability) | 100.50 ± 1.323 | 100.45 ± 0.693 | 99.00 ± 0.529 |
| Inter-day*(Reproducibility on same electrode) | 100.00 ± 1.323 | 99.00 ± 0.883 | 100.27 ± 0.924 |
| Reproducibility on renewed electrode | 99.50 ± 2.000 | 100.56 ± 0.836 | 99.80 ± 1.114 |
Table 4. Inter- and intra-days regression parameters for the voltammetric determination of NPF.
Robustness
The robustness of an analytical procedure is a measure of its capacity to remain unaffected by minor, but deliberate variations in method parameters. The robustness of the proposed method was investigated by constancy of the peak current with deliberated minor changes in the experimental parameters. The studied variables included the change in pH (± 0.2), the time considered before each measurement (10s ± 5s). These minor changes that may take place during the experimental operation did not affect the peak current intensity of the studied drug, indicating the reliability of the proposed method during normal usage.
Stability
The stability of the modified electrode has been investigated. The peak current does not change after storage in air for 9 days. The modified electrode retained 98% of its initial response up to 1 month.
Specificity
Specificity was proved by comparing the voltammograms of the pharmaceutical preparation to that of the pure form, they were found similar. Besides, good results for the recovered concentrations of the pharmaceutical preparation prove specificity (Table 4).
Analytical application
Analysis of Nevaxal® eyedrops: To demonstrate the applicability of the proposed electrode for the analysis of real samples, it was applied to the determination of NPF in commercial Nevaxal® eye drops (which nominally contain 1 mg NPF per 5 mL) (Tables 5 and 6). The validity of the proposed method was assessed by applying the standard addition technique, which showed accurate results and there was no interference from excipients as shown in Table 7. Statistical calculations were made to check the confidence and correlation between the suggested procedures and the reported method [5]. From the calculated t- and F-values at the 95% confidence level, it is clear that the results obtained by the developed method are in good agreement with those obtained by a reported method [5].
.
| Dosage form | Proposed method R% | Reported method [5] (R%) |
|---|---|---|
| Nevaxal ® eye drop |
99.00 | 99.50 |
| 100.67 | 99.60 | |
| 100.40 | 100.12 | |
| Mean ± SE | 100.03 ± 0.516 | 99.47± 0.191 |
| Standard Deviation | 0.896 | 0.330 |
| Sample Variance | 0.799 | 0.109 |
| t-test | 0.823 (t tab=2.132) | - |
| F-test | 7.33 (F tab=9. 00) | - |
Table 5. Application of the proposed and comparison methods for determination of Nevaxal® by standard addition technique for NPF in drug pharmaceutical preparations.
| Added | Found (µg/mL) (Mean ± SEa) | R% | SDb |
|---|---|---|---|
| 2.0 | 1.99 ± 0.763 | 99.50 | 1.322 |
| 3.0 | 2.98 ± 0.113 | 99.44 | 0.196 |
| 5.0 | 4.97 ± 0.177 | 99.47 | 0.305 |
SEa: Standard Error of Three Replicates;
SDb: Standard Deviation, b: Average of Three Replicate Determinations
Table 6. Appraisal of the accuracy and precision of the proposed method for determination of NPF in spiked serum samples.
| CMWNT-BMH-SDS | |
|---|---|
| - | SQW |
| (R% ± SEa) | 100.02 ± 0.516 |
| SDb | 0.896 |
| Variance | 0.799 |
SEa: Standard Error of Three Replicates; SDb: Standard Deviationb Average of three replicate determinations
Table 7. Appraisal of the selectivity of the proposed method for determination of NPF by applying standard addition technique.
Assay of NPF in in human serum samples: The applicability optimized procedure of the proposed to quantitative determination of NPF concentration in human serum was successfully investigated; Acetonitrile and methanol were investigated as the serum precipitating agents. The best effects were found with acetonitrile. So, acetonitrile was used for the subsequent studies. The measurements of NPF in serum samples were achieved as described in the analysis of spiked serum samples. For the applicability of the suggested method to the human serum, the calibration equation was obtained in spiked serum. Parameters and validation data are displayed in Table 6.
Standard addition method
The standard addition method was applied to the commercial pharmaceutical formulation containing NPF. With the application of the standard addition method the mean percentage recoveries and their standard deviations for the proposed methods were calculated in Table 7. According to the obtained results good precision and accuracy were observed for this method.
Conclusion
This manuscript validates the direct measurement of NPF at a modified carbon CMWNT-BMH-SDS electrode by the incorporation of 1-n-butyl-3-methylpyridinium hexafluorophosphate ion crystal as modifying species in pharmaceutical preparations and human serum samples.
The described method is useful for NPF quantitative determination in conventional supporting electrolytes. The CMWNT-BMH-SDS was considerably stable up to 1 month when put in refrigerator. The electrode preparation is easy and simple. The results illustrate that the oxidation of NPF is catalyzed at pH 7.0, where the modified electrode demonstrates higher selectivity in voltammetric measurements of pure form, pharmaceutical and in spiked serum samples.
References
- Kim SJ, Flach AJ, Jampol LM. Nonsteroidal anti-inflammatory drugs in ophthalmology. Surv Ophthalmol. 2010;55(2):108-33.
- Gamache DA, Graff G, Brady MT, et al. Nepafenac, a unique nonsteroidal prodrug with potential utility in the treatment of trauma-induced ocular inflammation: I. Assessment of Anti-Inflammatory Efficacy. Inflammation. 2000;24(4):357-70.
- Gaynes B, Onyekwuluje A. Topical ophthalmic NSAIDs: A discussion with focus on nepafenac ophthalmic suspension. Clin Ophthalmol. 2008;2(2):355-68.
- Anupama B, Madhavi D, Amareswari S, et al. New visible spectrophotometric methods for determination of nepafenac. Asian J Res Chem. 2011;4(4):611-2.
- Yadav SJ, Doshi MN, Panchori HP, et al. A simple and rapid spectrophotometric method for the determination of nepafenac in pharmaceuticals. J Pharm Res. 2012;5(8):4292-4.
- Rajput S, Shrimali C, Baghel M. Development and validation of UV and RP-HPLC method for estimation of nepafenac in bulk drug and opthalmic formulation. J Adv Pharm Edu Res. 2015;5(1):15-20.
- Usman S, Akram M, Aziz A, et al. Development and validation of HPLC analytical method for Nepafenac in ophthalmic dosage form (suspension). Pak J Pharm Sci. 2014;27(5):1541-6.
- Kumar VP, Sunandamma Y. A novel RP-HPLC method for the quantification of nepafenac in formulation, plasma (in vitro). Int J Pharm Bio Sci. 2012;3(4):847-54.
- Shrimali C, Baghel M, Rajput S. Development and validation of stability indicating RP-HPLC method of nepafenac and its degradation products: Application to degradation kinetics. Int J Pharm Pharm Sci. 2014;6(9):387-93.
- Amiri M, Pakdel Z, Bezaatpour A, et al. Electrocatalytic determination of sumatriptan on the surface of carbon-paste electrode modified with a composite of cobalt/Schiff-base complex and carbon nanotube. Bioelectrochem. 2011;81(2):81-5.
- Amiri M, Ghaffari S, Bezaatpour A, et al. Carbon nanoparticle-chitosan composite electrode with anion, cation, and neutral binding sites: Dihydroxybenzene selectivity. Sens Actuators B. 2012;162(1):194-200.
- Ejhieh AN, Hashemi HS. Voltammetric determination of cysteine using carbon paste electrode modified with Co(II)-Y zeolite. Talanta. 2011;88:201-8.
- Portaccio M, Tuoro D, Arduini F, et al. A thionine-modified carbon paste amperometric biosensor for catechol and bisphenol A determination. Biosens Bioelectron. 2010;25(9):2003-8.
- Ding CF, Zhang ML, Zhao F, et al. Disposable biosensor and biocatalysis of horseradish peroxidase based on sodium alginate film and room temperature ionic liquid. Anal Biochem. 2008;378:32-7.
- Agui L, Manso J, Sedeno PJ, et al. Amperometric biosensor for hypoxanthine based on immobilized xanthine oxidase on nanocrystal gold-carbon paste electrodes. Sens Actuators B. 2006;113:272-80.
- Agui L, Pena-Farfal C, Sedeno PS, et al. Electrochemical determination of homocysteine at gold nanoparticle modified electrode. Talanta. 2007;74:412-20.
- He YP, Sheng Q L, Zheng JB, et al. Magnetite-graphene for the direct electrochemistry of hemoglobin and its biosensing application. Electrochem Acta. 2011;56:2471-6.
- Afkhami A, Bagheri H, Khoshsafar H, et al. Simultaneous trace-levels determination of Hg (II) and Pb (II) ions in various samples using a modified carbon paste electrode based on multi-walled carbon nanotubes and a new synthesized Schiff base. Anal Chim Acta. 2012;746:98-106.
- Afkhami A, Madrakian T, Sabounchei SJ, et al. Construction of a modified carbon paste electrode for the highly selective simultaneous electrochemical determination of trace amounts of mercury (II) and cadmium (II). Sens Actuators B. 2012;161(1):542-8.
- Afkhami A, Ghaedi H, Madrakian T, et al. Fabrication of a new electrochemical sensor based on a new nano-molecularly imprinted polymer for highly selective and sensitive determination of tramadol in human urine samples. Biosens Bioelectron. 2013;44:34-40.
- Ensafi AA, Rezaei B, Maleh HK. An ionic liquid type multiwall carbon nanotubes paste electrode for electrochemical investigation and determination of morphine. Ionics. 2011;17 (7):659-68.
- Huang W, Qian W, Jain PK, et al. The effect of plasmon field on the coherent lattice phonon oscillation in electron-beam fabricated gold nanoparticle pairs. Nano Lett. 2007;7(10):3227-34.
- Khatri O P, Murase K, Sugimura H. Self-Assembly of Ionic Liquid (BMI-PF6)-Stabilized Gold Nanoparticles on a Silicon Surface: Chemical and Structural Aspects. Langmuir. 2008;24(15):7785-92.
- Guczi L, Peto G, Beck A, et al. Gold Nanoparticles Deposited on SiO2/Si(100): Correlation between Size, Electron Structure, and Activity in CO Oxidation. J Am Chem Soc. 2003;125(14):4332-7.
- Atta NF, Galal A, Abu-Attia FM, et al. Nanosensors based on modified surfactant electrodes. J Electrochem Soc. 2010;157:F116-F23.
- Qiu HJ, Zhou GP, Ji GL, et al. A novel nanoporous gold modified electrode for the selective determination of dopamine in the presence of ascorbic acid. Colloids Surf B: Biointerf. 2009;69(1):105-8.
- Agui L, Manso J, Sedeno PY, et al. Colloidal-gold cystamine-modified carbon paste electrodes as suitable electrode materials for the electrochemical determination of sulphur-containing compounds application to the determination of methionine. Talanta. 2004;64(4):1041-7.
- Manso J, Agui L, Sedeno PY, et al. Development and characterization of colloidal gold?cysteamine?carbon paste electrodes. Anal Lett. 2004;37(5):887-902.
- Ju HX, Liu SQ, Ge BX, et al. Electrochemistry of cytochrome c immobilized on colloidal gold modified carbon paste electrodes and it's electrocatalytic activity. Electroanalysis. 2002;14:141-7.
- Gonzalez-Garcia MB, Sanchez CF, Garcia AC. Colloidal gold as an electrochemical label of streptavidin-biotin interaction. Biosens Bioelectron. 2000;15:315-21.
- Mena ML, Sedeno PY, Pingarron JM. A comparison of different strategies for the construction of amperometric enzyme biosensors using gold nanoparticle-modified electrodes. Anal Biochem. 2005;336:20-7.
- Rizk M, Hendawy HA, El-Alamin MMA, et al. Sensitive anodic voltammetric determination of methylergometrine maleate in bulk and pharmaceutical dosage forms using differential pulse voltammetry. J Electroanal Chem. 2015;61:749-53.
- Adhoum N, Monser L. Determination of trimebutine in pharmaceuticals by differential pulse voltammetry at a glassy carbon electrode. J Pharm Biomed Anal. 2005;38:619-23.
- Leftheriotis G, Papaefthimiou S, Yianoulis P. Dependence of the estimated diffusion coefficient of LixWO3 films on the scan rate of cyclic voltammetry experiments. Solid State Ionics. 2007;178:259-63.
- Swartz ME, Krull IS. Analytical method development and validation. 1st ed. CRC Press; 1997.
