Original Article
, Volume: 11( 5)High Degradation Efficiency of Organic Dyes under Sunlight Irradiation for ZnO Nanorods
- *Correspondence:
- Perillo PM , National Atomic Energy Commission, CAC, MEMS Group, Av. Gral Paz 1499 (1650) Bs. As, Argentina, Tel: 541176627180;
E-mail: perillo@cnea.gov.ar
Received: June 6, 2016; Accepted: June 22, 2016; Published: June 28, 2016
Citation: Perillo PM, Atia MN. High Degradation Efficiency of Organic Dyes Under Sunlight Irradiation for ZnO Nanorod. Chem Technol Ind J. 2016;11(5):101.
Abstract
ZnO nanorods were prepared by a simple and low cost precipitation method as photocatalytic agent for decomposition of dyes under solar light exposure. The ZnO nanorods were used for the photodecolourization of water solution of representative organic azo dyes (methyl orange (MO), rhodamine B (RB) and crystal violet (CV) under sunlight. The ZnO nanorods showed excellent photodegradation efficiency, supporting the potential application as economical and a highly sunlight-active material to treat waste water containing azo dyes.
Keywords
ZnO; Dyes; Sunlight; Photocatalysis; Nanorods
Introduction
In order to decrease the damage caused by dye pollution to environment and human, the use of photocatalysts to convert organic compounds in contaminated water into non- toxic chemicals has been extensively investigated [1,2]. Photocatalysis has been emerged as a valid alternative to solve this problem [3]. Various photocatalysts, especially metal oxide such as TiO2, SnO2 and ZnO has attracted extensive attention for the degradation of non-biodegradable pollutants under UV irradiation [4-8]. ZnO is an interesting chemically and thermally stable n-type semiconductor with a large exciton binding energy of 60 meV and large band gap energy of 3.37 eV at room temperature. Comparing to other wide band-gap semiconductors, ZnO possesses higher quantum efficiency and higher exciton energy. Furthermore, it is one of the most propitious materials due to its applications in several areas, such as ultraviolet laser, high power light emitting diode, spintronic devices [9-11], solar cells [12,13], photodetectors [14], heterogeneous catalysis [15-17], piezo-electric transducers [18], cosmetic [19], and antibacterial treatment [20,21].
Numerous works have been reported in the literature regarding the utilization of ZnO for the effective treatment of harmful and toxic remaining present in the waste water [22-26].
In this paper, we proposed a simple and low chemical synthesis to obtain stable ZnO nanorods as catalysts with high photodegradation of various dyes molecules under solar light irradiation for environmental application.
Experimental Details
Synthesis of ZnO nanorods
The procedure for the synthesis of ZnO nanorods was as follows: in a typical synthesis, 2.195 g Zn(CH3COO)2⋅2H2O – zinc acetate dihydrate was completely dissolved in 100 ml deionized water forming the solution A. Under similar procedure 0.8 g NaOH in 50 ml of deionized water, resulting the solution B. The molar ratio of NaOH:Zn acetate was 4:1. The reagents were analytical grade, and were used without further purification.
The solution A was added dropwise into the solution B at the desired temperature (60°C to 65°C) with intensively mechanical stirring during 1 h (300 rpm). The resulting precipitate was continuously aged for 3 h at the desired temperature with vigorous stirring. After that, the white precipitate was cooled at room temperature and then filtered and washed several times with deionized water, finally dried in an oven at 80°C for 8 hours.
Photocatalytic activity
The dye aqueous solutions of MO, RB and CV were prepared by dissolving analytical grade dye in water. To measure the photodegradation, 0.576 g/l of the ZnO catalyst was immersed in a quartz beaker with 26 ml of the MO (0.021 g/l) solution, and was kept for 30 min in the dark to achieve the equilibrium of adsorption and desorption. The solution was stirred at 300 rpm with a magnetic stirrer during all the experiment. Then the mixture was irradiated under natural sunlight. The irradiation fluence of the sunlight was estimated to be 0.14 W/cm2. The period of the experiment was between 10:30 and 14:00 during the sunny months of January and February 2016. At specific time intervals, 2 ml of an alicuot was withdrawn from the system, and 2 ml of deionized water was added to the aliquot each time for every sample to make centrifuge easy. The dye solutions were separated from the photocatalyst by centrifugation and preserved in the dark before analysis. The same procedure was repeated using 26 ml of aqueous solution of RB (0.035 g/l) and 26 ml of CV (0.0105 g/l). The dye solution without ZnO catalyst was used as reference.
Characterization
The morphology of as-synthesized ZnO nanorods was characterized by scanning electron microscopy (SEM) on a Zeiss Supra40 Gemini, 3 KV Microscope. Transmission electron microscopy (TEM) observation was carried out on a Philips CM200 microscope operating at an accelerating voltage of 160 kV equipped with an EDAX energy dispersive spectrometer (EDS). For the TEM study, a very small amount of the powder sample was first dispersed in deionized water by ultrasonication. A drop of that solution was taken on a carbon grid for TEM imaging, which was purchased commercially. ImageJ software was used to determine the diameter and length of the ZnO nanostructures.
The crystalline structure of the powder was assessed by X-ray diffraction (XRD). The XRD patterns were recorded at room temperature with Cu Kα radiation of 0.15418 nm in a diffractometer (PANalytical model Empyrean) having theta-theta configuration and a graphite secondary-beam monochromator, using a generator voltage of 40 kV and current of 40 mA. The data were collected for scattering angles (2θ) ranging from 20° to 70° with a step of 0.026° for 2 s per point. The surface area was calculated using the Brunauer–Emmett–Teller (BET) method based on the adsorption data. The BET specific surface area and pore distribution of the samples which were degassed at 150°C for 8 h were determined by N2 adsorption/desorption method, which were carried out on a Micromeritics Accelerated Surface Area and Porosimetry System ASAP 2020 v 3.01 instrument. The UV-Vis measurements were recorded using a Shimadzu 1800 UV-Vis spectrophotometer.
Results and Discussion
Morphological and structural characterization
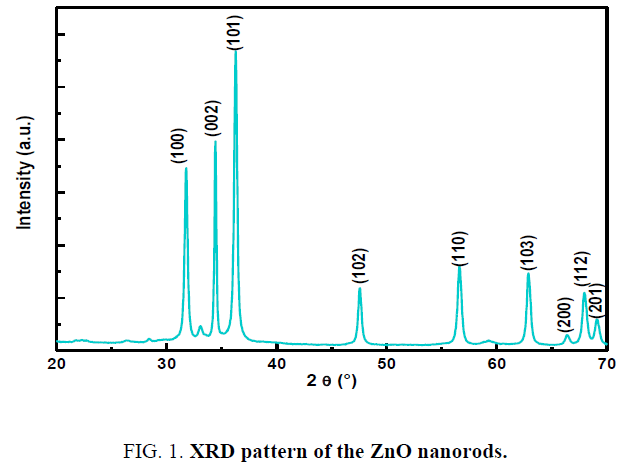
The corresponding X-ray diffraction pattern of ZnO powder is shown in Figure 1. The diffraction peaks at 2θ=31.7°, 34.3°, 36.2°, 47.5°, 56.5°, 62.7°, 66.2° and 67.8° are identified to be the (100), (002), (101), (102), (110), (103), (200) and (112). All of the indexed peaks in the obtained spectrum are well matched with the planes of ZnO hexagonal wurtzite structure (01-079- 0207). The lattice constants calculated from the XRD data for (101) and (002) phases are a=b=3.259 Å, c=5.218 Å [27]. No other peaks related to impurities are observed, which proves the high purity of the wurtzite phase.
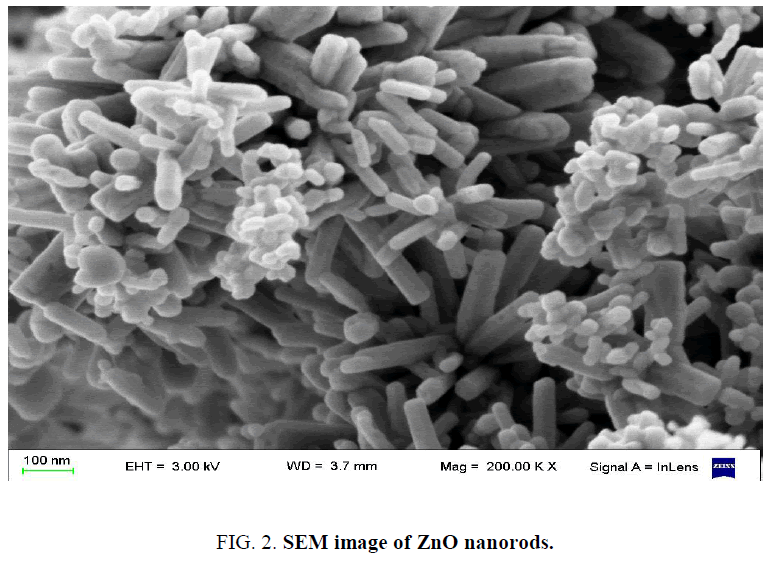
Figure 2 shows a typical SEM image of the samples. The images clearly reveal the hexagonal nanorods structure. The average diameter and length of the nanorods are 50 nm and 200 nm respectively. The surface of ZnO nanorods was very smooth.
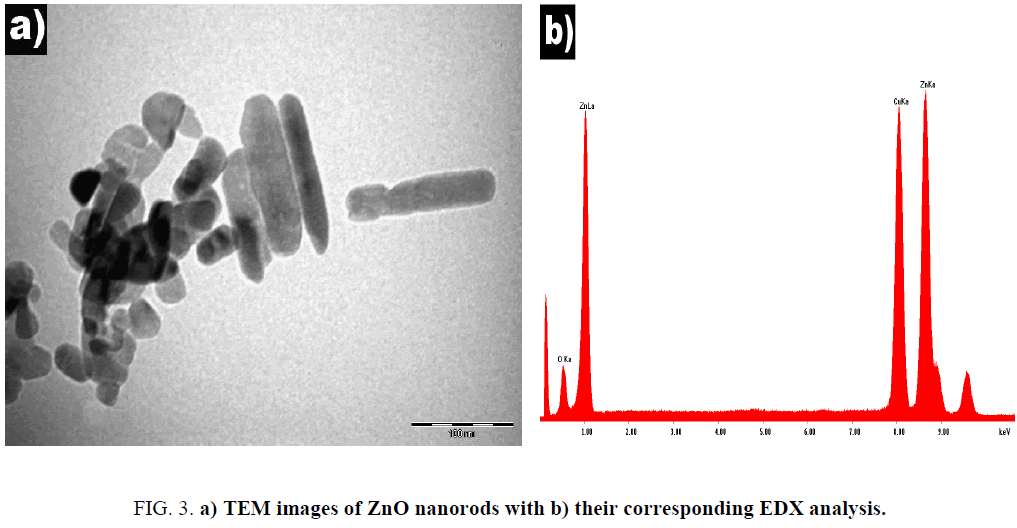
The TEM image obviously shows the tubular morphology of the nanorods. As seen in Figure 3, some agglomerated nanostructure is observed and the measurement of the isolated nanorod is 30 nm wide and 150 nm length. The chemical composition of the sample was characterized by EDX spectroscopy.
The sharp diffraction peaks indicate the good crystallinity of the prepared samples.
BET analysis
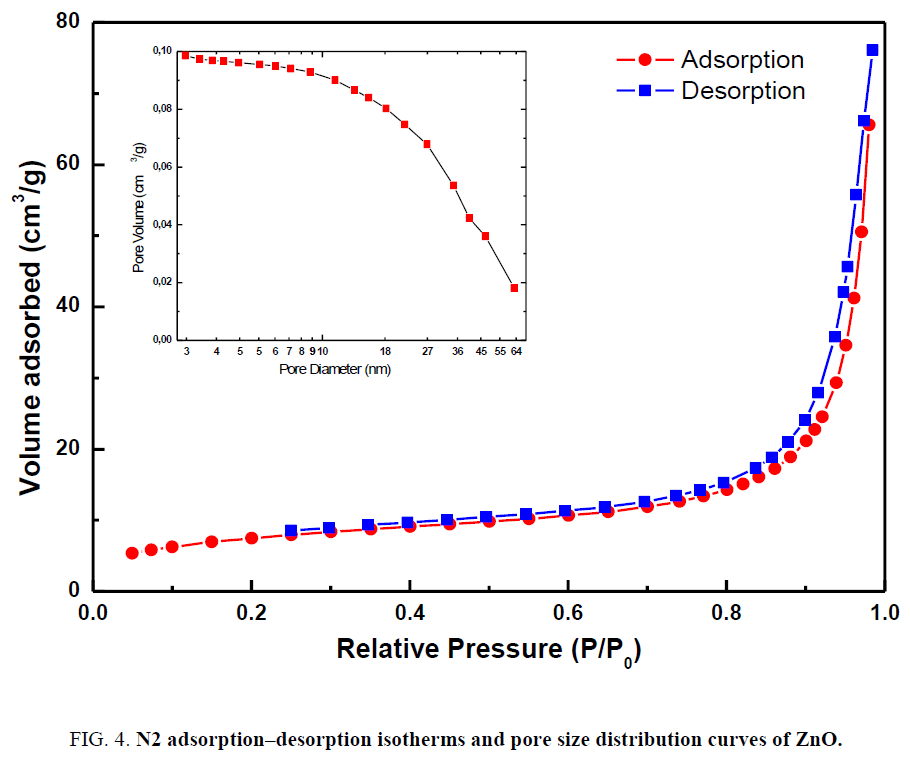
The surface area and pore volume of the photocatalyst are investigated using nitrogen gas adsorption–desorption method. To characterize the specific surface area and porosity, nitrogen sorption measurements of the samples were carried out at 77 K. Nitrogen adsorption–desorption isothermal and the corresponding Barrett–Joyner–Halenda (BJH) pore size distribution desorption are presented in Figure 4. The pore volume distribution curve of ZnO is given as an inset image in Figure 4. The profile can be categorized to type III isotherm [28,29].
Table 1 shows the results of the measured BET specific surface area and BJH pore size distribution desorption of the ZnO nanorods.
| Property | ZnO |
|---|---|
| BET surface area (m2/g) | 27.53 |
| Total pore volume (single point) (cm3/g) | 0.117 |
Table 1: Surface properties of the sample.
As can be seen in Table 1, ZnO has a largest specific surface area of 27.53 m2/g.
Optical characterization
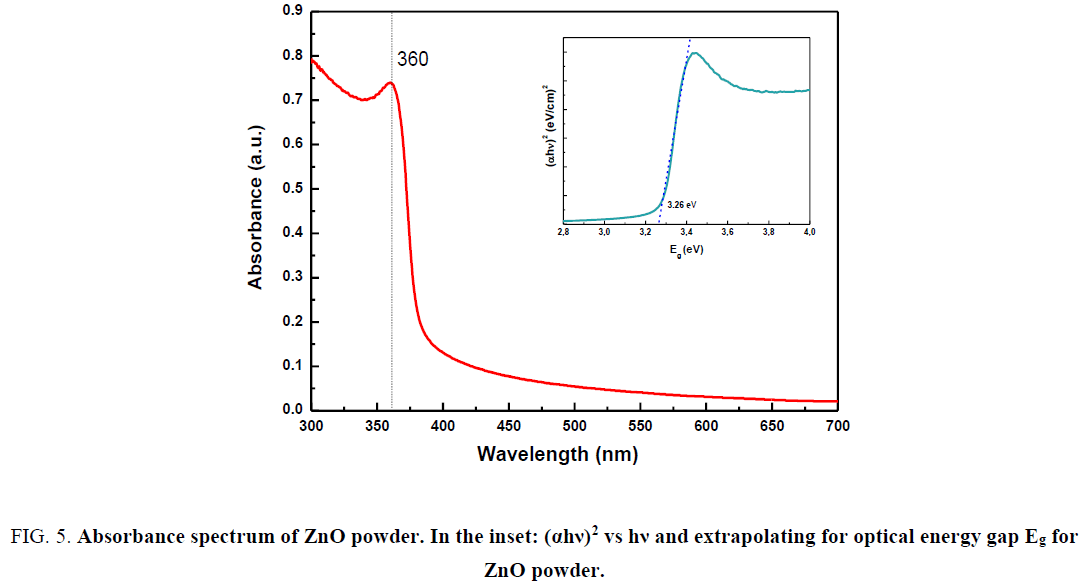
The room temperature UV–Vis absorbance spectrum of the ZnO nanorods is given in Figure 5. The sample was dispersed ultrasonically in water with SDS 10 wt% (sodium dodecyl sulfate). The shown spectrum is corrected for the solvent contribution.
Figure 5: Absorbance spectrum of ZnO powder. In the inset: (αhν)2 vs hν and extrapolating for optical energy gap Eg for ZnO powder.
From the Figure 5 it can be seen that there was intensive absorption in the ultraviolet band of about 350 nm to 400 nm. The optical band gap (Eg) of the as-prepared ZnO samples was calculated using the Tauc´s relationship [30] as follows:
αhν = A (hν - Eg)n (1)
where α is the absorption coefficient, h is Planck's constant (6.626 × 10⁻³⁴ Js), ν is the frequency calculated by the formula ν=c/λ where c is the velocity of light (3 × 10⁸ m/s) and λ is the wavelength obtained from the spectra, n is ½ for direct semiconductor.
The extrapolation of the straight line in the Figure 5 to (αhν)2=0 gives the value of band gap energy Eg=3.26 eV. This value is smaller than that bulk ZnO (3.37 eV). According to the literature this difference can be attributed to a structural change in ZnO crystal such as surface and intrinsic defects [31]. The optical band gap (Eg) is found to be size dependent and there is an increase in the band gap of the semiconductor with a decrease in particle size.
Photocatalytic degradation
Under visible light illumination with sufficient energy (hν) to be equal to or greater than the ZnO band gap energy (hν ≥ Eg), the electrons (e–) migrate from the valence band (VB) to the conduction band (e–CB). Meanwhile, holes (h+VB) will be left at the valence band. A characteristic feature of semiconducting metal oxides is the highly reactive electrons and holes at the surface of the photocatalyst. They can react with water to produce reduction and oxidation reactions to generate the highly reactive hydroxyl radical (•OH) and superoxide anion radicals (O2–?), respectively. The photocatalytic mechanism for degradation of organic pollutants can be explained through the following reactions [32,33]:
ZnO+hν → ZnO (h+VB+ e–CB) (2)
h+VB+dye → dye?+ → oxidation of the dye (3)
H2O+h+VB → •OH+H+ (4)
O2+e–CB → O2–? (5)
O2–?+H+ → HO2– (6)
H++HO2– → H2O2 (7)
H2O2+hν → 2 •OH (8)
•OH+dye → degradation of the dye (9)
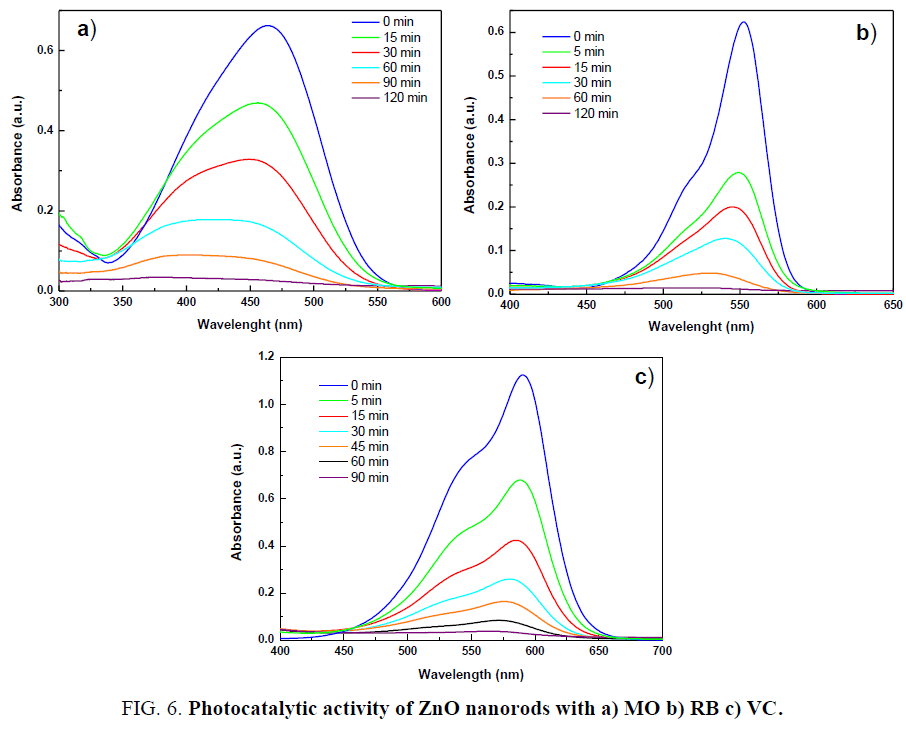
The concentration (C) of the centrifuged solution and the initial concentration (C0) of MO, RB and CV solution were monitored immediately by measuring the change in absorption intensity at their λmax=550 nm (RB), 590 nm (CV), and 463 nm (MO) as a function of irradiation time, the results were shown in Figure 6.
Figure 6a–6c exhibits the change in absorption spectra for the photocatalytic degradation of MO, RB and CV with exposure time. It can be seen that the maximum absorbance of aqueous suspension of dyes gradually decreases with increase in irradiation time in the presence of ZnO nanorods.
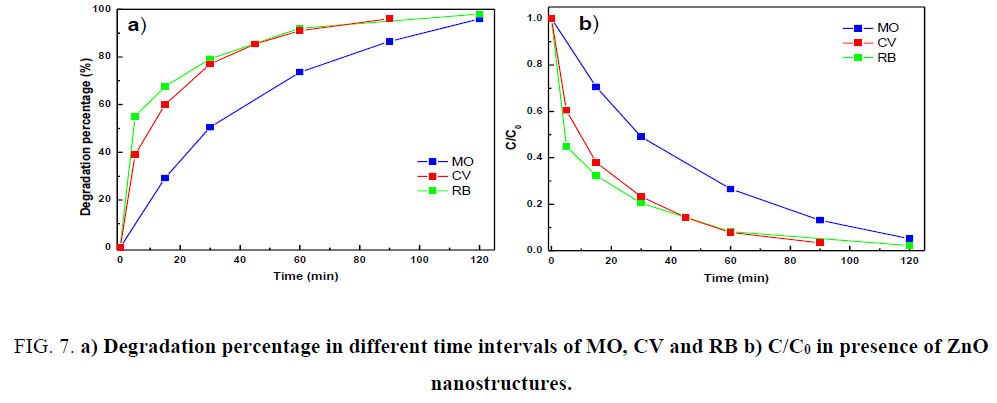
Figure 7a and 7b shows the plots of degradation percentage and C/C0 vs irradiation time for the all three dyes in the presence of ZnO nanorods.
Figure 7: a) Degradation percentage in different time intervals of MO, CV and RB b) C/C0 in presence of ZnO nanostructures.
It could be seen from the Figure 7b that 96% of VC degraded after 90 min of irradiation time, 98% of RB and 95.9% of MO dye degraded after 120 min of irradiation time. The blank (absence of photocatalyst) experiment was also carried out and less than 1% of the dye removal was observed for 120 min irradiation.
The degradation rate constant for each experiment was calculated from the initial slope obtained by linear regression from a plot of the natural logarithm (ln) of absorbance of the AO, MB and AB as a function of exposure time.
The dye concentrations were used to determine the pseudo-first order reaction rate constant (k, min-1) and degradation efficiency (%) by using the following equations [34,35]:
lnA/A0=lnC/C0=kt (10)
Degradation efficiency (%)=((C-C0)/C0) × 100=((A-A0)/A0) × 100 (11)
Where C is the concentration of the dye after t min. of reaction and C0 is the initial concentration. The parameters A0 and A are the absorbance of the dye solution in the wavelength (nm) at initial and any time.
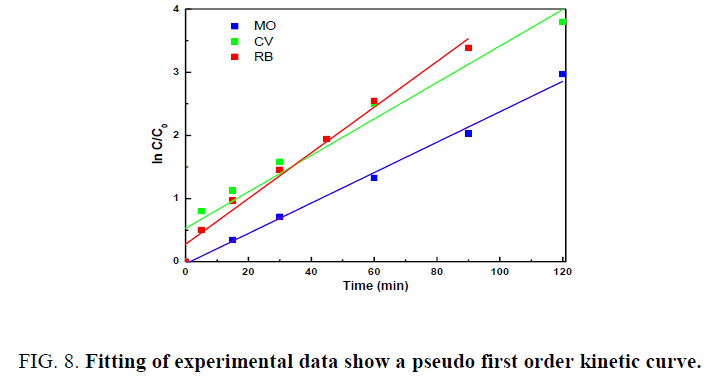
Figure 8 shows the kinetic behaviour of photocatalytic degradation of the dyes by ZnO nanorods. The efficiency of photodegradation was determined quantitatively using the equation (10) where k is the apparent rate constant (min-1), C0 and C are the concentrations of the dye at time 0 and t, respectively.
The plot of ln (C0/C) vs. irradiation time exhibits a straight line and the slope can be considered to be a pseudo first order rate constant k.
The rate constants for RB, CV and MO in the presence of ZnO nanostructure were found to be 0.0260 min-1, 0.0338 min-1 and 0.024 min-1 respectively.
Conclusions
We have successfully synthesized ZnO nanorods through a facile chemical route at a relatively low temperature. The analysis of the X-ray diffraction data indicated that the samples had hexagonal wurtzite structure and nanometric size crystallites. The optical band gap of the ZnO samples calculated using Tauc model is 3.19 eV and is smaller than the bulk value. The specific surface area was 27.53 m2/g.
The photocatalytic performance of ZnO nanorods was evaluated by degradation of rhodamine, violet crystal and methyl orange which efficiently degraded the dyes. The kinetic study revealed that ZnO nanorods are a promising photocatalyst for degradation of organic pollutants.
Acknowledgement
The authors would like to acknowledge Dr. D. Vega from Condensed Matter Division, GAYANN, CNEA for XRD analysis and Mr. Gonzalo Zbhilei for TEM analysis.
References
- Wang H, Xie C, Zhang W, et al. Comparison of dye degradation efficiency using ZnO powders with various size scales. J Hazard Mater. 2007;141(3):645-52.
- Byrappa K, Subramani AK, Ananda S, et al. Photocatalytic degradation of rhodamine B dye using hydrothermally synthesized ZnO, Bull Mater Sci. 2006;29:433-8.
- Fujishima A, Honda K. Electrochemical photolysis of water at a semiconductor electrode. Nature. 1972;238(5358):37-8.
- Chakrabarti S, Dutta BK. Photocatalytic degradation of model textile dyes in wastewater using ZnO as semiconductor catalyst. J Hazard Mater. 2004;112(3):269-78.
- Curri ML, Comparelli R, Cozzoli PD, et al. Colloidal oxide nanoparticles for the photocatalytic degradation of organic dye, Mat Sci Eng. 2003;23:285-9.
- Elango G, Roopan SM. Efficacy of SnO2 nanoparticles toward photocatalytic degradation of methylene blue dye. J Photochem Photobiol B. 2016;155:34-8.
- Tian H, Ma JF, Li K, et al. Photocatalytic degradation of methyl orange with W-doped TiO2 synthesized by a hydrothermal method, Mat Chem Phys. 2008;112:47-51.
- Andronic L, Duta A. The influence of TiO2 powder and film on the photodegradation of methyl orange, Mater Chem Phys. 2008;112:1078-82.
- Dong HX, Liu Y, Lu J, et al. Single-crystalline tower-like ZnO microrod UV lasers, J Mat Chem C 2013;202-6.
- Liao CL, Chang YF, Ho CL, et al. High-speed GaN-based blue light-emitting diodes with gallium-doped ZnO current spreading layer, Electron Device Lett. 2013;34:611-3.
- Azam A, Ahmed F, Habib SS, et al. Fabrication of Co-doped ZnO nanorods for spintronic devices, Met Mat Intern. 2013;19:845-50.
- Wang L, Ma CH, Ru X, et al. Facile synthesis of ZnO hollow microspheres and their high performance in photocatalytic degradation and dye sensitized solar cells, J Alloy Compd. 2015;647:57-62.
- Morvillo P, Diana R, Mucci A, et al. Influence of annealing treatments on solution-processed ZnO film deposited on ITO substrate as electron transport layer for inverted polymer solar cells, Sol Energ Mat Sol C. 2015;141:210-7.
- Yatskiv R, Grym J, Verde M. Graphite/ZnO nanorods junction for ultraviolet photodetectors. Solid State Electron. 2015;105:70-3.
- Liu SH, Wang X, Wang K, et al. ZnO/ZnS–PdS core/shell nanorods: Synthesis, characterization and application for photocatalytic hydrogen production from a glycerol/water solution, Appl Surf Sci. 2013;283:732-9.
- Ye J, Li X, Hong J, et al. Photocatalytic degradation of phenol over ZnO nanosheets immobilized on montmorillonite. Mat Sci Semicond Process. 2015;39:17-22.
- An D, Yan Li, Lian X, et al. Synthesis of porous ZnO structure for gas sensor and photocatalytic applications. Colloids Surf A Physicochem Eng Asp. 2014;447:81-7.
- Yuh-Chung H, Tsung-Han L, Pei-Zen C, et al. High power Co3O4/ZnO p–n type piezoelectric transducer. Thin Solid Films. 2015;584:112-5.
- Lu PJ, Huang SH, Chen YP, et al. Analysis of titanium dioxide and zinc oxide nanoparticles in Cosmetics, J. Food Drug Ana. 2015;23(1):587-94.
- Sawai J, Shoji S, Igarashi H, et al. Hydrogen peroxide as an antibacterial factor in zinc oxide powder slurry. J Ferment Bioeng. 1998;86(5):521-2.
- Sawai J. Quantitative evaluation of antibacterial activities of metallic oxide powders (ZnO, MgO and CaO) by conductimetric assay. J Microbiol Methods. 2003;54(2):177-82.
- Shibin OM, Yesodharan S, Yesodharan EP. Sunlight induced photocatalytic degradation of herbicide diquat in water in presence of ZnO. J Environ Chem Eng. 2015;3:1107-16.
- Moussa H, Girot E, Mozet K, et al. ZnO rods/reduced graphene oxide composites prepared via a solvothermal reaction for efficient sunlight-driven photocatalysis. Appl Cat B Environ. 2016;185:11-21.
- Cai X, Cai Y, Liu Y, et al. Photocatalytic degradation properties of Ni(OH)2 nanosheets/ZnO nanorods composites for azo dyes under visible-light irradiation. Ceram Inter. 2014;4:57-65.
- Sanna V, Pala N, Alzari V, et al. ZnO nanoparticles with high degradation efficiency of organic dyes under sunlight irradiation. Mat Lett. 2016;162:257-60.
- Daneshvar N, Salari D, Khataee AR. Photocatalytic degradation of azo dye acid red 14 in water on ZnO as an alternative catalyst to TiO. J Photochem Photobiol A Chem. 2004;162:317-22.
- Bindu P, Thomas S. Estimation of lattice strain in ZnO nanoparticles: X-ray peak profile analysis. J Theor Appl Phys. 2014;8:123-34.
- Sing KSW, Everett DH, Haul RAW, et al. Reporting physisorption data for gas/solid systems with special reference to the determination of surface area and porosity. Pure Appl Chem. 1985;57(4):603-19.
- Ren Y, Yanga L, Wang L, et al. Facile synthesis, photoluminescence properties and microwave absorption enhancement of porous and hollow ZnO spheres. Powder Techn. 2015;281:20-7.
- Tauc J. Optical properties and electronic structure of amorphous Ge and Si. Mat Res Bull. 1968;3(1):37-46.
- Gusatti M, Souza DAR, Kuhnen NC, et al. Growth of Variable Aspect Ratio ZnO Nanorods by Solochemical Processing. J Mater Sci Technol. 2015;31(1):10-5.
- Prades JD, Jimenez-Diaz R, Hernandez-Ramirez F, et al, Toward a Systematic Understanding of Photodetectors Based on Individual Metal Oxide Nanowires. J Phys Chem C. 2008;112(37):14639-44.
- Lam SM, Sin JC, Abdullah AZ, et al. Degradation of wastewaters containing organic dyes photocatalysed by zinc oxide: a review. Desalin Water Treat. 2012;41:131-69.
- Konstantinou IK, Albanis TA. TiO2-assisted photocatalytic degradation of azo dyes in aqueous solution: kinetic and mechanistic investigations: a review. Appl Catal B Environ. 2004;19:1-14.
- Wongkalasin P, Chavadej S, Sreethawong T. Photocatalytic degradation of mixed azo dyes in aqueous wastewater using mesoporous-assembled TiO2 nanocrystal synthesized by a modified sol-gel process. Colloids Surf A Physicochem Eng Asp. 2011;384:519-28.
