Original Article
, Volume: 15( 2)Experimental Study on Portable Mini Solar Pond Using Salt and Pebbles
- *Correspondence:
- Sathish D, Department of Mechanical Engineering, Sri Ramakrishna Institute of Technology, Coimbatore, Tamil Nadu, India, Tel: 04222605577; E-mail: sadhirash@gmail.com
Received: April 06, 2017; Accepted: April 13, 2017; Published: April 19, 2017
Citation: Sathish D, Veeramanikandan M, Tamilselvan R. Experimental Study on Portable Mini Solar Pond Using Salt and Pebbles. Int J Chem Sci 2017;15(2):121.
Abstract
Solar ponds are water bodies; it is used as a solar collector with integrated storage. Salt gradient solar pond is a pool of water where the solar energy is trapped due to imposed salinity gradient and pebbles. Three zones can be identified in this pond, (i.e.) Upper convective zone -UCZ Non-convective zone-NCZ, Lower convective zone-LCZ. The top and bottom zones are the convective zones and an intermediate zone which is non-convective. Inter mediate zone is also act as a transparent insulation and it allows the storage of the solar energy at the lower convective zone, where the heat can be used when required. Pond is built-up by using plywood with a thickness of 2 cm and its dimensions of top and bottom surface area of 1.75 m2 × 1 m2 with a depth of 0.5 m and inclined at an angle of 45°C. It is insulated by HDPE sheet thickness of 1 mm and a glass is placed on the top of the pond thickness of 4 mm. In this research to store the solar energy in the lower zone of pond used sodium chloride salt and pebbles. Then the stored heat is measured by using thermocouples. The observed temperature for NaCl salt is 65°C and that of pebbles is 45°C.
Keywords
Salt gradient solar pond; Sodium chloride salt; Pebbles
Introduction
Solar energy is the vital global unconventional energy resources. Conversion of solar energy can be functioned by numerous methods but most economical and simple way is by using solar pond Jerome Godwin Egbe [1]. A solar pond is a huge collector of solar energy similar to a pond that accumulates heat, which is then used for various applications Aliakbar Akbarzade et al. [2]. Solar pond is storage device which is used to collect solar energy. Solar pond is a suitable and efficient one which absorbs radiation from the sun and it stores for a longer period Saifullaha et al. [3]. Solar rays which will incident on the surface on the pond and pass inside liquid and imparts heat. Saifullaha [3]. This device has been successfully built and operated in many countries due its good performance. NACL salt and pebbles is used to store heat with in the body of the solar pond, by creating salinity gradient to prevent heat loss. The largest solar pond for electricity generation was the “Beit Haarava” pond built in Israel and operated until 1998; it has an area of 210000 mm2 and gave an electrical output of 5 MW3. India was the first Asian country to establish a solar pond in “Bhuj” in Gujarat. Solar ponds are natural phenomenon discovered up to 70C at depth of 1.32 m at the end of the summer. Middle-east area is one of the richest areas in solar energy.
The solar pond consists of three thermal layers.
a) Upper convective zone
b) Non-convective zone
c) Lower convective zone
Upper convective zone
Upper layer is also known as surface layer. In this zone, the salt concentration will be very low and the temperature will be nearer to atmosphere Sathish et al. [4]. Upper convective zone is a top layer of the solar pond. Upper convective zone has a direct contact with atmosphere with relatively low salinity water and low temperature. In the upper convective zone only fresh water is presented. To measure the temperature in the upper convective zone thermocouple is placed.
Non-convective zone
Non-convecting Zone this zone is also called as gradient zone or the center layer. In this region, the temperature and salt concentration varies this is not homogeneous layer Sathish et al. [5]. Non-convective zone is the middle zone of the solar pond. It is the also called as the “salinity gradient layer”. Non-convective zone contains a variation of salinity increasing with depth and act as insulator for lower convective zone. Non-convective zone contains only salt water. To measure the temperature in the non-convective zone thermocouple is placed. Non-convective zone is used to observe the heat from the upper convective zone and stored in the lower convective zone.
Lower convective zone
Lower convective zone (LCZ) is the last layer and is also called as storage zone, having the thickness of maximum and the salt concentration present will be nearer to constant. Lower convective zone contains salt (NaCl), salt water. Lower convective zone is called as the “Energy storage zone”. The lower convective zone high salinity brine with almost homogeneous salinity and high temperature in the pond. To measure the temperature in the lower convective zone thermocouple is placed Sifuna et al. [6].
Construction
Solar pond site should have these following characteristics
a. Be nearer to the water resource for wash out mixed layer.
b. Solar rays from the sun should be high Karakavalasa et al. [7].
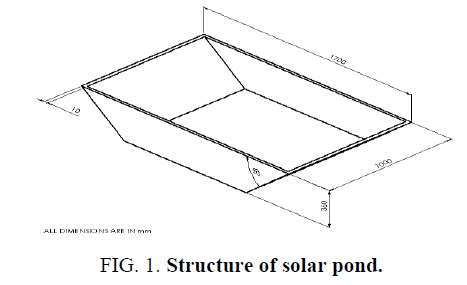
Solar pond is consisted by the plywood, high density polyethylene sheet, glass, solar power meter, thermocouple, water, salt and pebbles. The pond is made of plywood. It has the low thermal conductivity of 0.13 W/mK. Dimensions of the pond is top and bottom surface area of 1.75 m2 × 1 m2 with a depth of 0.5 m and inclined at an angle of 45°C.Thickness of the plywood 10 mm. High density polyethylene sheet is used to insulate the inside layer of the pond. Thickness of the polyethylene sheet is 2 mm. Glass is placed on the top surface of the pond. The thickness of glass is 4 mm. Length of the glass is 1800 mm (Figure 1-4).
Water is filled in the pond. NaCl salt is mixed with water. Then the water in the pond is converted into 3 zones. J type thermocouples are used in this pond. Each layer contains two thermocouples. Six thermocouples are dipped in the water. Thermocouples are connected to the multipoint temperature indicator. J type multi point temperature indicator is used. Then the temperature should be measured and difference in the temperature should be calculated.
Results and Discussion
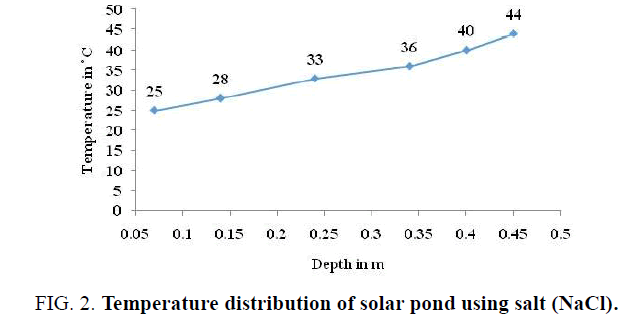
Temperature distribution of solar pond using salt (NaCl)
The temperature distribution of the solar pond using salt (NaCl) shows the change of temperature with time in the experiment. The temperatures are measured at 10’o clock, near the highest temperature. We can see that the temperature increases with time running and reaches steady state temperature about 5 days later and the solar pond as reached stable working conditions. The highest temperature is 62°C occurs on the 6th day may be lying on the top part of the LCZ. In general, the trend of measured temperature is well represented by the model and the temperature increased with depth and the highest temperature is appeared around the top of LCZ. The maximum temperature error is about 1.7°C which appears on the middle of UCZ. The change of temperature goes on increasing according to the time and depth of the solar pond. Temperature of the upper convective zone (UCZ) is normal to the atmospheric temperature. In the non-convective zone (NCZ), the temperature goes on increasing according to the time and solar radiation. In the lower convective zone (LCZ) where the high temperature is obtained is stored by the salt (NaCl) is used for further purpose
Temperature distribution of solar pond using pebbles
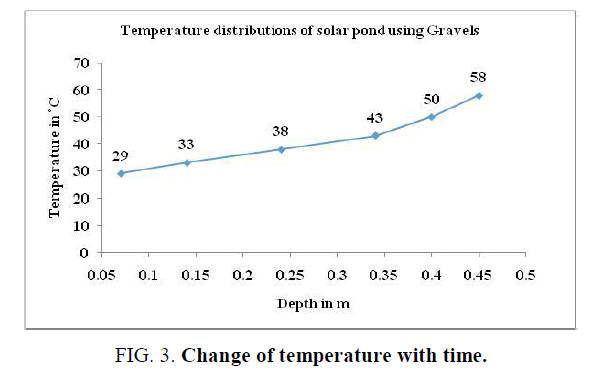
The temperature distribution of the solar pond using pebbles shows the change of temperature with time in the experiment. The temperatures are measured at 10’o clock, near the highest temperature.
We can see that the temperature increases with time running and reaches steady state temperature about 5 days later and the solar pond as reached stable working conditions. The highest temperature is 45°C occurs on the 6th day may be lying on the top part of the LCZ. In general, the trend of measured temperature is well represented by the model and the temperature increased with depth and the highest temperature is appeared around the top of LCZ. On comparing, pebbles have low thermal conductivity so less heat will be stored in the lower convective zone (LCZ) of the solar pond. The change of temperature goes on increasing according to the time and depth of the solar pond. Temperature of the upper convective zone (UCZ) is normal to the atmospheric temperature. In the NCZ, the temperature goes on increasing according to the time and solar radiation. In the lower convective zone (LCZ) where the high temperature is obtained is stored by the pebbles is used for further purpose.
Temperature distribution of the trapezoidal solar pond
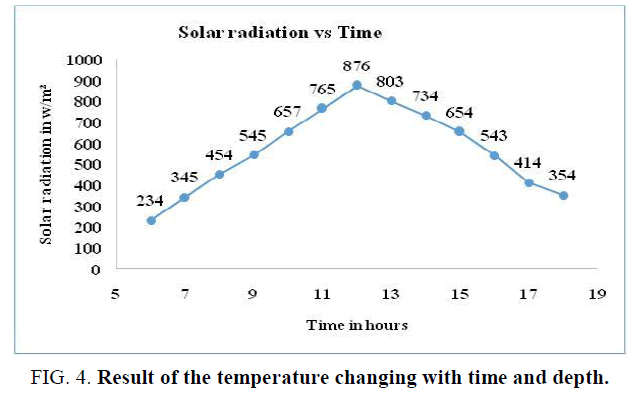
The graph shows the result of the temperature changing with time and depth. The stimulation starts at 6’o clock in the morning and finished at 6’o clock in the evening. The overall temperature is significant increased by solar radiation. Each day, temperature will get increased mostly in 12’o clock.
Fortunately, we can see the drop of the temperature is very small during the night, because the heat stored in the pond mainly concentrates in the LCZ due to the thermal protection function of the side wall and the isolation function of NCZ. Therefore, the solar pond can maintain good performance of heat storing even during the night. It can have been seen that temperature of solar pond does not always increase with time, because the radiation observed by the solar pond is lower than the heat loss and it led to the reduction in overall temperature. The drop of temperature indicates that solar ponds are susceptible to climatic conditions. The overall temperature of the solar pond is increasing with the time running, the top temperature of each day occurs near the 12’o clock and the highest temperature reaches to 62°C. The temperature of NCZ increases linearly with the depth. The upward trend in temperature is most obvious in the superior part of LCZ, because the heat loss caused by the low temperature soil limits the temperature increasing at the bottom of LCZ. We can conclude that the heat stability of the interfaces in solar pond is determined by temperature gradient.
Conclusion
In this paper, the characteristics of solar pond using salt (NaCl) and pebbles are studied with experimentation. The correctness of the model is verified by comparing the temperature distribution between the salt and pebbles. Here we have found that the heat absorption of salt is more than pebbles. But by comparing the cost pebbles is cheaper than salt. Hence for high heat storage salt is preferred than pebbles.
References
- Egbe JG, Khan AH, Wisatesajja W. Design of solar pond calculation and technique in Africa. IOSR-J Mech Civil Eng. 2013;6:22-32.
- Akbarzade A, Andrews J, Golding P. Solar ponds, solar energy conversion and photo energy systems. 1.
- Saifullaha AZA, Shahed Iqubala AM, Anirban Sahab. Solar pond and its application to desalination. Asian transactions on Science and Technology. 2012;2.
- Sathish D, Sathish Kumar TR, Jegadheeswaran S. Experimental and theoretical study on efficiency of portable mini solar pond using dissimilar salts. Pak J Biotechnol. 2016;13:15-20.
- Sathish D, Sathish Kumar TR. Effective study on solar pond and its various performance, proceedings in international conference on innovative research in engineering and technology (iCIRET2015). 2015.
- Sifuna DB, Kinyanjui TK, Ndiritu FG, et al. Comparison of thermal storage efficiency of solar pond with and without a polyethene membrane. Int J Sci Res Pub. 2014;4.
- Goutham K, Siva Krishna C. Solar pond technology. Int J Eng Res Gen Sci. 2013;1.


