Review
, Volume: 12( 11)Even if the Anthropogenic Emissions Continue Unabated, it is Unlikely that Antarctica will Contribute more than a Meter of Sea-level Rise by 2100 and more than 15 Meters by 2500
- *Correspondence:
- Parker A , School of Engineering and Physical Science, James Cook University, Townsville QLD 4811, Australia, E-mail: albert.parker.2014@gmail.com
Received: June 25, 2016; Accepted: November 27, 2016; Published: November 30, 2016
Citation: Parker A. Even if the Anthropogenic Emissions Continue Unabated, it is Unlikely that Antarctica will Contribute more than a Meter of Sea-level Rise by 2100 and more than 15 Meters by 2500. Environ Sci Ind J. 2016;12(11):123.
Abstract
A recent paper has claimed based on computer models that if the anthropogenic emissions continue unabated, Antarctica will contribute more than a metre of sea-level rise by 2100 and more than 15 metres by 2500. We show as the actual measurements do not support any Antarctic warming, Antarctic ice melting and accelerating sea level rises linked to the anthropogenic carbon dioxide emission. This makes extremely unlikely the claimed occurrences.
Keywords
Anthropogenic; Antarctic warming; Oscillations; Sea level
Introduction
De et al. [1] use a model coupling ice sheet and climate dynamics calibrated against Pliocene and Last Interglacial sea level estimates and applied to future greenhouse gas emission scenarios to conclude that Antarctica has the potential to contribute more than a metre of sea-level rise by 2100 and more than 15 metres by 2500 if the anthropogenic emissions continue unabated. The authors should have mentioned that the evidence of some ice melting in Antarctica that is linked to the anthropogenic carbon dioxide emission is still missed in the many direct and indirect measurements we do have available.
Experimental Evidence for Antarctic Temperature and Ice Thickness and Area
The increasing Antarctic sea ice area as monitored by satellite since 1978 is acknowledge also by the National Snow and Ice Data Center (NSIDC) [2]. This result is consistent with the measurements of the lower troposphere temperature by satellite also available since 1978, as a local cooling is also acknowledged by the Remote Sensing Systems (RSS) [3].
Regarding the ice thickness, it must be mentioned that there is no satellite estimation of this parameter, but actually only a computation. The thickness variation is indeed the difference in between the vertical rise of the upper surface of the ice monitored by satellite and the vertical rise of the lower surface of the ice, i.e., of the land beneath, computed by one glacial isostatic adjustment model [4,5]. At present, there is therefore no reliable estimation of the ice thickness variation, as the error largely exceeds the trend by orders of magnitude [4,5].
Experimental Evidence for Global Sea Levels
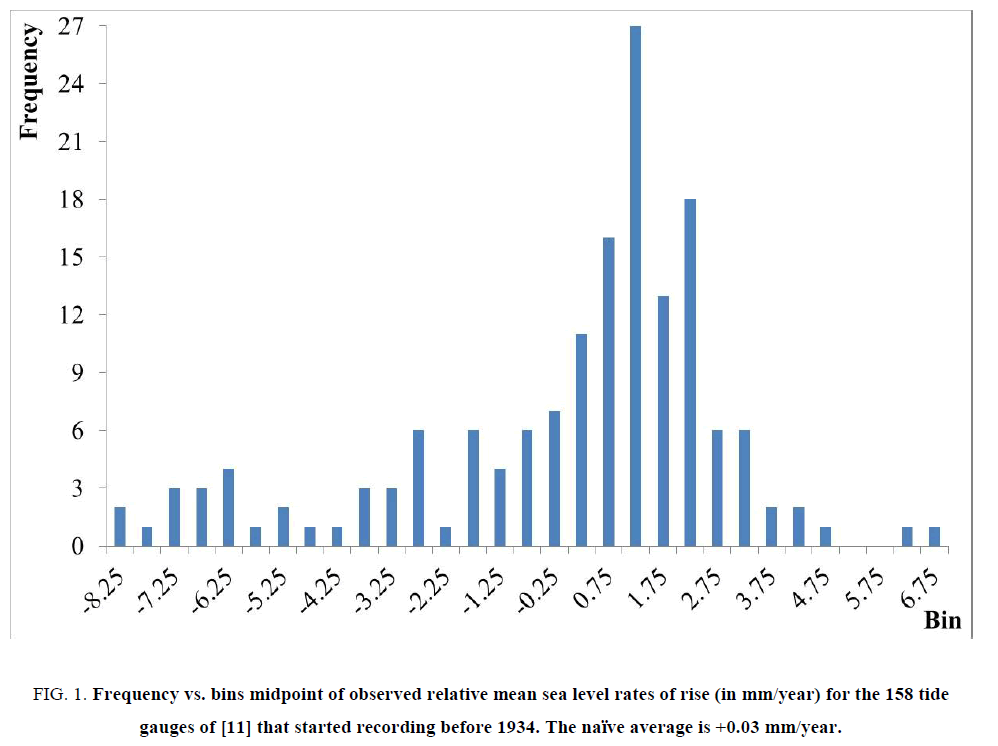
By comparing the relative rates of rise of sea levels measured by the long term tide gauges over the last few decades, there has been no acceleration, but only oscillations, with small changes in positive and negative cancelling each other in the naïve average [6-9]. If we do consider all the tide gauges in the latest PSMSL survey of relative mean sea level secular trends [10,11] that started recording before 1934, this subset of 158 tide gauges has a naïve average relative rate of rise of +0.03 mm/year, maximum +6.75 mm/year, minimum -8.09 mm/year, Figure 1.
Figure 1: Frequency vs. bins midpoint of observed relative mean sea level rates of rise (in mm/year) for the 158 tide gauges of [11] that started recording before 1934. The naïve average is +0.03 mm/year.
If we do consider all the tide gauges with at least 70 years of recorded data in 2014, this subset of 157 tide gauges has a naïve average relative rate of rise of +0.08 mm/year, maximum +6.75 mm/year, minimum -13.22 mm/year.
If we do consider all the tide gauges with at least 60 years of recorded data in 2014, this subset of 212 tide gauges has a naïve average relative rate of rise of +0.41 mm/year, maximum +9.41 mm/year, minimum -13.22 mm/year. This different value only reflects the different populations, with more tide gauges recently being established in areas subject to subsidence rather than uplift.
In the best spots along the world coastlines where the sea level rise is assessed, the naïve average rate of rise is both a pretty constant value and a quite small value.
These naïve average relative rates of rise translate in a little bit less than half a millimetrie to little bit more than one millimetre (long term tide gauges) or at the most 6 millimeters (all the tide gauges satisfying the minimum requirement of 60 years to infer a reliable trend) naïve average sea level rise over the first 15 years of this century no matter the anthropogenic carbon dioxide emission. This makes extremely unlikely the predictions of [1].
Conclusions
If the melting of the Antarctic ice is not proven yet [2,4,5], similarly to the warming of the Antarctica [3,10], and if the sea levels have not accelerated yet in every coastline location where there is a long-term tide gauge [6-9], the claim the sea level is rising because of the melting of the Antarctic ice due to the anthropogenic carbon dioxide emission is pure speculation. As there is no proof the anthropogenic emission is driving the melting of the Antarctic ice, it is unlikely that Antarctica will contribute more than a metre of sea-level rise by 2100 and more than 15 metres by 2500 no matter what the anthropogenic carbon dioxide emission could be.
References
- De RM, Pollard D (2016) Contribution of Antarctica to past and future sea-level rise. Nature 531: 591-597.
- http://nsidc.org/
- http://images.remss.com/msu/msu_time_series.html
- Parker A (2014) Discussion of Increased Ice Losses From Antarctica Detected By Cryosat-2 – Short Periods Of 3 Years Of Data Should Not Be Used To Infer Any Trend. Environmental Science: An Indian Journal 9: 431-437.
- Parker A (2015) The Coupled GRACE/GIA Evaluation of the Antarctic Ice Mass Loss is Unreliable. Journal of Scientific Research and Reports 7: 240-246.
- Parker A (2013) Oscillations of sea-level rise along the Atlantic coast of North America north of Cape Hatteras. Natural Hazards 65: 991-997.
- Parker A (2013) Sea-Level Trends At Locations Of The United States With More Than 100 Years Of Recording. Natural Hazards 65: 1011-1021.
- Parker A, Saad Saleem M, Lawson M (2013) Sea-Level Trend Analysis for Coastal Management. Ocean & Coastal Management 73: 63-81.
- Parker A, Ollier CD (2016) Coastal Planning Should Be Based On Proven Sea-Level Data. Ocean and Coastal Management 124: 1-9.
- Parker A (2014) Pattern Recognition Of Temperature Trends For Antarctica From Linear And Nonlinear Regression Analyses. Nonlinear Engineering 3:179-187.
- http://www.psmsl.org/products/trends/trends.txt


