Research
, Volume: 21( 1)Environmental Assessment and Photodegradation of Narmada River Water and Tawa Dam Reservoir by ZnO Nano Catalyst
- *Correspondence:
- Arti Singh
Department of Chemistry,
Government Narmada College Narmadapuram,
Narmadapuram,
Madhya Pradesh,
India,
Tel: 9424668910;
E-mail: artisinghbaghel@gmail.com
Received date: April 12, 2023, Manuscript No. TSIJCS-23-95506; Editor assigned date: April 14, 2023, PreQC No. TSIJCS-23-95506 (PQ); Reviewed date: April 28, 2023, QC No. TSIJCS-23-95506; Revised date: June 27, 2023, Manuscript No. TSIJCS-23-95506 (R); Published date: July 04, 2023, DOI: 10.37532/0972-768X.2023.21(1).433
Citation: Singh A, Choubey ON. Environmental Assessment and Photodegradation of Narmada River water and Tawa Dam reservoir by ZnO Nano Catalyst. Int J Chem Sci. 2023;21(1):433.
Abstract
Narmada river water is the main source of drinking, irrigation, fish culture and other important activities for central India. Hence the present investigations and plane of work is consisting to observe the chemical and physical constituents of Narmada river water flow. The quality of water with the view to being out a transparence image of the water pollution status of river and assessment of its effect and bringing forth suggestion for improvement. Through study is to be carried out. The sample collection, preservation and pretreatment will be according to standard method of collecting samples at international level i.e. APHA and WHO procedure. Prior to this a through survey will be conducted to know about probable pollution source and other relevant features.
Keywords
Water pollution; Quality of water; Assessment; Chemical and physical constituents; Pretreatment
Introduction
Narmada is one of the sacred rivers of India, attracting pilgrims from all parts of the country. It originates from Amarkantak in Shahdol district, at an elevation of 1057 meter above MSL, covers distance of nearly 1312 km and total basin of 98,79,680 sq. km. The Narmada basin is about 1288 km long and 80 km broad running from east to west in Madhya Pradesh, occupies a central position in the country and empties into the Gulf of Cambay below broach [1-3].
In the present study Narmada river and Tawa dam reservoir are selected. One is the example of the floating water and the other is the example of stagnant water. Narmada River is the most important river the Madhya Pradesh, while Tawa dam reservoir is on the Tawa River in central India. It is located in Itarsi of Narmadapuram district of Madhya Pradesh state, above Betul district [4-6].
Due to urbanization and industrialization, environmental pollution is increasing day by day. The disposal of city waste, sewage and industrial effluents is becoming a major problem. The present study has been carried out to evaluate the impact of man induced environmental changes on the water quality through variation in the chemical and microbiological properties at different locations [7].
Materials and Methods
The river Narmada has been surveyed throughout the year, over a distance of about four sampling sites were selected. In Narmada site first is situated at “Sethani ghat” second site is the “Paramhansh ghat” third site is the “Vivekananda ghat” and forth is the “Post office ghat”. Here many people take bath and wash their cloths daily and also where continuous discharge of domestic sewage of the city is going on. Tawa dam reservoir site is situated site A5 and site A6 [8].
The various physico chemical and biological parameters were determined as per methods suggested by APHA. Temperature, pH and dissolve oxygen were recorded immediately after collection of samples at the sites, while other parameters were analyzed in laboratory within 24 hours samples for the planktons were collected simultaneously and sedimentations were made in glass jars, after adding 10 ml of acid Lysol’s solution for preservation. After 24 hours, the supernatant was discharged then remaining 25 ml of sediments was taken on glass slide and plankton’s number counted under the microscope. Their estimation was made by drop method [9,10].
Nanoparticles
The fundamentals of nanotechnology are that the properties of substances change significantly when their size is reduced to the nanometer range. When a bulk material is divided into small particles in one are more dimensions in the nanometer range or even smaller, the individual particles show unexpected properties that are completely different from those of the bulk material. Bulk solids have continuous physical properties.
Ultrafine particles, nanoparticles are between 1 nm to 100 nm in size. The properties that distinguish nanoparticles from bulk material generally develop at a critical length of less than 100 nm. Nanoparticles may or may not have size related properties that are significantly different from those seen in fine particles or bulk solids.
ZnO nano catalyst
Nano materials are largely due to the large surface area of the materials, which dominates the contributions of the small mass of the material E. Roduner.
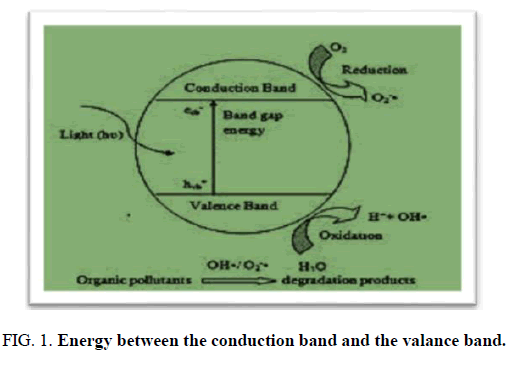
The distinguishing in energy between the conduction band and the valance band is called the band gap. ZnO haves valence band is 3, conduction band is -0.2, band gap 3.2(eV) and band gap wavelength (nm) is 387.
It is a white powder that is almost insoluble in water. ZnO semiconductor has several advantageous properties: Good transparency, high electron mobility, large band gap, strong luminescence at room temperature etc. Zinc oxide is non-toxic and skin compatible, making it a suitable additive for textiles and surfaces in contact with humans. It is also used as a catalyst for the synthesis of methanol. Increasing the surface area of zinc oxide at the nanoscale compared to larger powders.
Results
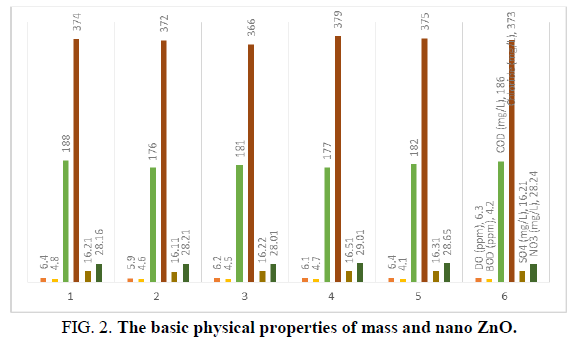
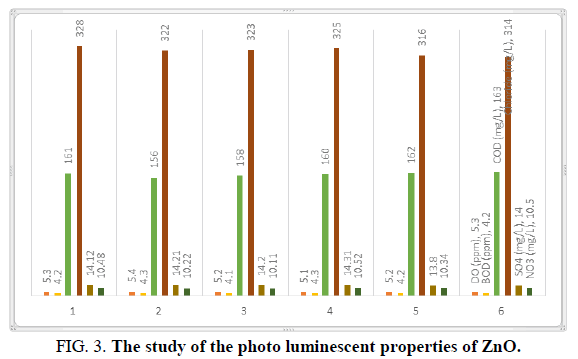
The basic physical properties of mass and nano ZnO differ significantly; the study of the photo luminescent properties of ZnO confirmed that quantum confinement increases the energy of band the gap of ZnO (Figures 1-3). The change in band gap energy of ZnO nano particles also shows such size dependence. Improving surface conditions by making ZnO nanorods smaller is also well established (Tables 1 and 2).
FIG 1: Energy between the conduction band and the valance band.
| S. no. | Parameters | Site I | Site II | Site III | Site IV | Site V | Site VI |
|---|---|---|---|---|---|---|---|
| 1 | pH | 8.2 | 8.3 | 8.0 | 8.5 | 7.9 | 8.1 |
| 2 | Conductivity | 0.18 | 0.16 | 0.15 | 0.18 | 0.18 | 0.17 |
| 3 | TA (mg/L) | 161 | 164 | 162 | 180 | 172 | 168 |
| 4 | TH (mg/L) | 232 | 222 | 231 | 198 | 228 | 226 |
| 5 | DO (ppm) | 6.4 | 5.9 | 6.2 | 6.1 | 6.4 | 6.3 |
| 6 | BOD (ppm) | 4.8 | 4.6 | 4.5 | 4.7 | 4.1 | 4.2 |
| 7 | COD (mg/L) | 188 | 176 | 181 | 177 | 182 | 186 |
| 8 | TDS (mg/L) | 327 | 329 | 341 | 325 | 333 | 336 |
| 9 | TSS (mg/L) | 839 | 826 | 822 | 835 | 813 | 802 |
| 10 | Chloride (mg/L) | 374 | 372 | 366 | 379 | 375 | 373 |
| 11 | Fluoride (mg/L) | 0.6 | 0.6 | 0.5 | 0.6 | 0.5 | 0.5 |
| 12 | Ca (mg/L) | 276 | 268 | 271 | 273 | 274 | 272 |
| 13 | Mg (mg/L) | 19.23 | 18.60 | 18.21 | 19.11 | 19.33 | 19.22 |
| 14 | SO4 (mg/L) | 16.21 | 16.11 | 16.22 | 16.51 | 16.31 | 16.21 |
| 15 | NO3 (mg/L) | 28.16 | 28.21 | 28.01 | 29.01 | 28.65 | 28.24 |
| 16 | Na (mg/L) | 57.02 | 56.00 | 56.78 | 57.00 | 56.08 | 57.1 |
| 17 | K (mg/L) | 4.81 | 4.80 | 4.30 | 4.33 | 4.77 | 4.80 |
| 18 | E. coli (CFU/100) | 58000 | 57500 | 57800 | 58100 | 57600 | 57500 |
TABLE 1. Physico chemical parameters at sampling sites in river Narmada and Tawa dam reservoir.
| S. no. | Parameters | Site I | Site II | Site III | Site IV | Site V | Site VI |
|---|---|---|---|---|---|---|---|
| 1 | pH | 7.1 | 7.2 | 7.0 | 7.5 | 7.1 | 7.4 |
| 2 | Conductivity | 0.12 | 0.13 | 0.12 | 0.11 | 0.12 | 0.12 |
| 3 | TA (mg/L) | 132 | 128 | 126 | 131 | 132 | 133 |
| 4 | TH (mg/L) | 203 | 196 | 201 | 203 | 204 | 202 |
| 5 | DO (ppm) | 5.3 | 5.4 | 5.2 | 5.1 | 5.2 | 5.3 |
| 6 | BOD (ppm) | 4.2 | 4.3 | 4.1 | 4.3 | 4.2 | 4.2 |
| 7 | COD (mg/L) | 161 | 156 | 158 | 160 | 162 | 163 |
| 8 | TDS (mg/L) | 368 | 358 | 362 | 361 | 357 | 363 |
| 9 | TSS (mg/L) | 745 | 712 | 743 | 702 | 729 | 724 |
| 10 | Chloride (mg/L) | 328 | 322 | 323 | 325 | 316 | 314 |
| 11 | Fluoride (mg/L) | 0.52 | 0.48 | 0.47 | 0.51 | 0.52 | 0.53 |
| 12 | Ca (mg/L) | 241 | 231 | 236 | 235 | 239 | 242 |
| 13 | Mg (mg/L) | 17.22 | 17.02 | 17.17 | 17.3 | 17.33 | 17.23 |
| 14 | SO4 (mg/L) | 14.12 | 14.21 | 14.20 | 14.31 | 13.80 | 14.00 |
| 15 | NO3 (mg/L) | 10.48 | 10.22 | 10.11 | 10.52 | 10.34 | 10.50 |
| 16 | Na (mg/L) | 52.32 | 52.01 | 51.55 | 52.02 | 52.55 | 52.44 |
| 17 | K (mg/L) | 4.10 | 4.20 | 4.30 | 4.02 | 4.00 | 4.33 |
| 18 | E. coli (CFU/100) | 21400 | 20200 | 21200 | 21100 | 23100 | 23200 |
TABLE 2. After photodegradation by ZnO nanocatalyst physico chemical parameters at sampling sites in river Narmada and Tawa dam reservoir.
Observations
The survey of the river water resources includes the identification and characterization of sites, which cause the pollution problems.
Discussion
Several physico chemical and biological parameters and their variability have been studies in relation to the pollution of Narmada river water and Tawa dam reservoir. The chemical analysis showed that polluted sites contained high values of chloride, total hardness, alkalinity, E. coli and Coli from count, but very low dissolve oxygen, which indicated a high pollution load.
Conclusion
Photocatalytic water treatment by nano catalyst is a hot topic for pollutant degradation. ZnO has a unique property for above work because it has band gap 3.2(eV) and band gap wavelength (nm) is 387, low operating cost, simple morphology design, nontoxic and have a band gap energy.
References
- United Nations Environment Programme (UNEP). Groundwater and its susceptibility to degradation: A global assessment of the problem and options for management. UNDP. 2003.
- Rice EW, Bridgewater L. Standard methods for the examination of water and wastewater. 23rd edition, American Public Health Association, USA. 2012.
- Maiti SK. Handbook of methods in environmental studies. 2nd edition, Jaipur, ABD Publication, India, 2003.
- ICMR (Indian Council of Medical Research). Manual of standards of quality for drinking water supplies. Special Report. 1957;44:27.
- Sharma S, Vishwakarma R, Dixit S, et al. Evaluation of water quality of Narmada river with reference to physicochemical parameters at Hoshangabad city, MP, India. Res J Chem Sci. 2011;1(3):40-48.
- Tali I, Pir Z, Sharma S, et al. Physicochemical properties of water of river Narmada at Madhya Pradesh, India. Researcher. 2012;4(6):5-9.
- Pir Z, Tali I, Mudgal LK, et al. Evaluation of water quality: Physicochemical characteristics of river Narmada at Madhya Pradesh, India. Researcher. 2012;4(5):63-67.
- Peltier S, Cotte M, Gatel D, et al. Nanofiltration: Improvements of water quality in a large distribution system. Water Sci Technol. 2003;3(1-2):193-200.
- Wong YC, Sanggari V. Bioethanol production from sugarcane bagasse using fermentation process. Oriental J Chem. 2014;30(2):507-513.
- Frimmel FH, Niessner R. Nanoparticles in the water cycle properties, analysis and environmental relevance. New York, Springer Publication, United States, 2010.


