Original Article
, Volume: 8( 1)Electrochemical Characterization of Xipamide Using Cyclic and Square Wave Voltammetry
- *Correspondence:
- Ali Kamal Attia , National Organization for Drug Control and Research, Cairo, Egypt, Tel: +20 238702103; Fax: +20 235855582; E-mail: alikamal1978@hotmail.com
Received: March 08, 2017; Accepted: March 24, 2017; Published: March 29, 2017
Citation: Attia AK, Hendawy HM. Electrochemical Characterization of Xipamide Using Cyclic and Square Wave . Res Rev Electrochem. 2017;8(1):104.
Abstract
The electrochemical behaviour of xipamide was studied at glassy carbon electrode in Britton-Robinson buffer solution of different pH values ranging from 2.0 to 7.0 using cyclic voltammetry and square wave voltammetry. Voltammetric results showed a reversible redox and diffusion-controlled process. The oxidation and reduction peaks were found at potentials of 0.375 V and 0.321 V at pH 5.0, respectively. While the reported voltammetric method 2 shows irreversible oxidation process for xipamide and having higher detection limit than the proposed method. Linear responses were obtained over concentration ranges of 5.0 × 10⁻⁸ to 6.46 × 10⁻⁷ mol L-1 and 5.0 × 10⁻⁸ to 9.90 × 10⁻⁷ mol L-1 with detection limits of 3.97 × 10⁻⁹ mol L-1 and 3.30 × 10⁻⁹ mol L-1 for oxidation and reduction processes, respectively. Sensitivity, precision and accuracy were evaluated. The proposed method is suitable for the quality control of xipamide in bulk, commercial formulations and urine.
Keywords
Xipamide; Glassy carbon electrode; Square wave ; Urine
Introduction
Xipamide (XIP) is a sulfonamide diuretic drug Figure. 1, chemically designated as 5-(Aminosulphonyl)-4-chloro-N-(2,6-dimethylphenyl)-2-hydroxy-benzamide. It is used for the treatment of high blood pressure and edema of cardiac, hepatic, or renal origin. It is a nonthiazide diuretic with a greater natriuretic effect than the thiazides and a less abrupt onset and longer duration of action [1].
Only few methods have been published for the determination of XIP including [2], high performance liquid chromatography (HPLC) [3-5], spectrophotometry [6], spectrophotometry and spectrofluorimetry [7,8], spectrophotometry and spectrodensitometry [9] and spectrofluorimetry [10,11].
Square wave (SWV) allows the use of faster scan rates than differential pulse (DPV). SWV offers both forward and reverse square wave to the system, that allows desorption of any adsorbed intermediate on the surface. In DPV the working electrode is maintained at the base potential for time approaching a full second to establish a deep diffusion layer before every pulse. This affords very slow scan rates, normally in the range of a few mVs-1. SWV is therefore an inherently faster technique. SWV is also slightly superior to DPV in its ability to reject capacitive charging currents and offers thus an edge in terms of sensitivity. Overall, SWV appears as a highly promising and powerful electrochemical technique [12,13].
The electrochemical treatment or activation of glassy carbon electrode (GCE) is one of the most widely used techniques that are often carried by potentiostatic polarization at a suitable potential or by potential cycling in a wide range. It is believed that the oxidative pretreatment could produce oxygen containing functional groups such as hydroxyl, carbonyl, carboxyl and quinones on carbon surfaces, which are responsible for the improved performances of carbon electrodes [14-17].
Only one voltammetric method has been reported for the determination of XIP at carbon paste electrode (CPE) using differential pulse (DPV) and linear scan (LSV). Therefore, this study was involved to develop and validate a simple, specific, accurate, and precise new voltammetric method for determination of XIP at GCE using square wave (SWV).
Experimental
Apparatus
All Voltammetric experiments were performed using a Metrohm Computrace voltammetric analyzer model 797 VA with Software Version 1.0 (Metrohm Switzerland). The cell stand included a three-electrode system, a glassy carbon disc electrode as working electrode (mini glassy carbon disk electrode of the active zone: 2.8 mm, for ELCD 641/656), an Ag/AgCl (3.0 mol L-1 KCl) as reference electrode and a platinum wire counter electrode were used. A digital pH meter (JEANWAY 3510) with a glass combination electrode was used for the preparation of buffer solutions.
Chemicals and reagents
Xipamide and its dosage form, Epitens tablets (each tablet contains 10 mg XIP + 30 mg Triamterene), were kindly provided by Egyptian INT. Pharmaceutical Industries CO. (EIPICO), Egypt. Stock solution of XIP (1.0 × 10⁻³ mol L-1) was prepared by dissolving an appropriate amount of XIP in methanol. The stock solution was stored in a refrigerator. Britton-Robinson (BR) buffer was prepared by mixing the acid mixture containing phosphoric acid (0.04 mol L-1), acetic acid (0.04 mol L-1) and boric acid (0.04 mol L-1). Buffer solutions were adjusted by adding the necessary amount of 2.0 mol L-1 NaOH solution in order to obtain the appropriate pH value. All chemicals were of analytical grade and used without further purification.
Electrochemical pretreatment of GCE
GCE was polished with alumina powder to a mirror finish surface. After rinsing with deionized water, GCE was cleaned in an ultrasonic bath for three minutes. Electrochemical pretreatment of GCE was performed by anodic oxidation at +1.5 V for 120 s in Britton-Robinson (BR) buffer solution (pH 5.0). The electrode was then cycled between -1.0 V and +1.0 V at a scan rate of 100 mVs-1 until a stable voltammogram was obtained.
Effect of instrumental parameters
The optimum instrumental conditions for the determination of XIP by using SWV method were chosen from the study of the variation of the peak current with pulse amplitude, frequency and scan rate. During the study, each parameter was changed while the others were kept constant: pulse amplitude over the range from 10 mV to 100 mV, frequency from 10 Hz to 100 Hz and scan rate from 20 mV s-1 to 400 mV s-1.
Determination of XIP in bulk powder
Aliquots of XIP standard solution (1.0 × 10⁻³ mol L-1) were added to a series of 10 mL volumetric flasks so that the final concentrations are in the range of 5.0 × 10⁻⁸ - 9.90 × 10⁻⁷ mol L-1, then well mixed and completed to the mark with BR buffer of pH 5.0. Transfer the whole contents of the flask into the voltammetric cell. SWV technique was applied by scanning from 0.0 V to 1.2 V with scan rate of 100 mVs-1. The current (I) was plotted versus the corresponding concentration to get the calibration curve of XIP.
Determination of XIP in tablets
Twenty tablets were accurately weighed and powdered in a mortar. The required amount from the crushed tablets powder was dissolved in about 30 mL of methanol and filtered in 100 mL measuring flask. The residue was washed three times and the volume was completed to the mark by the same solvent. 10 mL of BR buffer (pH 5.0) were introduced into the voltammetric cell and suitable volume of the above tablets solution was pipetted into the buffer in the voltammetric cell. The nominal content of the tablets is calculated using standard addition technique.
Determination of XIP in urine
The urine samples obtained from healthy person were used for measurements. Add 1.0 mL of urine into a series of 10 mL volumetric flasks, and then add different aliquots of XIP standard solution (1.0 × 10⁻³ mol L-1), mix well and complete to the mark with BR buffer of pH 5.0 to obtain the final concentrations in the range of 5.0 × 10⁻⁸ - 9.90 × 10⁻⁷ mol L-1. The procedures described under construction of calibration curve were followed.
Results and Discussion
Electrochemical behavior of XIP
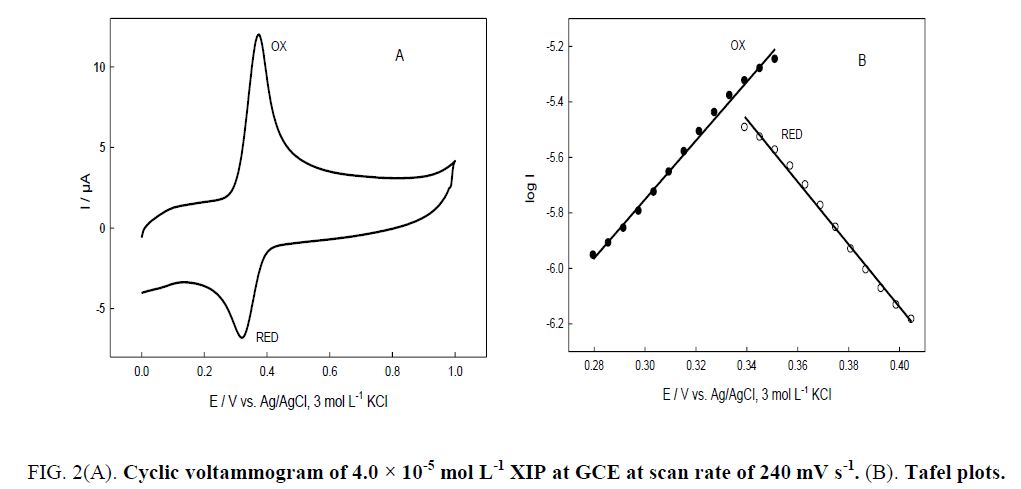
The electrochemical behavior of XIP was studied using cyclic technique (CV). The CV voltammogram of 4.0 × 10⁻⁵ mol L-1 XIP in BR buffer of pH 5.0 at scan rate of 240 mVs-1. Figure. 2A, showed one anodic peak (anodic peak current (Ipa) =12.016 μA, anodic peak potential (Epa)=0.375 V) and cathodic peak (cathodic peak current (Ipc)=6.808 μA, cathodic peak potential (Epc)=0.321 V) in the reverse scan. The electrons involved in the reaction can be calculated by the formula of ω1/2=62.4/αn [18], where ω1/2 is the peak width at half height, n is the number of electrons transferred, and α is the transfer coefficient of an electron with α value that is often between 0.4 and 0.6.
Figure 2: 2(A). Cyclic voltammogram of 4.0 × 10⁻⁵ mol L-1 XIP at GCE at scan rate of 240 mV s-1. (B). Tafel plots.
Tafel region is affected by the electron transfer kinetics between XIP and GCE. The number of electrons transferred (with α=0.5) was calculated to be n=1.05 for oxidation process and n=1.17 reduction process, indicating that n≈1 in case of the redox process of XIP. Tafel plots are composed of an anodic part for positive over potentials and cathodic part for negative over potentials Figure. 2B. The slope of the linear region of Tafel plot can be used to calculate α, oxidation slope=n (1-α) F/2.3RT and reduction slope=- αnF/2.3RT, where F is the faraday's constant (96485 J), R is the universal gas constant (8.314 J K-1 mol-1) and T is equal to 298 K [18]. The calculated α values are 0.38 and 0.66 in case of n=1 for oxidation and reduction processes, respectively. The average value of α=0.52. Hence, only one electron was used in the redox process while in the reported voltammetric method two electrons were used through the irreversible oxidation reaction at CPE [2].
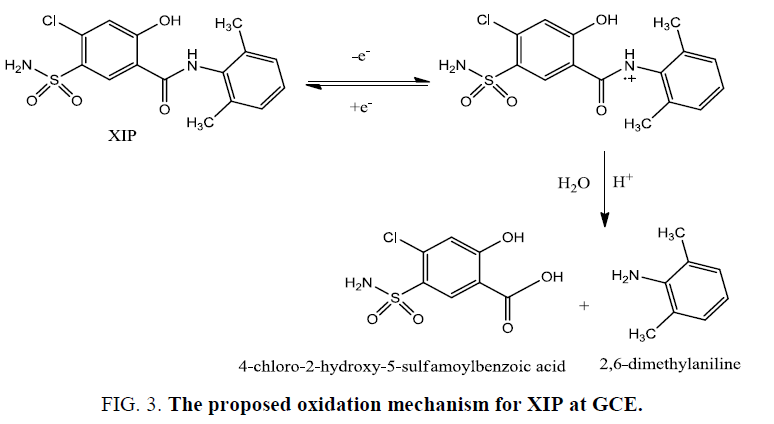
In the reported method XIP shows irreversible oxidation reaction while in our study XIP shows reversible oxidation reaction and suggests that the oxidation occurs at the nitrogen atom of the amide group to produce a cation radical over nitrogen atom showing a great similarity with that observed for the oxidation of propanil and related N-substituted amides [19]. This is followed by water attack as nucleophile to produce 2,6-dimethylaniline and 4-chloro-2-hydroxy-5-sulfamoylbenzoic acid as described in Figure. 3. This clarifies the difference in the peak currents and peak shape of the responses in the forward and reverse directions.
Effect of pH
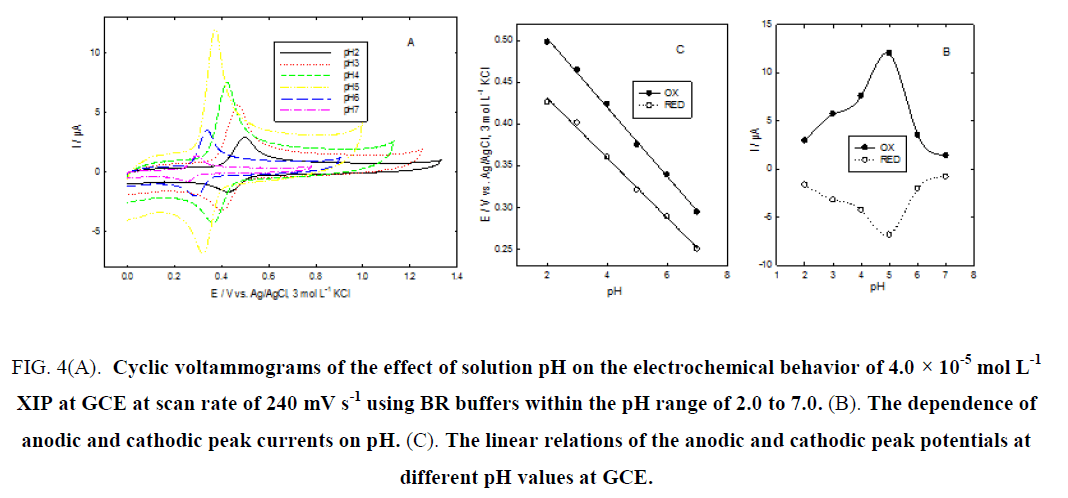
The anodic and cathodic peak potentials shifted negatively with the increase of the solution pH, indicating that the oxidation/reduction process is a pH-dependent reaction and that protons have taken part in their electrode reaction processes Figure. 4A. XIP showed a variation of peak potentials with pH. The dependences of peak current (Ip) and peak potential (E) on pH values show that the oxidation and reduction peak currents increase with increasing pH value up to 5.0 then they decrease with increasing pH Figure. 4B and Figure. 4C, shows the plots of oxidation and reduction peak potentials versus pH indicating similar behavior for both oxidation and reduction processes and vary linearly with pH with linear regression equations of E (V)=-0.053 pH + 0.585 and E (V)=-0.048 pH + 0.503 for oxidation and reduction processes, respectively.
The slopes were found to be -53 mV/pH and -48 mV/pH units over the pH range from 2.0 to 7.0, which is close to the theoretical value of -59 mV. This indicated that the number of protons and transferred electrons involved in this mechanism is equal [20-22]. The best results were obtained in BR buffer solution of pH 5.0 and this pH was used in subsequent experiments.
Effect of scan rate
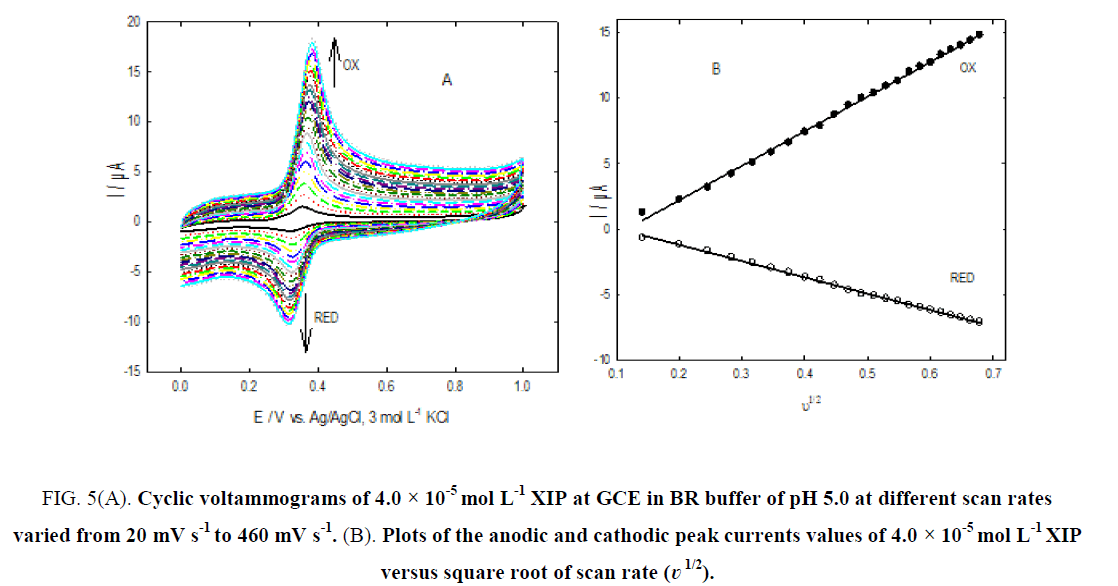
Figure. 5A, shows the cyclic voltammograms of 4.0 × 10⁻⁵ mol L-1 XIP in BR buffer of pH 5.0 at GCE using different scan rate (?) values varied from 20 mV s-1 to 460 mV s-1. Figure. 5B, shows linear plots of anodic and cathodic peak currents versus the square root of the scan rate (?1/2) with the linear regression equations as: I (μA)=26.34 ?1/2 -3.055, r (correlation coefficient)=0.9990 and I (μA)=-12.438 ?1/2 + 1.298, r (correlation coefficient)=0.9994 for oxidation and reduction processes, respectively. The results suggest diffusion-controlled process of XIP [23,24]. The following relation used to characterize reversible reaction: ΔEp=Epa-Epc=59/n mV at 298 K [25], the difference between anodic peak potentials and cathodic peak potentials over the entire scan rate range has the average value of 52 mV which emphases that the electrochemical behavior of XIP is reversible reaction process and the number of electrons used in this process is equal to one.
Figure 5: (A). Cyclic voltammograms of 4.0 × 10⁻⁵ mol L-1 XIP at GCE in BR buffer of pH 5.0 at different scan rates varied from 20 mV s-1 to 460 mV s-1. (B). Plots of the anodic and cathodic peak currents values of 4.0 × 10⁻⁵ mol L-1 XIP versus square root of scan rate (?1/2).
Effect of instrumental parameters in SWV
It was found that the values of 20 mV, 50 Hz and 100 mVs-1 were finally chosen for pulse amplitude, frequency and scan rate, respectively to obtain relatively high and narrow peak currents in the determination of XIP.
Determination of XIP in bulk powder
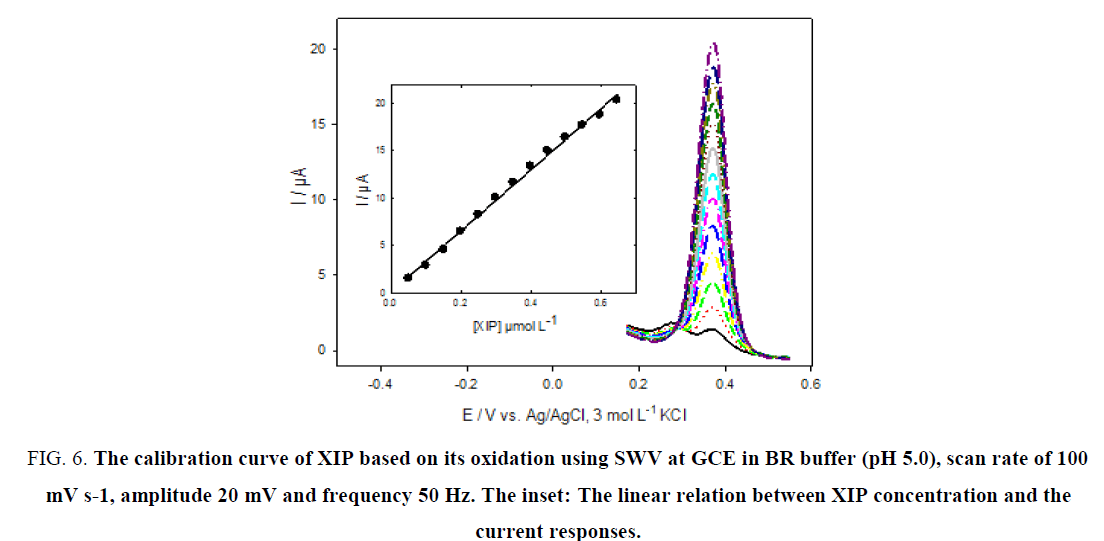
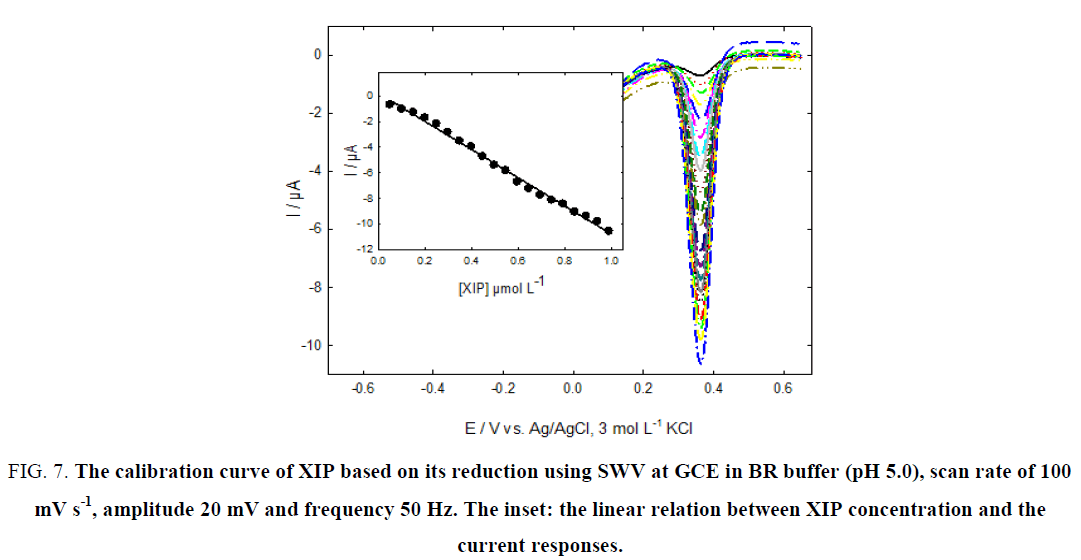
Figure 6 and 7, show the calibration curves of XIP based on its redox reaction at GCE using SWV with good linearity over the concentration ranges of 5.0 × 10⁻⁸ to 6.46 × 10⁻⁷ mol L-1 and 5.0 × 10⁻⁸ to 9.90 × 10⁻⁷ mol L-1 with correlation coefficients of 0.9982 and 0.9973 for oxidation and reduction processes, respectively.
Figure 6: The calibration curve of XIP based on its oxidation using SWV at GCE in BR buffer (pH 5.0), scan rate of 100 mV s-1, amplitude 20 mV and frequency 50 Hz. The inset: The linear relation between XIP concentration and the current responses.
Figure 7: The calibration curve of XIP based on its reduction using SWV at GCE in BR buffer (pH 5.0), scan rate of 100 mV s-1, amplitude 20 mV and frequency 50 Hz. The inset: the linear relation between XIP concentration and the current responses.
The limits of detection (LOD) and quantification (LOQ) were calculated by using the following equations: LOD=3SD/m and LOQ=10 SD/m, where “SD” is the standard deviation of the intercept of the calibration curve and “m” is the slope of the calibration curve [26]. The results are listed in Table. 1.
| Parameter | Oxidation process | Reduction process |
|---|---|---|
| Concentration range (mol L-1) | 5.0 × 10⁻⁸to 6.46 × 10⁻⁷ | 5.0 × 10⁻⁸to 9.90 × 10⁻⁷ |
| Regression equation | 83I (μA)=32.27 C (μ mol L-1) + 0.0 | I (μA)=-11.00 C (μ mol L-1) + 0.215 |
| Correlation coefficient (R) | 0.9982 | 0.9973 |
| %Recovery | 99.32-101.54 | 99.64-100.97 |
| %RSD | 0.458-0.893 | 0.521-1.125 |
| LOD (mol L-1) | 3.97 × 10⁻⁹ | 3.30 × 10⁻⁹ |
| LOQ (mol L-1) | 1.32 × 10⁻⁸ | 1.10 × 10⁻⁸ |
Table 1: Qualities associated with minion coils.
The low values of LOD: 3.97 × 10⁻⁹ mol L-1 for oxidation process and 3.30 × 10⁻⁹ mol L-1 for reduction process, indicate the high sensitivity of the proposed method when compared by other methods which show higher detection limits such as reported DPV method (3.94 × 10⁻⁷ mol L-1) [2] spectrophotometric methods: (3.66 × 10⁻⁸ mol L-1) [8] and (2.14 × 10⁻⁶ mol L-1) [9] and chromatographic methods: (8.46 × 10⁻⁸ mol L-1) [5] and (5.63 × 10⁻⁸ mol L-1) [10].
Analysis of real samples
The proposed SWV method can be successfully applied to determine XIP in Epitens tablets using standard addition method in the presence of excipients and triamterene (TRI) which is determined by cathodic stripping square wave at mercury electrode which give two irreversible reduction peaks of TRI at -0.65 V and -0.97 [27] and HPLC with electrochemical detection at GCE at 1.3 V [28] while XIP gives oxidation peak at 0.369 V and reduction peak at 0.357 V using SWV indicating the applicability of the proposed method to determine XIP in presence of TRI and excipients emphasized by the good values of percentage recovery and relative standard deviation as shown in Table 2.
| XIP μmol L-1 | Oxidation process | Reduction process | |||||
|---|---|---|---|---|---|---|---|
| Taken | Added | Found | %RSD* | %Recovery | Found | %RSD* | %Recovery |
| 0.1 | 0.1 | 0.203 | 0.754 | 101.50 | 0.201 | 1.066 | 100.50 |
| 0.2 | 0.298 | 0.682 | 99.333 | 0.298 | 0.604 | 99.333 | |
| 0.3 | 0.405 | 0.594 | 101.25 | 0.407 | 0.545 | 101.75 | |
| 0.4 | 0.508 | 0.815 | 101.60 | 0.503 | 0.872 | 100.60 | |
| 0.5 | 0.602 | 0.877 | 100.33 | 0.599 | 0.988 | 99.833 | |
| Mean recovery ± %RSD* | 100.80 ± 0.744 | 100.40 ± 0.815 | |||||
*Different concentration of XIP; number of replicates (n)=5
Table 2:Determination of XIP in Epitens tablets.
The results obtained were compared statistically with those from reported spectrophotometric method [8] by using Student’s t-test and the variance ratio F-test. The results in Table 3, show that the t and F values were smaller than the critical values, indicating that the student t-test and variance ratio F-test excluded any significant differences between the proposed method and the reported method with respect to accuracy and precision.
| Claimed (mg/tab) | Reported method [8] | Oxidation process | Reduction process |
|---|---|---|---|
| Recovery (%) ± RSDa | Recovery (%) ± RSDa | Recovery (%) ± RSDa | |
| 10 | 99.86 ± 1.19 | 100.80 ± 0.744 | 100.40 ± 0.815 |
| F-testb (6.39) | 2.24 | 2.68 | |
| t-testb (2.78) | 0.97 | 1.052 | |
aAveraged from five determinations.bTabulated F and t values at 95% confidence level [26]
Table 3: Determination of XIP in Epitens tablets compared with the reported method[8].
Determination of XIP in urine
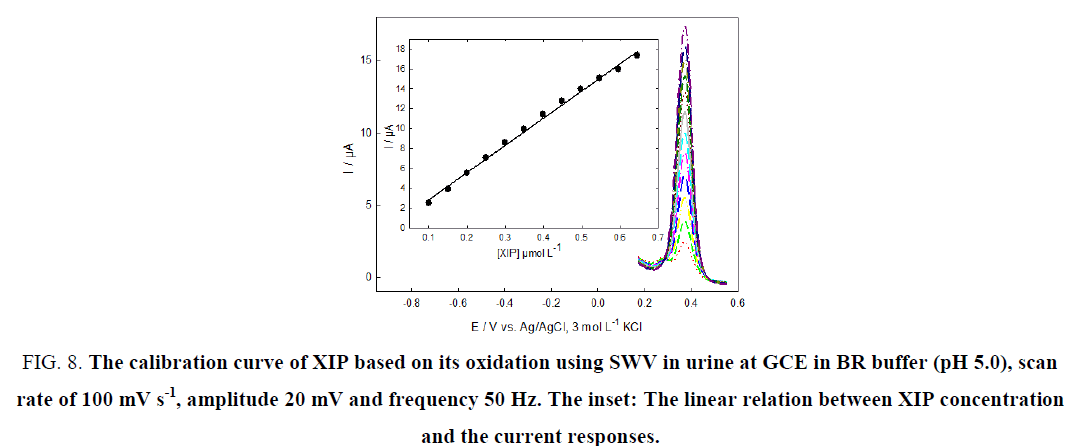
The applicability of the proposed method to the determination of XIP in spiked human urine samples was investigated in case of oxidation and reduction process, respectively Figure. 8 and 9. The results are satisfactorily accurate, precise and sensitive to determine this drug in urine as shown in Table 4.
Figure 8: The calibration curve of XIP based on its oxidation using SWV in urine at GCE in BR buffer (pH 5.0), scan rate of 100 mV s-1, amplitude 20 mV and frequency 50 Hz. The inset: The linear relation between XIP concentration and the current responses.
Figure 9: The calibration curve of XIP based on its reduction using SWV in urine at GCE in BR buffer (pH 5.0), scan rate of 100 mV s-1, amplitude 20 mV and frequency 50 Hz. The inset: The linear relation between XIP concentration and the current responses.
| Parameter | Oxidation process | Reduction process |
|---|---|---|
| Concentration range (mol L-1) | 1.0 × 10⁻⁷ to 6.46 × 10⁻⁷ | 1.50 × 10⁻⁷ to 8.92 × 10⁻⁷ |
| Regression equation | I (μA)=27.314 C (μ mol L-1) + 0.124 | I (μA)=-9.768 C (μ mol L-1) + 0.405 |
| Correlation coefficient (R) | 0.9978 | 0.9973 |
| %Recovery | 99.15-101.94 | 99.24-101.17 |
| %RSD | 0.635 -1.027 | 0.754-1.263 |
| LOD (mol L-1) | 1.84 × 10⁻⁸ | 1.48 × 10⁻⁸ |
| LOQ (mol L-1) | 6.13 × 10⁻⁸ | 4.92 × 10⁻⁸ |
Table 4: The results of the proposed SWV method for determination of XIP in urine.
Conclusion
In this study the electrochemical behavior of XIP differs from that in the reported voltammetric method [2], based on the reversibility, sensitivity and the number of electrons used in the process. The reversible redox behavior of XIP at GCE in BR buffer can be used to determine this drug in bulk drug, dosage forms and urine using SWV method. The procedures were found to be simple, precise, accurate and fast. Analysis of authentic sample containing XIP showed no interference from the excipients and triamterene. The major advantage of the proposed method is that, it does not require a prior extraction step, thus, it is time saving. Moreover, no sophisticated instrumentation is required. Therefore, this method can be conveniently adopted for routine quality control analysis.
Acknowledgement
The authors would like to express their gratitude to National Organization for Drug Control and Research (NODCAR, Egypt) for providing instruments and the means necessary to accomplish this work.
References
- Sweetman SC. The complete drug reference. 37th ed. Martindale: The Pharmaceutical Press; 2011.
- Legorburu MJ, Alonso RM, Jiménez RM. Voltammetric study of the diuretic xipamide. BioelectrochemBioenerg. 1993;32(1):57-66.
- Sane RT, Sadana GS, Bhounsule GJ, et al. High-performance liquid chromatographic determination of xipamide and clopamide in pharmaceuticals. J Chromatogr A1986;356:468-72.
- Legorburu MJ, Alonso RM, Jiménez RM. Determination of the non-thiazide diuretic xipamide in pharmaceuticals and urine by HPLC with amperometric detection. J Liq Chromatogr RelTechnolog. 1999;22(5):735-46.
- El-Kimary EI. Stability-indicating HPLC-DAD method development, validation, and stress degradation studies for triamterene and xipamide in their combined tablet dosage form. Acta Chromatographica. 2015;28(1):79-98.
- Gaber M,Khedr AM, El-Kady AS. Int Res J Pharm Pharmacol. 2011;1:215-20.
- Omar MA. Spectrophotometric and spectrofluorimetric determination of certain diuretics through ternary complex formation with Eosin and Lead (II). J Fluorescence. 2010;20(1):275-81.
- El-Kommos ME, Ahmad AA, Salem H, et al. Spectrophotometric and spectrofluorimetric determination of certain diuretics in pure forms and in their pharmaceutical formulations. BullPharmaceut Sci. 2006;29(1):33-58.
- Wagieh NE, Abbas SS, Abdelkawy M, et al. Spectrophotometric and spectrodensitometric determination of triamterene and xipamide in pure form and in pharmaceutical formulation. Drug TestAnal. 2010;2(3):113-21.
- Walash MI, El-Enany N, Eid MI, et al. Stability-indicating spectrofluorimetric methods for the determination of metolazone and xipamide in their tablets. Application to content uniformity testing. J Fluorescence.2014;24(2):363-76.
- Attia MS, Yuossef AO, Diab M, et al. J AdvChem. 2014;10:2720-27.
- Osteryoung JG. for the future. Acc Chem Res. 1993;26(3):77-83.
- Osteryoung JG, Osteryoung RA. Square wave . Anal Chem. 1985;57(1):101A-10A.
- Cabaniss GE, Diamantis AA, Murphy WR, et al. Electrocatalysis of proton-coupled electron-transfer reactions at glassy carbon electrodes. J Am Chem Soc.1985;107(7):1845-53.
- Farhadi K, Karimpour A. Electrochemical determination of meloxicam in pharmaceutical preparation and biological fluids using oxidized glassy carbon electrodes. Chem Pharm Bull. 2007;55(4):638-42.
- Li F, Song J, Gao D, et al. Simple and rapid voltammetric determination of morphine at electrochemically pretreated glassy carbon electrodes. Talanta. 2009;79(3):845-50.
- Campean A, Tertis M, Sandulescu R. Electrochemical behavior of some purine derivatives on carbon based electrodes. Cent Eur J Chem. 2011;9(3):466-73.
- Bard AJ. Electrochemical methods: Fundamentals and applications. 2nd ed. L.R.Faulkner: John Wiley and Sons: New York; 2001.
- Garrido EM, Lima JL, Matos CD, et al. Electrochemical oxidation of propanil and related N-substituted amides. Anal Chim Acta.2001;434(1):35-41.
- Rieger PH. Electrochemistry. 3rd ed. Prentice-Hall International: New Jersey; 1987.
- Zhang Y, Jin G, Wang Y, et al.Determination of dopamine in the presence of ascorbic acid using poly (Acridine red) modified glassy carbon electrode.Sensors. 2003;3(10):443-50.
- Yardim Y, Senturk Z. Voltammetric behavior of indole-3-acetic acid and kinetin at pencil-lead graphite electrode and their simultaneous determination in the presence of anionic surfactant. Tur J Chem. 2011;35:413-26.
- Gosser DK. Cyclic : Simulation and analysis of reaction mechanism. VCH: New York; 1993.
- Aristov N, Habekost A. Electrochromism of methylviologen (Paraquat). World J Chem Edu. 2015;3(4):115-19.
- Zoski CG.Handbookof Electrochemistry. 1st ed. Elsevier: Netherlands; 2007.
- Miller JN. Miller JC. Statistics and chemometrics for analytical chemistr., 4th ed. Prentice Hall: England; 2000.
- Ensafi AA, Hajian R. Determination of losartan and triamterene in pharmaceutical compounds and urine using cathodic adsorptive stripping . Anal Sci. 2008;24 1449-54.
- Barroso MB, Alonso RM, Jimenez RM. Simultaneous determination of the diuretics triamterene and furosemide in pharmaceutical formulations and urine by HPLC-EC. J Liq Chrom & Re. Technol. 1996;19(2):231-46.
