Original Article
, Volume: 13( 4)Dynamics of Land Use Change in Rural-Urban Fringe: A Case Study of Srinagar City
- *Correspondence:
- ZA Nengroo , Department of Geography, University of Kashmir, Srinagar-190006, India, Tel: +91 (194) 227 2096; E-mail: zahoor.scholar@kashmiruniversity.net
Received: July 08, 2017; Accepted: July 19, 2017; Published: July 26, 2017
Citation: Nengroo ZA, Shah AH, Bhat MS. Dynamics of Land Use Change in Rural-Urban Fringe: A Case Study of Srinagar City. Environ Sci Ind J. 2017;13(4):142
Abstract
The land use/land cover (LULC) pattern of a region is an outcome of natural and socio-economic factors and their utilization by man in time and space. Land is one of the most important natural resource and is becoming scarce due to immense anthropogenic pressure. Land use plays a vital role in the earth system: it links human decision making to the terrestrial environment and is both driver and target of global environmental change. However, decisions about how much land to use where and for what purpose and the related consequences are still poorly understood. This deficit is in contrast to the fundamental need for future LULC change analysis to answer pressing questions of future food security, biodiversity and climate mitigation and adaptation. The LULC analysis carried out for the study area reveals that the land transformation has primarily been on account of increasing demands of the main city. The city of Srinagar has not only experienced a simple areal sprawl over the period of last forty years but there have been alarming land transformations among various land use classes. Continuous shift of land from non-developed natural categories to the developed land use is usual affair of urban sprawl but Srinagar City is also characterized by severe land transformations which are in response to the demands of the main City. The rate of transformation has been slow during the first half of the twentieth century but alarming after 1950’s and has now become assumed threatening proportions.
Keywords
LULC; Food security; Land transformation; Urban sprawl; Biodiversity
Introduction
Land use change, as one of the main driving forces of global environmental change, is central to the sustainable development debate. The types of land use are distinguished as land cover conversion, i.e., the complete replacement of one cover type by another, and land cover modification, i.e., more subtle changes that affect the character of the land cover without changing its overall classification [1-3]. Land use change occurs at every spatio-temporal scale. However, the literatures on land use change show that land use changes are affecting many aspects of the Earth system [4,5]. The quality of water, soil and air resources, ecosystem processes and function and the climate system itself through greenhouse gas fluxes and surface albedo effects have all undergone important changes in the past century [6]. These changes are likely to be even greater in this century. Determining the effects of land use change on the Earth system depends on an understanding of past land use practices, current land use patterns, and projections of future land use, as affected by human institutions, population size and distribution, economic development, technology, and other factors. Therefore, land use received increasing attention in the life cycle assessment. Whilst, a few years ago, most land use change research has been focused mostly on why, i.e., why land use change takes place, including explanation, and driving forces of land use change, the focus is now mostly on what, i.e., what are effects of land use change. Although some of the most important consequences of land use and cover change can be identified, yet we know so little about these important topics and there is an even poorer understanding of the complex factors and processes which control land use change globally. Worldwide, the level of urbanization is rapidly increasing and metropolitan areas are growing fast, creating extensive land use changes and urban spatial expansion. In 2005, a total of 3.2 billion people were urban dwellers, accounting for 48.7% of the world population United Nations Population Division (UNPD 2005). Population growth is particularly rapid in the urban areas of developing countries. One very notable offshoot of rapid urbanization is consumption of agricultural land by urban built-up areas. Though the rates of urbanization are not accelerating in industrialized countries, where 75% of the population has been urbanized, the concentration of population in metropolitan areas is expected to continuously increase especially in developing countries of the world because of the fact that the villages and towns not considered urban today will grove over time and others that are merged with the cities as a result of urban sprawl. Equally important is the migration from rural to urban and urban to mega urban centers.
In 1950 only 17.8% population of developing world lived in cities, 44% at present and by the year 1930, this figure will reach almost 60% (UN Habitat, 2009). India no longer lives in her villages. During the last 50 yrs the population of India has grown two and a half times but urban India has grown nearly five times. Furthermore, metropolitan population outside central cities has grown faster than downtown areas in many regions, indicating a strong tendency of the outward expansion of urban areas. In fact, many cities are rapidly growing along their fringes, engulfing villages and farmlands and transforming them into industrial and commercial areas, or suburban developments. The fringe is a zone or frontier of discontinuity between city and country in which rural and urban land uses are intermixed. It lies between the continuous built-up area of a city and the urban shadow and ecologically it can be viewed as an area of invasion in which population density is increasing rapidly and land values are rising.
Materials and Methods
The Survey of India toposheets were geometrically registered through polyconic projection technique in compatible format for subsequent analysis. Further, the satellite image of the study area was registered and rectified with reference to already geo-referenced 1:50000 scale topographic maps of the same area. Further, the area of interest from the already geo-referenced SOI topographic maps was clipped out by the technique of Subset to facilitate a perfect mosaic in GIS.
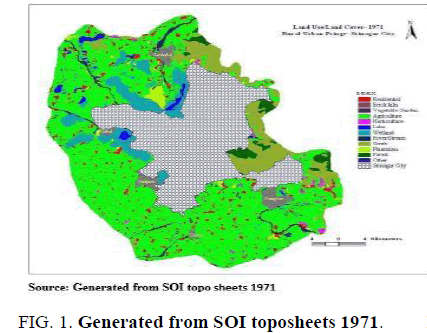
The land use/land cover maps of the study area were prepared for two different time periods viz., 1971 and 2009. The land use/land cover map for 1971 was generated from Survey of India toposheets at 1:20000 scales while as the land use/land cover map for 2009 was generated from CARTOSAT-I through the method of digitization in ArcView 3.2a GIS software. The generated land use/land cover maps of the two different time periods were validated after ground truthing. A portable
Global Positioning System (GPS) was used to collect the accurate locations of the reference points, which were used in the validation. More than 100 validation points were collected and the location and altitude were recorded using GPS. The necessary changes resulting from ground truthing were incorporated into the data layers. Finally, land use/land cover change detection analysis was done by comparing the same land use/land cover area of two given time periods.
Results and Discussions
Srinagar City is the urban largest center among all the Himalayan urban centers and is located in the heart of Kashmir valley. The rural-urban fringe of the city covers an area of 790.31 km2 with a population of 931282 persons in 2011 A.D. The rural-urban fringe (RUF) of the city covers a vast area of Jhelum valley floor characterized by gentle undulating topography, while the south-west and southern peripheries have presence of elevated lands known as karewas, which occupy large areas in the tehsils of Budgam, Chadura, Pampore and Pulwama. The area suitable for development in the north is limited to the north-west and the south while the eastern extension is limited to the present municipal limits, as the physical extension of the settlements in this direction is hindered by Zabarwan hills.
Land use change analysis 1971-2009
Land use/land cover change detection and ecosystems have been analysed by many researchers. Land use change takes place in two forms: conversion of one category of land cover to another and modification of condition within a same category [7]. Land cover change stemming from human uses represents a vital element of global environment change [8]. The most powerful contemporary forces that drive land use changes are increasing human activities and climatic change [9]. However, the same kind of change can have different reasons in different areas [7]. Land use/land cover change has become a focal component in recent strategies for managing natural resources and monitoring environmental changes. Land cover change and the subsequent potential loss of natural resources due to conversion of anthropogenic use is regarded as one of the more persistent environmental threats [10]. The change detection is the process of identifying in the state of an object or phenomenon by observing it at different times. The change detection analysis is an important process in monitoring and mapping natural resources because it provides quantitative analysis of the spatial distribution of the population of interest.
MacLead and Congatlon [11], list four aspects of change detection which are important when monitoring natural resources:
1. Detecting the changes that have occurred;
2. Identifying the nature of change;
3. Measuring the areal extent of change; and
4. Assessing the spatial pattern of change.
The City of Srinagar, a primate and characteristically diversified city, acts as a regional centre in the vast rural hinterland with a few comparatively small urban centers. The city has functioned and prospered throughout its long history as a regional focal centre due to its strategic and advantageous location. The city is not only the largest urban centre both in terms of population and areal extent, but also the rapidly growing city amongst all the Himalayan urban centers. The enormous growth in respect of various socio-economic and cultural attributes has resulted not only in land use conversions within the city limits but has engulfed vast expanse of agricultural land in the fringe area. The rural-urban fringe of Srinagar city has exhibited undesirable changes in its land use/land cover pattern during the last 38 yrs from 1971 to 2009. The ever-increasing population pressure coupled with limited land available in the city lead to the urban sprawl and resultant encroachment in green spaces of the fringe area Table 1.
| S. No | Land use | Area (km2) (1971) |
Percent (1971) |
Area (km2) 2009 | Percent (2009) |
Absolute change | Percentage change | Growth (1971-2009) |
|---|---|---|---|---|---|---|---|---|
| 1 | Agriculture | 554.23 | 70.13 | 386.69 | 48.93 | -167.54 | -21.2 | -30.22 |
| 2 | Horticulture | 6.39 | 0.81 | 85.3 | 10.79 | 79.91 | 9.98 | 1234.89 |
| 3 | Forest | 17.47 | 2.21 | 25.08 | 3.17 | 7.6 | 0.96 | 43 |
| 4 | Scrubland | 79.64 | 10.08 | 67.53 | 8.54 | -12.11 | -1.54 | -15.20 |
| 5 | Plantation | 16.31 | 2.06 | 87.13 | 11.02 | 70.82 | 8.96 | 434.12 |
| 6 | Streams | 13.77 | 1.74 | 13.13 | 1.66 | -0.64 | -0.08 | -4.04 |
| 7 | Vegetables | 0.34 | 0.04 | 10.13 | 1.28 | 9.79 | 1.24 | 2879.4 |
| 8 | Wetlands | 74.28 | 9.4 | 38.92 | 5.34 | -35.36 | 4.06 | -32.03 |
| 9 | Brick kilns | 1.5 | 0.19 | 7.6 | 0.96 | 6.1 | 0.77 | 406.6 |
| 10 | Built-up | 26.3 | 3.33 | 63.57 | 8.04 | 37.27 | 4.71 | 148.14 |
| Total | 790.31 | 100.00 | 790.3 | 100.00 | -- | 100 | -- |
Source: Generated from SOI toposheets 1971, resources at and cartos at-I 2009.
Table 1: Rural-urban fringe-land use change analysis 1971-2009.
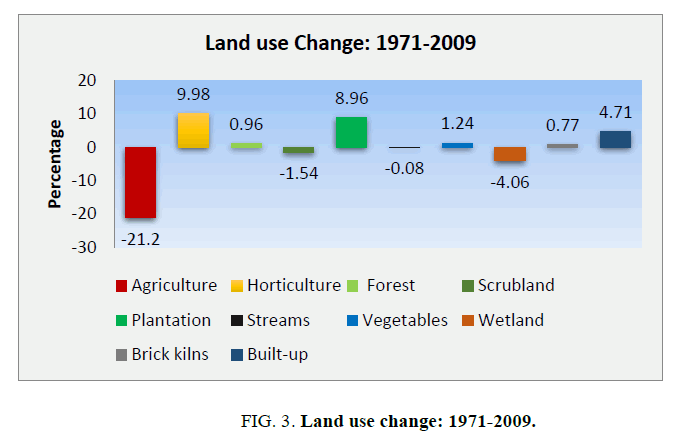
The change detection analysis carried out in present study reveals that the land transformation has primarily been on account of increasing demands of the main city. The Table 1 reveals that agriculture has registered a significant decrease from 70.13% (554.23 kms2) in 1971 to 48.93% (386.69 kms2) in 2009, therefore, showing an absolute change of 167.54 kms2 constituting 30.22% of change at an annual rate of 0.79%. The wetlands of the study area in 1971 were 74.28 kms2 comprising 9.4% and has reduced to 42.25 kms2 in 2009 constituting 4.92% of the total area, thus registering a net change of -32.03 kms2 comprising 43.12% of change at an annual rate of 1.34% (Figure. 1-3).
The forests covered an area of 17.47 kms2 (2.21%) in 1971 which has increased to 25.08 kms2 (3.17%) in 2009, thus registering a net increase of 7.61 kms2 amounting to 43% of change. The scrubland constituted 79.64 kms2 (10.08%) in 1971 and has reduced to 67.53 kms2 in 2009 (8.54%), thus showing an absolute change of -12.11 kms2. The horticulture has registered a substantial increase of 78.91 kms2 at an annual rate of 32.49%. The area under plantations in 1971 was 16.31 kms2 constituted 2.06% of the total area and has increased to 87.13 kms2 (11.02%) in 2009, thus registering an increment of 70.82 kms2 at an annual rate of 11.42%.
The area under vegetable gardens has registered significant increase of 9.79 kms2 in 2009 from mere 0.34 kms2 in 197 at an annual rate of 75.77%. The streams covered an area of 13.13 kms2 in 1971 (1.74%) and has reduced to 10.13 kms2 in 2009 (1.66%), thus registering a decrease of 0.64 kms2 and showing -4.04% of change. The analysis of built-up category reveals that it constituted 26.38 kms2 (3.34%) 1971 and has increased to 65.46 kms2 (8.28%) in 2009, thus registering an absolute change of 39.08 kms2 amounting to 148.14% of change. The brick kilns constituted 1.5 kms2 in 1971 (0.19%) has increased to 7.6 kms2 in 2009 (0.96%), thus, showing an absolute change of 6.1 kms2 at an annual rate of 13.55%.
Land use categories
The various land use categories which have been thoroughly analyzed are briefly explained as follows:
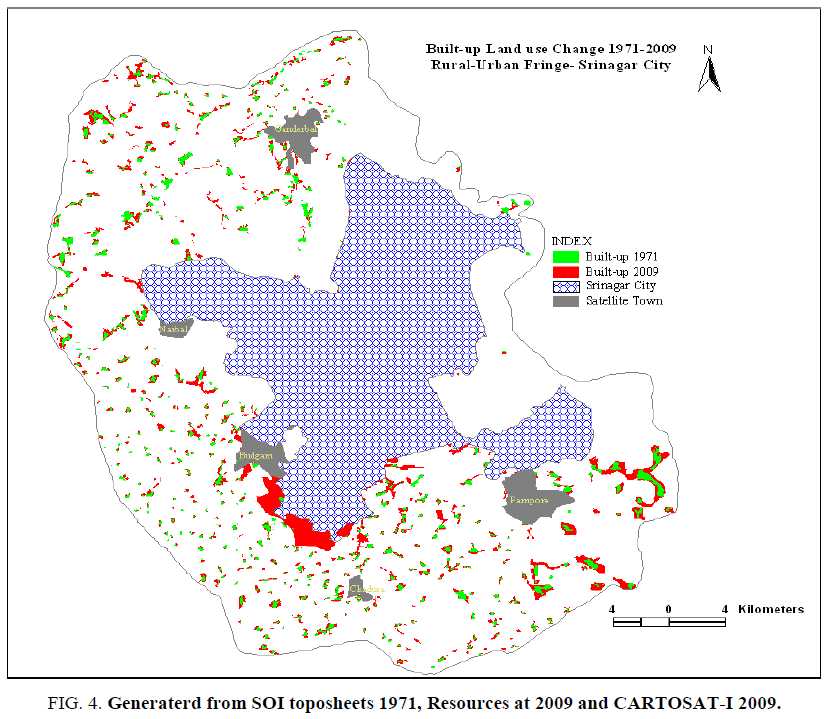
Built-up land use: The expansion of the city strongly influences the villages in terms of land use and population, both physically and in a socio-economic sense. Its influence stretches far beyond the immediately adjacent area as it enjoys the position of primacy within the region. Srinagar being the state capital and the most dynamic among all the urban centers of the region constitutes 66.30% of total urban population of Kashmir region and 38.77% of the total urban population of Jammu and Kashmir State (census of India, 2001). The city has shown unique trends in its population growth, as during the decades of 1971-1981 and 1981-2001, the population has exploded more than double and the incremental rate of population has been about 0.18 lakh persons per year, the highest growth rate which is recorded for any urban centre of the state. This huge population growth has eventually resulted in unprecedented land use change in built-up category in and around the city fringe zone, which has increased from 3.33% (26.38 kms22) in 1971 to 8.04% (65.46 kms2) in 2009 (Figure. 3 and 4), thus registering a showing an absolute change of 39.08 kms2 at an annual rate of 3.89%.
This expansion has mainly been in terms of residential land use, as during the period under study huge number of residential colonies and commercial apartments have come up in the periphery and the city. These developments have mainly been at the cost of productive agricultural land and precious wetlands of the rural-urban fringe of the city.
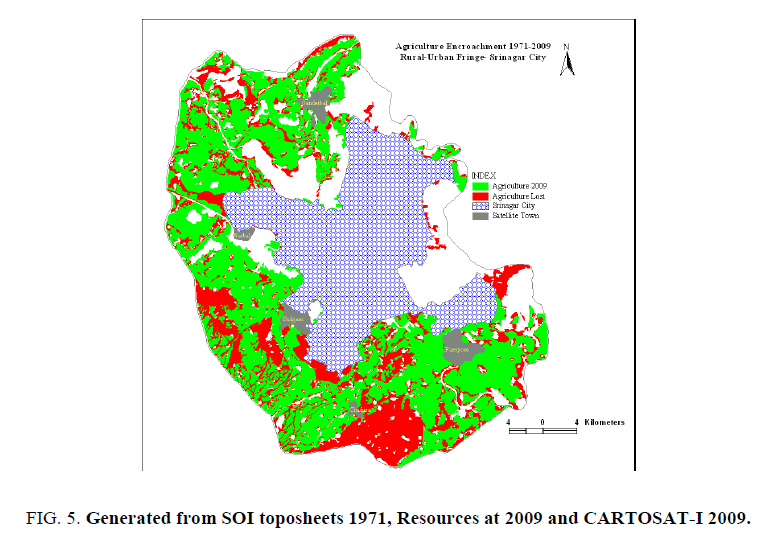
Agricultural land use: Although, cities serve as ‘engines’ of growth in most developing countries by providing opportunities for employment, education, knowledge and technology transfer and ready markets for industrial and agricultural products, high urban populations place enormous stress on natural resources and imposes ‘ecological footprints’ on the peri-urban areas. For example, urbanization leads to the outward expansion of cities and results in changes in land use whereby urban residents buy up prime agricultural land for residential or commercial purposes. The conversion of farm lands for residential purposes have negative consequences on food security, water supply as well as the health of the people, both in the cities and in the peri-urban areas. In the city of Srinagar and its environs, there has been a continuous transformation of land from agriculture to built-up and other uses which are primarily in response to the demands of the main city. Agriculture was the largest land use category in the year 1971, covering an area of 70.13% which has been reduced to 48.93% in 2009 at an annual rate of -0.79 (-5.58 kms2) percent. The maximum conversion has taken place along major transportation corridors around the city, therefore, giving rise to ribbon settlements.
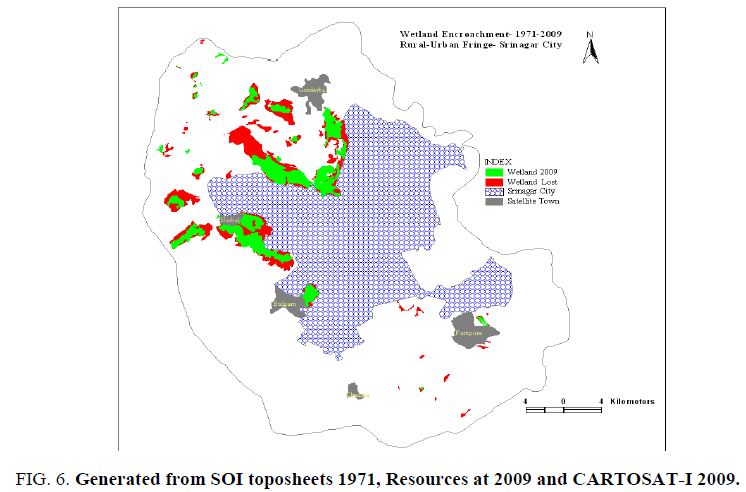
Wetland land and lakes: About 50% of the world’s wetlands have been lost in the last century. Srinagar city being famous throughout the world for its water bodies such as Dal, Hokar Sar, Negin, Anchar, Shalbug etc. is no exception to this phenomenon of wetland extinction and degradation. The wetlands covered an area of 9.4% in 1971(74.28 kms2) and have reduced to 4.92% (42.25 kms2) in 2009 at an annual loss of -0.84% (Figure 6). The Figure 6 reveals that the wetlands of the city and the fringe have suffered unprecedented loss during last few decades mainly as a result of unplanned and haphazard urban sprawl. The loss in terms of areal expansion has not only resulted in a threat to the wet land ecology but also reduced their capacity as flood absorption basin. Large areas of these wetlands have been lost due to different developmental activities, siltation, and encroachments. Further, the remaining area under wetlands has been fragmented and many interconnecting streams have been destroyed.
Scrubland land use: The perusal of Figure. 3 shows that the scrubland has decreased substantially from 10.08% in 1971 to 8.54% in 2009 registering a change of 15.20%. The scrubland or wastelands are most sensitive to any type of encroachment particularly to agriculture. The change has mainly been due the encroachment of horticulture in Zabarwan hills and partially due to various forestry schemes adopted to ensure protection of green spaces in the Srinagar city.
Forest land use: Forests have increased from 2.21% (17.47 kms2) in 1971 to 3.17% (25.08 kms2) in 2009, thus, showing an increment of 7.61 kms2 during the period of 38 yrs (Figure. 3). The substantial increase in this category is understood from the fact that the use of this type is confined to the Zabarwan hills of the city, where famous Dachigam wildlife sanctuary is located. Furthermore, the scrubland of the Zabarwan hills had been planted under various social and voluntary forestry schemes.
Brick kiln land use: Cities demands a high input of resources such as food grains, vegetables, milk, fuel wood, timber, water, soil, bricks and other material required for various developmental and constructional activities. The more populous the city the greater is the demand on resources and in general the larger the area from which it is drawn. The expanding urban area of Srinagar city with fast increase in population implies an increasing demand for residential, commercial, industrial, and public buildings and other physical infrastructure. Thus, the physical structure of the city requires large amount of construction material and the bulk of material is derived from locally available clay, soil, sand, and gravel. This can be seen from the brick kilns found in the rural-urban fringe as bricks are predominantly used for infrastructure development.
The area under brick kilns in 1971 was 1.5 kms2 (0.19%) and has increased to 7.6 kms2 (0.96%) in 2009, thus registering a change of 406.6% at an annual rate of 10.68% (Figure. 3).
Vegetable land use: The area under vegetable gardens in 1971 was 0.04% (0.34 kms2) and has increased to 1.28% (10.13 kms2) in 2009, thus registering a substantial increase of 9.79 kms2 at an annual rate of 75% (Figure. 3). The vegetable gardens have mainly encroached in wetlands and agricultural land. This enormous scale of change is attributed to the unprecedented growth of Srinagar city both in areal expansion and population size. Owing to the population pressure there is heavy demand for vegetables which not only the fringe area but also the city region is unable able to provide with, therefore, huge imports of vegetables from other states are made.
Plantation land use: The area under plantations covered an area of about 2.06% (16.31 kms2) in 1971 and has increased to 11.02% (87.13 kms2) in 2009, thus registering an absolute change of 70.82 kms2 at an annual rate of 11.42% (Figure. 3). This tremendous amount of increase in this land use category is peculiar to the Srinagar City as it is situated along Jhelum valley floor in lowlands of Kashmir valley, characterized by abundance of wetlands and flood prone agricultural land mainly along left bank of river Jhelum. The shrinkage of the wetlands of the fringe area of the city has mainly been at the cost of willow plantations. Similarly, the flood prone areas of Jhelum floor have been planted heavily in recent years so as to reduce the chances of economic losses on account of paddy and mustard cultivation.
Horticulture land use: The horticulture constituted 0.81% (6.39 kms2) in 1971 and has increased to 10.79% (85.3 kms2) in 2009 (Figure. 3), thus, registering an absolute change of 78.91 kms2 at an annual rate of 32% (2.07 kms2).
It is seen that the newly converted horticulture land is simultaneously used for vegetables as horticulture needs few years to yield crops. The expansion of horticulture in the fringe area is attributed to the economy of the people as it is mainly from agriculture. Within primary sector of economy, horticulture assumes the priority as its returns are more than that of agriculture.
Streams: The area under streams in 1971 was 1.74% (13.77 kms2) and has reduced to 1.66% (13.13 kms2), in 2009 therefore, showing a decline of 0.64 kms2 registering a -4.04% of change. Previously there existed a well-knit network of streams serving the agriculture and other domestic purposes. Not only this, the water of river Jhelum was directly used for drinking purposes. Over the period of forty years unprecedented and unplanned growth of the urban centre, use of chemicals and pesticides and agriculture and horticulture, disposal of urban waste directly into various water bodies has resulted in pollution and encroachment of this category of land use beyond the levels of repairment. Presently there exists a broken network of streams. Small and medium sized streams have been either lost or converted into sewage drains.
Conclusions
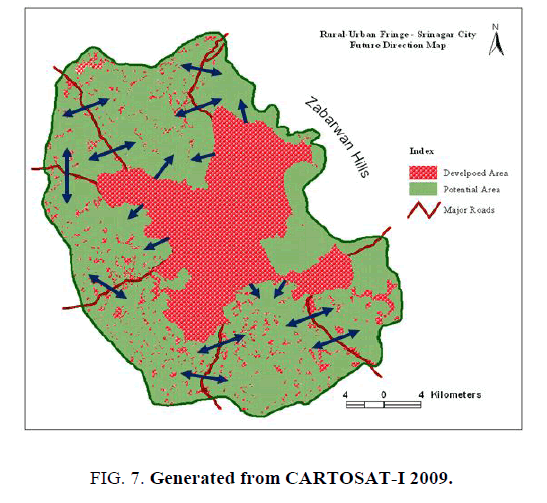
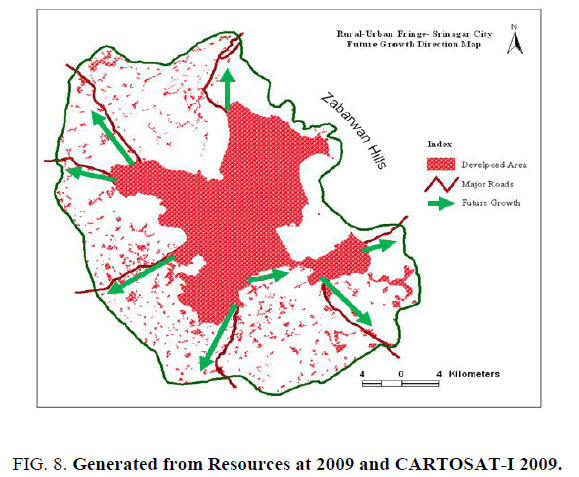
A spatial analysis of the present land use structure of the rural-urban fringe, keeping in view the geo-ecological and socio-economic framework of the region has been carried out to model the future directions of growth and the potential land use categories threatened by the urban sprawl of the city in near future (Figure. 7 and 8).
One of the main concerns of sustainable land use planning is the proper designation of suitable sites for appropriate land uses. Certain characteristics like steep slopes, religious values and government reserved land may also lead to non-suitability of a site for a specific type of land use.
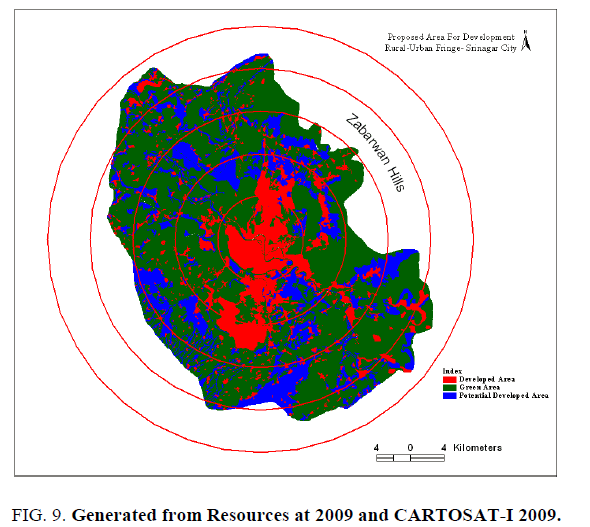
Further expansion of the city would largely be governed by the geo-ecological framework of the region, as the city is dotted with many geographical features such as Zabarwan Hills, Kohi Maran, Kerawas of Domodar and Pampore and wetlands of Dal, Nigeen, Hokarsar, Anchar and Shalbug which are highly unsuitable for physical planning as they possess tremendous economic and ecological significance. After analyzing the land use of the rural-urban fringe and the suitability of a site for urban land use, a proposed area for development is given (Figure. 9). The regional framework of the city being predominantly a mountainous and ecologically fragile one, will definitely continue to play an important role in city expansion.
References
- Ojima DS, Galvin K, Turner II BL. The global impact of land use change. Biosci. 1994;44(5):300-4.
- Geist HJ, Lambin EF. Proximate causes and underlying forces of tropical deforestation. Biosci. 2002;52(2):143-150.
- Li X, Yeh AG. Calibration of cellular automata by using neutral networks for the simulation of complex urban systems. Environ Plan A. 2001;33(8):33.
- Lopez E, Bocco G, Mendoza M, et al. Predicting and cover and land use change in the urban fringe: A case in Morelia city, Mexico. Landsc Urban Plan. 2001;55(4):271-85.
- Chen X, Zhang X, Li B. Influence of Tibetan Plateau on vegetation distributions in East Asia: A modeling perspective. Ecol Modell. 2005;181(1):79-86.
- Baudry J, Laurent C, Thenail C, et al. Driving factors of land use diversity and landscape pattern at multiple scales ? A case study in Normandy, France. In: Kronert R, editor. Land use change and their environmental impact on rural area in Europe. Paris: The Parthenon publishing group, France; 1999;p:103-19.
- Turner II BL, Myer WB. Land use and land cover in global environmental change: Considerations for study. Int Soc Sci. 130: 669-712.
- Turner II BL, Meyer WB, Skok LD. Global land use/land cover change: Towards an integrated study. Ambio. 1994;23(1):91-5.
- Liu X, Xu H, Cao W. An analysis on spatial difference or land use change in Qiangno County of Jilin Province. Prog Geogr. 2001;20(1):60-6.
- Wickham JD. A geography of ecosystem vulnerability. Landsc Ecol. 2000;15(6):495-504.
- Maclead, Congatlon. A quantitative comparison of change detection, algorithms for monitoring eelgrass for remotely sensed data. Photogramm Eng Remote Sensing. 1998;64(3):207-16.
