Original Article
, Volume: 16( 1)Determination of Zinc (II) Ion Using Dithizone by Flow Injection and Sequential Injection Techniques
- *Correspondence:
- Jabbar Ali K Chemistry Department, Education for Girls Faculty, Kufa University, Kufa, Iraq, Tel: +9647805974579; E-mail: Khdijajabar@gmail.com
Received Date: December 19, 2017 Accepted Date: January 03, 2018 Published Date: January 05, 2018
Citation: Ali KJ, Kadoomm MR. Determination of Zinc (Ii) Ion Using Dithizone by Flow Injection and Sequential Injection Techniques. In J Chem Sci. 2018;16(1):236
Abstract
This determinates Zinc (II) ion in variably samples by using methods flow injection and sequential injection systems which laboratory. The FIA and SIA systems depend on the base reaction of Zinc (II) ion with dithizone complex in aqueous phase in the presence of SDS anionic (sodium dodecyl sulphate) at pH=5 with absorption maximum at 565 nm. The factors (physical and chemical) effecting on the determination such as flow rats, reaction coil length, the volume of reagent (dithizone), the volume of sample, interference, the concentration of dithizone also. Attended the calibration curve and studied dispersion coefficient, reproducibility, application. Compared results methods FIA and SIA consecutively for determination of Zinc (II) by dithizone, the linear range was (2-10 mg/l), (1-15 mg/l), at sampling rate 70, 64 sample per hour, the detection limits (1.6746 mg/l), (0.1934 mg/l) for FIA and SIA respectively. Relative standard deviation for (10 mg/l), n=10 were found (0.8491 mg/l) for FIA and for SIA (0.5089 mg/l). Dispersion coefficient also has been studied in these methods.
Keywords
Flow injection; Sequential injection; Dithizone; Zinc (II) ion
Introduction
Zinc (II) ion is a metal of great nutritional importance and is the second element after iron in terms of abundance in the human body. The importance of the ore has been known since 1960, as the micronutrient is required for the effectiveness of more than 300 enzymes and 1000 of the necessary transcription factors also show its importance in controlling the expression The gene, which plays an important role in the work of amino acids and the manufacture of proteins and replication of cells as well as the growth and repair of the tissue is considered Zinc (II) ion as antioxidants and stability of the membranes indicate that it has the ability to resolve the free radical caused by injury during infections [1-5], the main of Zinc (II) ion deficiency in most cases may result from heavy dependence on foods with little Zinc (II) ion or low absorption. High fat and acid content in the bowel that prevents absorption of Zinc (II) ion [6,7]. Deficiency occurs in various conditions like malformation syndrome, cirrhosis of liver. The best food sources of Zinc (II) ion include meat-based products, especially the most abundant meat, such as chicken, beef, rabbit meat, scallops, lamb found in cytosol, vesicles, organelles and in the nucleus [8]. Zinc (II) ion has relatively low melting point (419.5°C) and boiling point (907°C) [9-11]. The first determination of Zinc (II) ion-dithizone complex, in aqueous phase is, in the presence of SDS anionic (sodium dodecyl sulphate).
Dithizone was green- bluish powder is dissolved in ethanol, methanol, chloroform and carbon tetrachloride. Dithizone or diphenyl thaio carbazone, which symbolizes D, which was discovered by Amel Fisher and was found in the form of saline clusters known as dithizones, which are the same colors in solutions. Ten years ago, Fischer began using dithizone as an analytical detector and has been used in the detection of many minerals, which is known to be able to link with ions and other elements of the physical properties be a crystalline blackish blue color of blue C6H5N=NCSNHNHC6H5e, which is a sulfur- containing compound and is a good ligand, dithizone is a widely used compound in volume measurement methods.
Irrigation is insoluble in alkaline solvent and water if the container was impurities due to be salt, but if it was pure good solubility in organic solvents only, such as chloroform, carbon tetrachloride. Dithizone has many applications in the process of extracting elements such as silver, copper, and lead and was used with Zinc (II) ion using carbon tetrachloride at pH (5.5) [12,13]. Its medical benefits are its ability to attack toxic cells in the prostate, the possibility of contact with chemotherapy and its attack on prostate cancer [14]. Zinc (II) ion estimated by a number of ways, including using the method of Flame Atomic Absorption Spectrophotometry [15], Sequential Injection System [16], Chromatography Coupled with Plasma Optical Emission Spectrometry (ICP-OES) [17], Capillary Electrophoresis with Contactless Conductivity Detection [18] and Adsorptive Stripping Voltammetry at A Mercury Film Electrode [19] etc.
Experimental
Apparatus
Spectrophotometer laboring single beam, spectrophotometer Shimadzu UV-1700, USA, pipes load of Teflon, flow cell volume of 450 μ pH meter, peristaltic pump Germany, analytical balance sensitive Denver instrument, Recorder Pen Siemens C1032 Hitter Ardeas 51 homemade valve, Ismatic.
Chemicals
• The standard stock 1000 mg/l of Zinc (II) ion prepared by dissolving 0.2086 g of Zinc chloride ZnCl? in water and dilute the solution with distilled water to 100 ml.
• 1 × 10⁻⁴ mol/l of dithizone solution was prepared by dissolving 0.00265 g of dithizone in 100 ml of ethanol in the volumetric flask.
• The buffer solution of prepared PH=5 dissolve 0.4 g of Sodom acetate in water, and dissolve 0.3 g from acetic acid in water, and dilute the solution with water to 50 ml.
• SDS solution 0.01% prepared by dissolved 0.01 g of SDS in 100 ml water.
• Trtionx-100 solution 0.01% prepared by dissolved 0.01 g of Trtionx-100 in 100 ml water.
Results and Discussion
Determination of the wavelength for maximum absorption
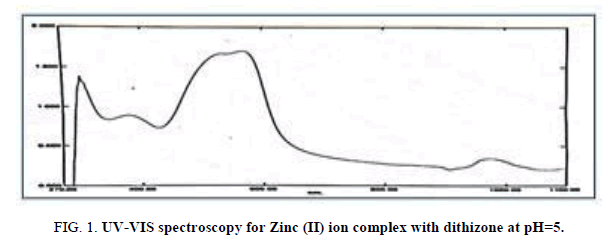
Defining of the wavelength for maximum absorption by use Ultraviolet-visible spectroscopy was used to determine the optimum condition for the Zinc (II) ion complex and the result are shown in Figure 1. The λ max of complex was 565 nm.
Figure 1: UV-VIS spectroscopy for Zinc (II) ion complex with dithizone at pH=5.
Design of FIA and SIA units
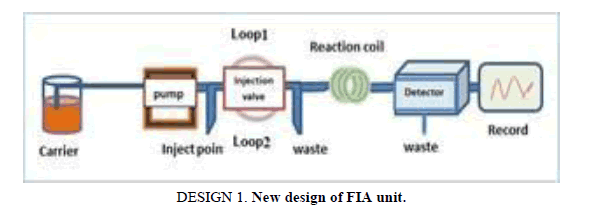
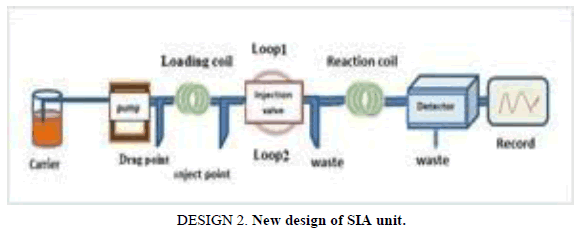
The difference parameters affecting the unit have been achieving a final method evaluation. The following results allow the operator choose difference operation condition. Used new designs as shown in the Designs 1 and 2.
Study effecting type medium micelle
Using two types from the medium the micelle them Triton X-100 and SDS anionic (sodium dodecyl sulphate) with concentration 0.01 mol/l, (Table 1), demonstrate using medium from SDS give the best null in form and height.
| Type of medium | Peak height cm | Mean | SD | RSD% | ||
|---|---|---|---|---|---|---|
| With out | 3.0130 | 3.0900 | 3.0111 | 3.0380 | 0.04123 | 1.3571 |
| With SDS | 3. 380 0 | 3. 510 0 | 3. 50 00 | 3.4633 | 0.0717 | 2.0702 |
| With TritonX-100 | 2.9990 | 2.9100 | 2.9730 | 2.9606 | 0.0458 | 1.5469 |
Table 1. Effect of type medium micelle on peak height at Zinc (II) ion conc.=10 mg/l, Reaction coil length=50 cm, Dithizon conc.=5 × 10⁻⁵ mol/l, Sample volume=157.0 μl, Reagent volume=141.3 μl, SDS, TritonX-100=0.01% in FIA unit.
Study effecting concentration of SDS anionic (sodium dodecyl sulphate)
After determinable environment from SDS chose concentrations in the range of (0.05-0.002) mol/l, (Table 2 and Figure 2), the concentration 0.01% giving the best results.
| Conc. SDS mol/l | Peak height cm | Mean | SDS | RSD% | ||
|---|---|---|---|---|---|---|
| 0.002 | 3.0070 | 3.0070 | 3.0070 | 3.0070 | 0.0000 | 0.0000 |
| 0.01 | 3.3800 | 3.5100 | 3.5000 | 3.4633 | 0.0717 | 2.0702 |
| 0.05 | 3.3850 | 3.3120 | 3.3590 | 3.3520 | 0.03605 | 1.0754 |
Table 2. Effect of concentration of SDS on peak height at Zinc (II) ion conc.=10 mg/l, Reaction coil length=50 cm, Dithizon conc.=1 × 10⁻⁵ mol/l, Sample volume=157.0 μl, Reagent volume=141.3 μL, SDS=0.01%, flow rate=9.000 ml/min in FIA unit.
Effect of the flow rate
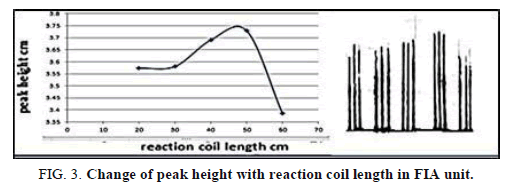
The effect of the flow rat on the peak height was the lesson in the range of 1-13 ml/min (Tables 3 and 4 and Figures 2 and 3) show that, the flow rate was 11.20 ml/min, as optimizing rate after that the height of peak was reduced due to declining the sensitivity of measurement in height flow rate because the reaction was no attaining when increased the flow rate [20].
| Flow rate ml/min | Peak height (cm) | Mean | SD | RSD% | ||
|---|---|---|---|---|---|---|
| 1.00 | 2.6470 | 2.6000 | 2.6583 | 2.6351 | 0.0300 | 1.1384 |
| 2.00 | 2.7200 | 2.7200 | 2.7600 | 2.7333 | 0.0300 | 1.0975 |
| 5.600 | 2.8710 | 2.900 | 2.8110 | 2.8606 | 0.0447 | 1.5626 |
| 7.500 | 3.103 | 3.1176 | 3.1870 | 3.1358 | 0.0441 | 1.4063 |
| 9.00 | 3.5000 | 3.5100 | 3.3800 | 3.4633 | 0.0717 | 2.0702 |
| 11.20 | 3.7290 | 3.7020 | 3.7900 | 3.7403 | 0.1516 | 4.0531 |
| 13.00 | 3.5500 | 3.4700 | 3.3100 | 3.4266 | 0.1234 | 3.6012 |
Table 3. Effect of the flow rate on peak height at Zinc (II) ion conc.=10 mg/l, Reaction coil length=50 cm, Dithizon conc.=5 × 10⁻⁵ mol/l, Sample volume=157.0 μl, Reagent volume=141.3 μL, SDS=0.01% in FIA unit.
| Reaction coil length (cm) | Peak height (cm) | Mean | SD | RSD% | ||
|---|---|---|---|---|---|---|
| 20 | 3.4900 | 3.6400 | 3.5900 | 3.5733 | 0.0758 | 2.1212 |
| 30 | 3.5608 | 3.5900 | 3.5900 | 3.58026 | 0 .0122 | 0.3407 |
| 40 | 3.6600 | 3.7500 | 3.6600 | 3.6900 | 0.0324 | 0.8780 |
| 50 | 3.7290 | 3.7020 | 3.7900 | 3.7403 | 0.1516 | 4.0531 |
| 60 | 3.4560 | 3.3990 | 3.3000 | 3.3850 | 0.0781 | 2.3072 |
Table 4. Effect of the reaction coil length on peak height at Zinc (II) ion conc.=10 mg/l, Dithizon conc.=5 × 10⁻⁵ mol/l, Sample volume=157.0 μl, Reagent volume=141.3 μl, SDS=0.01% in FIA unit.
Effect of the sample volume in FIA
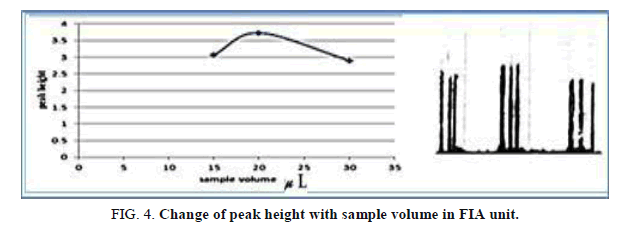
The influence of the different volume 117.75-235.5 μl of samples was observed sample volume that exhausted the greatest peak height was found to be 157.0 μl and it was chosen as the optimum (Table 5, Figure 4).
| V of Zinc (II) ion μl | Peak height cm | Mean | SD | RSD% | ||
|---|---|---|---|---|---|---|
| 1 17.75 | 2.8740 | 3.0780 | 3.2490 | 3.0670 | 0.1327 | 4.3267 |
| 157.0 | 3.7020 | 3.7900 | 3.7290 | 3.7290 | 0.1516 | 4.0531 |
| 235.5 | 2.9080 | 2.8440 | 2.9440 | 2.8986 | 0.0353 | 1.2178 |
Table 5. Effect of the Sample volume on peak height at Zinc (II) conc.=10 mg/l. Reaction coil length=50 cm, Dithizon conc.=5 × 10⁻⁵mol/l, Reagent volume=157.0 μl, SDS=0.01%, Flow rate=11.20 ml/min, in FIA unit.
Effect of the reagent volume in FIA
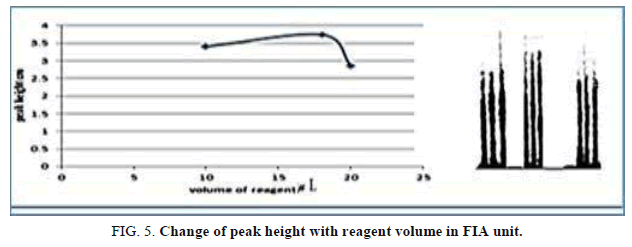
The influence of the different volume 78.50-157.0 μl, reagent volume that exhausted the greatest peak height was found to be 141.3 μL and it was chosen as the optimum (Table 6, Figure 5).
| V of dithizone μl | Peak height cm | Mean | SD | RSD% | ||
|---|---|---|---|---|---|---|
| 78.50 | 3.4350 | 3.3480 | 3.3350 | 3.3726 | 0.0538 | 1.5936 |
| 1 41.3 | 3.7290 | 3.7020 | 3.7900 | 3.7403 | 0.1516 | 4.0531 |
| 157.0 | 2.8070 | 2.9080 | 2.9350 | 2.8833 | 0.0670 | 2.3237 |
Table 6. Effect of the reagent volume on peak height at Zinc (II) ion conc.=10 mg/l, Reaction coil length)=50 cm, Dithizon conc.=5 × 10⁻⁵ mol/l, Sample volume=157.0 μl, SDS=0.01%, Flow rate=11.20 ml/min in FIA unit.
Effect of the reagent concentration
The concentration of the reagent was various in the range (0.5 × 10-5 × 10-6 × 10⁻⁵) mol/l in FIA in order to maximize the peak height. (Table 7 and Figure 6) have shown the effect of reagent concentration on the peak height of Zinc (II) ion. The maximum peak height was obtained with the reagent, the peak height lowered and form double peak, therefore, the 5 × 10⁻⁵ mol/l reagents was chosen for further work.
| Conc. dithizone mol /l | Peak height Cm | Mean | SD | RSD% | ||
|---|---|---|---|---|---|---|
| 0.5 × 10⁻⁵ | 3.0970 | 3.0280 | 3.1200 | 3.0816 | 0.0469 | 1.5219 |
| 1 × 10⁻⁵ | 3.1250 | 3.1340 | 3.2380 | 3.1623 | 0.0624 | 1.9732 |
| 2 × 10⁻⁵ | 3.4410 | 3.4600 | 3.4600 | 3.4536 | 0.0070 | 0.2026 |
| 5 × 10⁻⁵ | 3.7290 | 3.7020 | 3.7900 | 3.7290 | 0.1516 | 4.0531 |
| 6 × 10⁻⁵ | 3.1610 | 3.1550 | 3.1300 | 3.1486 | 0.0141 | 0.4478 |
Table 7. Effect of reagent concentration on peak height at Zinc (II) ion conc.=10 mg/l, Reaction coil length)=50 cm, Dithizon conc.=5 × 10⁻⁵ mol/l, Sample volume=157.0 μl, Reagent volume=141.3 μl, SDS=0.01%, Flow rate=11.20 ml/min, in FIA unit.
Calibration curve in FIA
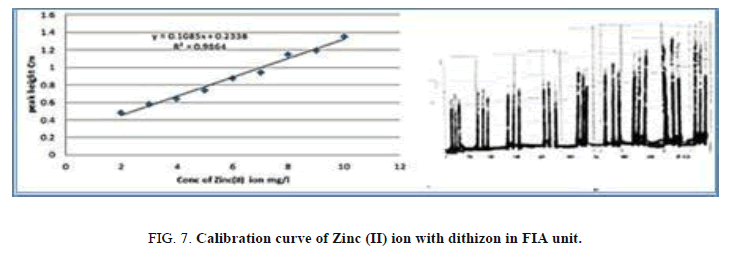
Attended chain from concentration ion between (0.01-50) mg/l at the optimum condition of complex ion and change in the ion concentration (Table 8, Figure 7) that show curve is linear in the range of 2-10 mg/l.
| Conc. of Zinc (II) ion mg /l | Peak height cm | Mean | Value after removed peak reagent | SD | RSD% | ||
|---|---|---|---|---|---|---|---|
| 2 | 2.8570 | 2.8840 | 2.88366 | 2.8748 | 0.4856 | 0.0122 | 0.4243 |
| 3 | 3.1150 | 2.9000 | 2.9000 | 2.9716 | 0.5824 | 0.1238 | 4.1661 |
| 4 | 3.0230 | 3.0270 | 3.0303 | 3.0303 | 0.6411 | 0.0000 | 0.0000 |
| 5 | 3.1750 | 2.9620 | 3.2560 | 3.1310 | 0.7418 | 0.1516 | 4.0531 |
| 6 | 3.2700 | 3.2620 | 3.2593 | 3.2637 | 0.8745 | 0.0000 | 0.0000 |
| 7 | 3.3750 | 3.3 110 | 3.3220 | 3.336 0 | 0.9468 | 0.0331 | 0.9922 |
| 8 | 3.3620 | 3.5960 | 3.6800 | 3.5400 | 1.1508 | 0.1647 | 4.6525 |
| 9 | 3.67300 | 3.5400 | 3.5580 | 3.5 8 00 | 1.1908 | 0.0728 | 2.0335 |
| 10 | 3.7290 | 3. 7 020 | 3.7900 | 3. 7403 | 1.3511 | 0.0441 | 1.1790 |
Table 8. Effect of the Zinc (II) ion concentration on peak height at Zinc (II) ion conc.=10 mg/l, Reaction coil length=50 cm, Dithizon conc.=5 × 10⁻⁵ mol/l, Sample volume=157.0 μl, Reagent volume=141.3 μl, SDS=0.01%, Flow rate=11.20 ml/min, in FIA unit, peak height of reagent=2.3892 cm in FIA unit.
Repeatability
Repeatability was edifying through injection the same concentration of Zinc (II) ion complex. The concentration ion was 5 mg/L and 5 × 10⁻⁵ mol/l of dithizone (Table 9, Figure 8) show the repeatability of Zinc (II) ion. The efficacy of the proposed FIA unit for the determination of Zinc (II) ion was reversed from the result of repeatability.
| No of peak height | 1 | 2 | 3 | 4 | 5 | 6 | 7 | 8 | 9 | 10 | Mean | SD | RSD% |
|---|---|---|---|---|---|---|---|---|---|---|---|---|---|
| Peak height cm | 3.729 | 3.702 | 3.729 | 3.790 | 3.702 | 3.729 | 3.790 | 3.702 | 3.729 | 3.72 9 | 3.733 | 0.0317 | 0.8491 |
Table 9. Repeatability for 10 mg/l of Zinc (II) ion in FIA at, Reaction coil length=50 cm, Dithizon conc.=5 × 10⁻⁵ mol/l, Sample volume=157.0 μl, Reagent volume=141.3 μl, SDS=0.01%, Flow rate=11.20 ml/min. in FIA unit.
Calculation the modeling rate in the flow injection system
An experiment was carried out to calculate the number of analyzed sample in the hour after the best conditions were determined by calculating the time from injection to the maximum absorption value of the relevant concentration if it was found that the time required for the emergence of this absorption is 51 s and thus the modeling rate is 70 sample per hour.
Study of the interference of some ions in the flow injection system
In order to study the effect of the interferences, a number of negative and positive ions were taken to determine their effect on the process of estimating the dissolved in an alcoholic medium from micelle. The negative and positive ions studied were (Cl-, CH3COO-, SO4 , CO2-, F-, Cd , Ca , Mn , Cu , Fe ) and ions (Tables 10 and 11). The experiment was carried out at concentrations of (5, 50) mg/L of the ion intermingled with 5 mg/l from ion Zinc (II) ion dissolve in alcoholic medium from an alcoholic medium of the micelle and concentration Reagent 5 × 10⁻⁵ mol/l. The results showed that the ions under study did not interfere with the Zinc (II) ion complex at the mentioned concentration.
| Change in the peak height m | Concentration of ion interference mg/l | Ion interference | Zinc (II) ion Concentration mg/l |
|---|---|---|---|
| 0.7654 | 5 | Cl- | 5 |
| 0.87643 | 50 | ||
| 0.6672 | 5 | SO42- | 5 |
| 0.0981 | 50 | ||
| 0.6063 | 5 | CH3COO- | 5 |
| 0.8664 | 50 | ||
| 0.2273 | 5 | CO32- | 5 |
| 0.3209 | 50 | ||
| 0.1991 | 5 | F- | 5 |
| 0.9901 | 50 |
Table 10. Effect interferences negative on determination Zinc (II) ion.
| Change in the peak height cm | Concentration of ion interference mg/l | Ion interference | Zinc (II) ion concentration mg/l |
|---|---|---|---|
| 0.8240 | 5 | Cd2+ | 5 |
| 0.8001 | 50 | ||
| 0.6681 | 5 | Ca2+ | 5 |
| 0.9987 | 50 | ||
| 0.0453 | 5 | Mn2+ | 5 |
| 0.9971 | 50 | ||
| 0.5375 | 5 | Cu2+ | 5 |
| 0.01297 | 50 | ||
| 0.7129 | 5 | Fe2+ | 5 |
| 0.0072 | 50 | ||
| 0.2550 | 5 | Ni2+ | 5 |
| 0.8710 | 50 |
Table 11. Effect interferences positive on determination Zinc (II) ion.
Determination of dispersion
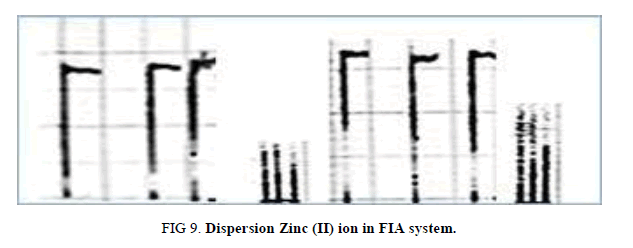
To measure the dispersion value in different sample zones of (10 and 5) mg/l Zinc (II) ion for FIA, two experiments were borne out. In the first experiment, after mixing of reactants (dithizone and Zinc (II) ion that passes through manifold unit gives continuous responsive and indicates non-existent of dispersion impact by convection or diffusion.
This measurement represents (H°). The experiment second includes injection different concentration of Zinc (II) ion (10 and 5) for FIA and signals recorded as Hmax. The value dispersion (D) from this experiment can be calculated from this equation. D=H°/Hmax. These values in limit state of dispersion (Table 12, Figure 9).
| Flow rate ml/min | Peak height cm | Mean | SD | RSD% | ||
|---|---|---|---|---|---|---|
| 9.00 | 2.5160 | 2.5740 | 2.6680 | 2.5860 | 0.064 | 2.9576 |
| 11.20 | 2.9010 | 2.9450 | 2.9260 | 2.9240 | 0.0212 | 0.7254 |
| 13.00 | 4.1000 | 4.1700 | 4.0010 | 4.0903 | 0.0842 | 2.0600 |
| 18.00 | 2.6030 | 2.7000 | 2.6140 | 2.6390 | 0.0524 | 1.9856 |
Table 12. Effect of loading coil length on peak height at Zinc (II) ion conc.=5 mg/l, Reaction coil length)=15 cm, Dithizon conc.=5 × 10⁻⁵ mol/l, Sample volume=157.0 μl, Reagent volume=141.3 μl, SDS=0.01% in SIA unit.
SIA Unit
Effect of the flow rate
The effect of the flow rate on the peak height was the lesson in the range of 9-18 ml/min (Table 12, Figure 10) show that. The flow rate was 13.00 ml/min as optimizing rate after that the height of peak was reduced due to declining the sensitivity of measurement in height flow rate because the reaction was no attained when increased the flow rate [21].
Effect of loading coil in SIA
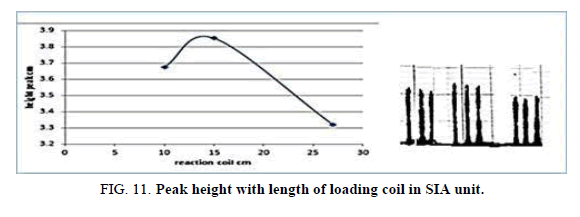
Table 13 and Figure 11, has shown the effected of the loading coil Length on the peak height in the range 20-40 cm it was reading the suitable loading coil length was 30 cm, since it provided the larger sensitivity.
| Reaction coil length cm | Peak height cm | Mean | SD | RSD% | ||
|---|---|---|---|---|---|---|
| 20 | 3.5000 | 3.5860 | 3.5750 | 3.5536 | 0.0324 | 0.9118 |
| 30 | 4.1000 | 4.1700 | 4.0010 | 4.0903 | 0.0595 | 1.4566 |
| 40 | 3.6130 | 3.5750 | 3.6090 | 3.5990 | 0.0132 | 0.3675 |
Table 13. Effect of loading coil length on peak height at Zinc (II) ion conc.=5 mg/l, Reaction coil length)=15 cm, Dithizon conc.=5 × 10⁻⁵ mol/l, Sample volume=157.0 μl, Reagent volume=141.3 μl, SDS=0.01% in SIA unit.
Effect of the reaction coil length in SIA
Table 14, Figure 12 have shown the effected of the reaction coil on the peak height in the range 10-20 cm it was reading the suitable reaction coil length was 15 cm since it provided the larger sensitivity.
| Reaction coil length cm | Peak height cm | Mean | SD | RSD% | ||
|---|---|---|---|---|---|---|
| 10 | 3.6970 | 3.6800 | 3.6190 | 3.6653 | 0.0406 | 1.1076 |
| 15 | 4.1000 | 4.1700 | 4.001 | 4.0903 | 0.0842 | 2.0600 |
| 20 | 3.3670 | 3.2124 | 3.3657 | 3.3150 | 0.0509 | 1.5381 |
Table 14. Effect of on reaction coil length peak height at Zinc (II) conc.=5 mg/l, Dithizon conc.=5 × 10⁻⁵ mol/l, Sample volume=157.0 μl, loading coil length=30 cm, Reagent volume=141.3 μl, SDS=0.01%, Flow rate=13.00 ml/min. in SIA unit.
Effect of the sample volume in SIA
The influence of the different volume 117.75 μl-235.5 μl of samples was observed sample volume that exhausted the greatest peak height was found to be 20 cm and it was chosen as the optimum (Table 15, Figure 13).
| V of Zinc (II) ion μl | Peak height cm | Mean | SD | RSD% | ||
|---|---|---|---|---|---|---|
| 1 17.75 | 3.6280 | 3.6270 | 3.7050 | 3.6533 | 0.0435 | 1.1907 |
| 157.0 | 4.1000 | 4.1700 | 4.0010 | 4.0903 | 0.0842 | 2.0600 |
| 235.5 | 3.7080 | 3.7080 | 3.7610 | 3.7256 | 0.0300 | 0.8052 |
Table 15. Effect of the sample volume on peak height at Zinc (II) conc.=5 mg/l, Reaction coil length=15 cm, Dithizon conc=5 × 10⁻⁵ mol/l, Reagent volume=141.3 μl, Loading coil length=30 cm, SDS=0.01%, Flow rate=13.00 ml/min in SIA unit.
Effect of the reagent volume in SIA
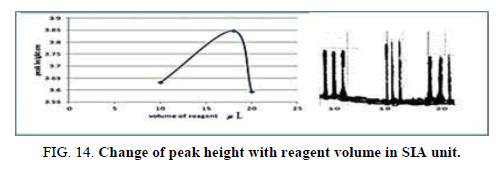
The influence of the different volume 78.50 μl-157.0 μl of reagent was observed reagent volume that exhausted the greatest peak height was found to be 141.3 μl and it was chosen as the optimum (Table 16, Figure 14).
| V of dithizone (II) μl | Peak height cm | Mean | SD | RSD% | ||
|---|---|---|---|---|---|---|
| 78.50 | 3.6640 | 3.5960 | 3.6330 | 3.6310 | 0.0331 | 0.9115 |
| 141.3 | 4.1000 | 4.1700 | 4.0010 | 4.0903 | 0.0842 | 2.0600 |
| 157.0 | 3.5950 | 3.5900 | 3.5950 | 3.5933 | 0.000 0 | 0.0000 |
Table 16. Effect of reagent volume on peak height at Zinc (II) ion conc.=5 mg/l, Reaction coil length=15 cm, Dithizon conc.=5 × 10⁻⁵ mol/l, Loading coil length=30 cm, Sample volume=157.0 μl, SDS=0.01%, Flow rate=13.00 ml/min in SIA unit.
Effect of the reagent concentration
The same concentration of the reagent in the system FIA adopted in the system SIA, which give the best height and the best sensitivity is 5 × 10⁻⁵ mol/l.
Calibration curve in SIA
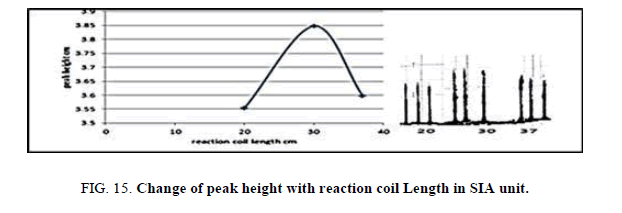
Attended chain from ion concentration between 0.5 mg/l-25 mg/l at the optimum condition of Zinc complex formation and change in the ion concentration (Table 17, Figure 15), that show curve is linear in the range of 1 mg/l-15 mg/l.
| Reaction coil length cm | Peak height cm | Mean | SD | RSD% | ||
|---|---|---|---|---|---|---|
| 10 | 3.6970 | 3.6800 | 3.6190 | 3.6653 | 0.0406 | 1.1076 |
| 15 | 4.1000 | 4.1700 | 4.001 | 4.0903 | 0.0842 | 2.0600 |
| 20 | 3.3670 | 3.2124 | 3.3657 | 3.3150 | 0.0509 | 1.5381 |
Table 17. Reaction coil length=15 cm, Dithizon conc.=5 × 10⁻⁵ mol/l, Sample volume=157.0 μl, Reagent volume=141.3 μl, SDS=0.01%, Flow rate=13.00 ml/min, Loading coil length=30 cm, Reaction coil length=30 cm peak height of reagent=2.9927 cm in SIA unit.
Effect of the sample volume in SIA
The influence of the different volume 117.75-235.5 μl of samples was observed sample volume that exhausted the greatest peak height was found to be 20 cm and it was chosen as the optimum (Table 18, Figure 16).
| V of Zinc (II) ion μl | Peak height cm | Mean | SD | RSD% | ||
|---|---|---|---|---|---|---|
| 1 17.75 | 3.6280 | 3.6270 | 3.7050 | 3.6533 | 0.0435 | 1.1907 |
| 157.0 | 4.1000 | 4.1700 | 4.0010 | 4.0903 | 0.0842 | 2.0600 |
| 235.5 | 3.7080 | 3.7080 | 3.7610 | 3.7256 | 0.0300 | 0.8052 |
Table 18. Effect of the sample volume on peak height at Zinc (II) conc.=5 mg/l, Reaction coil length=15 cm, Dithizon Conc=5 × 10⁻⁵ mol/l, Reagent volume=141.3 μl, Loading coil length=30 cm, SDS=0.01%, Flow rate=13.00 ml/min in SIA unit.
Effect of the reagent volume in SIA
The influence of the different volume 78.50-157.0 μl of reagent was observed reagent volume that exhausted the greatest peak height was found to be 141.3 μl and it was chosen as the optimum (Table 19, Figure 17).
| V of dithizone (II) μl | Peak height cm | Mean | SD | RSD% | ||
| 78.50 | 3.6640 | 3.5960 | 3.6330 | 3.6310 | 0.0331 | 0.9115 |
| 141.3 | 4.1000 | 4.1700 | 4.0010 | 4.0903 | 0.0842 | 2.0600 |
| 157.0 | 3.5950 | 3.5900 | 3.5950 | 3.5933 | 0.000 0 | 0.0000 |
Table 19. Effect of reagent volume on peak height at Zinc (II) ion conc.=5 mg/l, Reaction coil length=15 cm, Dithizon conc.=5 × 10⁻⁵mol/l, Loading coil length=30 cm, Sample volume=157.0 μl, SDS=0.01%, Flow rate=13.00 ml/min in SIA unit.
Effect of the reagent concentration
The same concentration of the reagent in the system FIA adopted in the system SIA, which give the best height and the best sensitivity is 5 × 10⁻⁵ mol/l.
Calibration curve in SIA
Attended chain from ion concentration between 0.5-25 mg/l at the optimum condition of Zinc c omplex formation and change in the ion concentration (Table 20, Figure 18), that show curve is linear in the range of 1-15 mg/l.
| Conc. of Zinc (II) ion mg /l | Peak height Cm | Mean | Value after removed peak of reagent | SD | RSD% | ||
|---|---|---|---|---|---|---|---|
| 1 | 3.1870 | 3.3670 | 3.3770 | 3.3103 | 0.3176 | 0.1067 | 3.2254 |
| 2 | 3.4100 | 3.4270 | 3.4560 | 3.4310 | 0.4383 | 0.0223 | 0.6499 |
| 3 | 3.8100 | 3.8100 | 3.7300 | 3.7900 | 0.7973 | 0.0469 | 1.2374 |
| 4 | 3.9870 | 3.9860 | 3.8800 | 3.9510 | 0.9588 | 0.0608 | 1.5395 |
| 5 | 4.1000 | 4.1700 | 4.0010 | 4.0903 | 1.0976 | 0.0842 | 2.0600 |
| 6 | 4.2501 | 4.2500 | 4.2925 | 4.2642 | 1.2715 | 0.0234 | 0.5499 |
| 7 | 4.3700 | 4.3990 | 4.3900 | 4.3863 | 1.3936 | 0.0122 | 0.2781 |
| 8 | 4.6700 | 4.6900 | 4.6400 | 4.6333 | 1.6406 | 0.0474 | 1.0237 |
| 9 | 4.8020 | 4.8300 | 4.8030 | 4.8100 | 1.8173 | 0.0141 | 0.2931 |
| 10 | 4.9350 | 4.9620 | 4.9000 | 4.9323 | 1.9396 | 0.0300 | 0.6082 |
| 15 | 6.0001 | 6.0001 | 6.0890 | 6.0303 | 3.0376 | 0.0360 | 0.5979 |
Table 20. Reaction coil length=15 cm, Dithizon conc.=5 × 10⁻⁵ mol/l, Sample volume=157.0 μl, Reagent volume=141.3 μl, SDS=0.01%, Flow rate=13.00 ml/min, Loading coil length=30 cm, Reaction coil length=30 cm. Peak height of reagent=2.9927 cm in SIA unit.
Repeatability
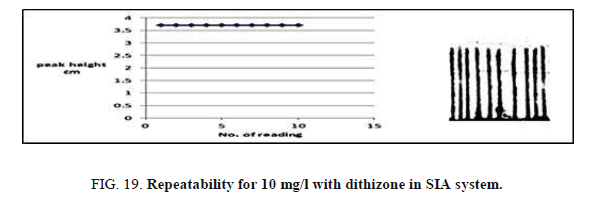
Repeatability was edified through re-injection the same concentration of Zinc (II) ion. The concentration ion was 10 mg/l and 1 × 10⁻⁵ mol/l from dithizone (Table 21, Figure 19) show the repeatability of Zinc (II) ion. The efficacy of the proposed SIA units for the determination of Zinc (II) ion was reversed from the results of repeatability.
| No of peak height | 1 | 2 | 3 | 4 | 5 | 6 | 7 | 8 | 9 | 10 | Mean | SD | RSD% |
|---|---|---|---|---|---|---|---|---|---|---|---|---|---|
| Peak height cm | 4.935 | 4.900 | 4.962 | 4.935 | 4.900 | 4.962 | 4.935 | 4.900 | 4.962 | 4.935 | 4.932 | 0.0251 | 0.5089 |
Table 21. Effect of repeatability on peak height at Zinc (II) ion conc.=10 mg/l, Reaction coil length)=15 cm, Dithizone conc.=5 × 10⁻⁵ mol/l, Sample volume=157.0 μl, Loading coil length=30 cm, Reagent volume=141.3 μl, SDS=0.01%, Flow rate=13.00 ml/min in SIA unit.
Determination of dispersion
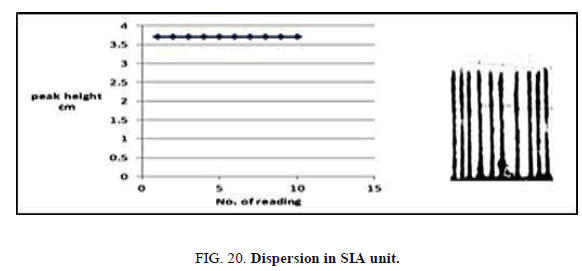
To measure the dispersion value in different sample zones of 10 and 5 mg/l Zinc (II) ion for SIA, two experiments were borne out. In the first experiment, after mixing of reactants (dithizone and Zinc (II) ion that passes through manifold unit gives continuous responsive and indicates non-existent of dispersion impact by convection or diffusion. this measurement represents (H°). the experiment second includes injection different concentration of Zinc (II) ions 10 and 5 for FIA and signals recorded as Hmax. The value dispersion (D) from this experiment can be calculated from this equation. D=H°/Hmax, These values in limit state of dispersion (Table 22, Figure 20).
| Conc. of ion Zinc (II) ion mg/l | Response cm |
Dispersion (D) D=H°/H max |
|
|---|---|---|---|
| Hmax | H° | 1.2986 | |
| 5 | 4.0903 | 5.3118 | |
| 10 | 4.9323 | 6.1103 | 1.2388 |
Table 22. Dispersion value Zinc (II) ion conc=(5,10), mg/l,, Reaction coil length=15 cm, Dithizon conc.=5 × 10⁻⁵mol/l, Sample volume=157.0 μl, Reagent volume=141.3 μl, Loading coil length=30 cm, SDS=0.01%, Flow rate=13.00 ml/min in FIA system.
Effect of interfering ions
This effect of some actions (Cd2+, Ca2+, Mn2+, Cu2+, Fe2+, Ni2+) and anions (Cl-, So42-, CH3COO-, Co32-, F-) in determination of Zinc (II) ion it was 5 and 50 mg/l for each ions, and give the results noninterference between the Zinc (II) ion and ions interfering.
Application
The aim from this applied for the determination of Zinc (II) ion in pharmaceutical samples. The recoveries value is shown in Table 23.
| Samples | Taken Conc. of Zinc (II) ion using SIA system mg /l | Found value mg /l | Recovery % |
|---|---|---|---|
| Ostacare tablets vitabiotics lL td, 1Apsley Way London NW27HF, England. | 5 | 5.8762 | 122.1426 |
| Hemetic liquid mbH | 5 | 5.9512 | 95.9362 |
| Ferroveito liquid mbH | 5 | 4.8543 | 97.0907 |
| Ferromeria liquid mbH | 5 | 6.01131 | 120.2262 |
| Sample | Taken conc. of Zinc (II) ion using FIA system mg/l | Found value in mg/l | % Recovery |
| Ostacare tablets vitabiotics lL td, 1 Apsley Way London NW27HF, England. | 5 | 5.3497 | 106.994 |
| Hemetic liquid mbH | 5 | 4.3292 | 86.584 |
| Ferroveito liquid mbH | 5 | 4.8115 | 96.2300 |
| Ferromeria liquid mbH | 5 | 4.7109 | 94.2180 |
Table 23. Applied for the determination of Zinc (II) ion in pharmaceutical samples.
Comparison between parameters of FIA and SIA unit
The results obtained from the methods used in the study were compared to the determination of the Zinc (II) ion (the injection method FIA and SIA) as shown in Table 24.
| Optical characteristics | FIA unit | SIA unit |
|---|---|---|
| Sample volume μl | 157.0 | 157.0 |
| Reagent volume μl | 1 41.3 | 141.3 |
| Conc. reagent mg/l | 5 × 10⁻⁵ | 5 × 10⁻⁵ |
| Flow rate ml/min | 13.000 | 11.20 |
| Sample rate | 70.000 | 64.000 |
| Linearity range mg/l | 2-10 | 1-15 |
| Coefficient correlated | 0.9864 | 0.9939 |
| Slop | 0.1085 | 0.1892 |
| Detection limit mg /l practically | 1.6746 | 0.1934 |
| Relative standard deviation (%) determination for 10 mg/l n=10 | 0.8491 | 0.5102 |
| Recovery % | 86.584-106.994 | 95.9362-122.1426 |
Table 24. Comparison between some parameters of FIA and SIA units.
Conclusion
It is concluded from this study that the Recovery % in SIA unit higher from recovery % in FIA unit, this means, SIA unit is more accurate than FIA unit for determination for Zinc (II) ion using dithizone.
References
- Robert BS, Rebecca R. Zinc: An essential micronutrient. Am Fam Physician. 2009;79(9):768-72.
- Prasad AS. Zinc: An overview. Nutrition. 1995;11(1):93-9.
- Prasad AS. Discovery of human zinc deficiency: It’s impact on human health and disease. Adv Nutr. 2013;4(2);176-190.
- Mac Donald RS. The role of zinc in growth and cell proliferation. The Journal of Nutrition. 2013;130 (5S);1500S-8S.
- Toshiyuki F, Satoru Y, Keigo N, et al. Zinc homeostasis and signaling in health and diseases. J Biol Inorg Chem. 2011;16(7);1123-34.
- Nazanin R, Richard H, Roya K. Zinc and its importance for human health: An integrative review. J Res Med Sci. 2013;18(2):144-57.
- Lonnerdal BO. Dietary factors influencing zinc absorption. J Nutr. 2000;130(5):1378S-83S.
- Maurice E, Moshe S, editors. Modern Nutrition in Health and Disease. 9th ed. New York. Lippinkott Williams & Wilkins. 2003;pp:223-39.
- Lide DR. Handbook of Chemistry and Physics. 86th ed. CRC. 2005;pp:126-8.
- Herman AL, Earl HW. Diphenylthiocarbazone (Dithizone) as an Analytical Reagent. J Am Chem Soc. 1937;59(10);1966-71.
- Nguyen PH. Thesis. University of Arkansas. Fayetteville Scholar Works. 2017;140-64.
- Shihai K, Taleb M, Uri B. Nature Materials 2. 2003;155-158.
- Pual G. Mercury, ultra-trace analysis: Hydrargyrum from diphenyl thiocarbozone to atomic absorption. 3rd ed. iUniverse Rv America. 2013;pp:90-122.
- Glick D. Methods of Biochemical Analysis. John Wiley & Sons, Inc. New York. 2009;33:243-7.
- Oliveros MCC, Oroncio J, Jose LPP, et al. Cloud point preconcentration and flame atomic absorption spectrometry: application to the determination of nickel and zinc. J Anal at Spectrom. 1998;13; 547-550.
- Vellaichamy S, Palanivelu K. Preconcentration and separation of copper, nickel and zinc in aqueous samples by flame atomic absorption spectrometry after column solid-phase extraction onto MWCNTs impregnated with D2EHPA-TOPO mixture. J Haz Mat India. 2011;185(2-3);1131-9.
- Siripat S, Jaroon J, Yuthsak V, et al. Exploiting flow injection and sequential injection anodic stripping voltammetric systems for simultaneous determination of some metals. Talanta. 2002;58(6);1235-42.
- Thanh D, Peter CH. Simultaneous separations of cations and anions by capillary electrophoresis with contactless conductivity detection employing a sequential injection analysis manifold for flexible manipulation of sample plugs. J Chrom A. 2012;1267:266-72.
- Jatisai T, Peter CH. High-voltage capacitively coupled contactless conductivity detection for microchip capillary electrophoresis. Anal Chem. 2002;74(24);6378-82.
- Khdeeja JA, Safa ZS. New design units in flow injection analysis and sequential injection analysis for Determination of copper (II) by analytical reagent. Int J Chem Sci. 2015;13(4);1535-39.
- Khdeeja JA, Nabeel ARH. J Acta Chem Pharm Indica. 2014;4(3);1.
