Original Article
, Volume: 6( 1)CME Speed and Angular Width Distributions During 23 and 24 Solar Cycle Maximum
- *Correspondence:
- Bidhu SS , Physics Research Centre, Department of Physics, Nesamony Memorial Christian College, Marthandam -629 165 India, Tel: 04651 270 257; E-mail: bidhuss@gmail.com
Received: March 13, 2017; Accepted: May 17, 2017; Published: May 22, 2017
Citation: Bidhu SS, Sobia AI, Benjamin D. CME Speed and Angular Width Distributions During 23 and 24 Solar Cycle Maximum. J Space Explor. 2017;6(1):122.
Abstract
The present work is carried out to analyze the distribution of linear speed and angular distribution of coronal mass ejections (CMEs) present during 23 and 24 solar cycle maximum phase, which were obtained by Large Angle and Spectrometric Coronagraph of SOHO. Solar wind speed and angular width decide the nature of the CME. Despite of the fact that 24 solar cycle is a weaker one, observe more number of CMEs than 23 solar cycle throughout the solar maximum. Also 24 solar cycle observes more CMEs with slow solar wind than 23 solar cycle within this specific time.
Keywords
Angular width; Coronal Mass Ejection (CME); Linear speed; Solar maximum; Solar wind
Introduction
The dynamic phenomena that occur in the atmosphere of stars accelerate plasma or particles beyond the escape speed. As a result, the stars lost its mass in all succession. We can detect two forms of mass loss by scrutinizing the Sun, our nearest star; one form is the steady solar wind outflow and other form is the sporadic ejection of large plasma structures, termed coronal mass ejections (CMEs). Coronal mass ejection is a huge outburst of solar mass into the interplanetary space [1]. Coronal Mass Ejections (CMEs) are spectacular and violent phenomena of the solar atmosphere with repercussions throughout the entire heliosphere [2]. CMEs were first detected in the coronagraph images obtained on 1971 Dec. 14, by NASA's OSO-7 spacecraft [3]. They are a spectacular sight when seen to erupt from the Sun with the aid of a coronagraph such as LASCO on the Solar and Heliospheric Observatory SOHO. Observing Large Angle and Spectrometric Coronagraphs (LASCO) on board SOHO (Solar and Heliospheric Observatory), Yashiro et al. [4] have described properties of Narrow CMEs. Whereas Gopalswamy et al. [5] have studied the solar cycle variation of different properties of CMEs such as daily CME rate, average and medium speeds and the latitude of solar sources for cycle 23 from 1996-2003. LASCO/SOHO images represent unique data coverage from solar cycles 23 and 24 and beyond with a single spacecraft [6].
The relation between CMEs and the other phenomena has been examined by many researches [7,8]. Earlier measurements of the CMEs speeds angular width distributions have helped to advance our knowledge of the physical processes in the solar corona. In this paper, we analyze the statistical properties of CMEs during solar cycle 23 and 24 solar maxima by utilizing data from the catalogue of SOHO/LASCO CMEs. SOHO LASCO observed nearly 5200 CMEs during 23 solar maximum and nearly 5700 CMEs are observed during 24 solar maximum even though 24 solar cycle is a weak cycle than 23 solar cycle. Present study compared statistical distributions against observed speed and angular width distributions.
Data collection
The data collected from SOHO LASCO CME catalogue which is available at http://cdaw.gsfc.nasa.gov/CME_list. SOHO LASCO CME CATALOG contains a list of all CMEs manually identified since 1996 from the LASCO on board the SOHO mission. Over the past 20-years the SOHO LASCO instrument has detecting CMEs. The LASCO instrument consists of three coronagraphs C1, C2 and C3 that span the fields of view 1.1–3RS, 2–6RS and 4–30RS. Both C2 and C3 are externally occulted white light coronagraphs; while C1 has been out of operation since 1998 June which was designed for spectrometric purposes.
Speed distribution of CME during 23 and 24 solar cycle maximum
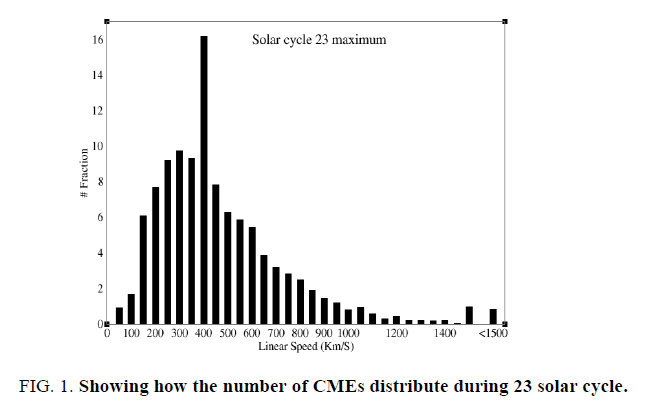
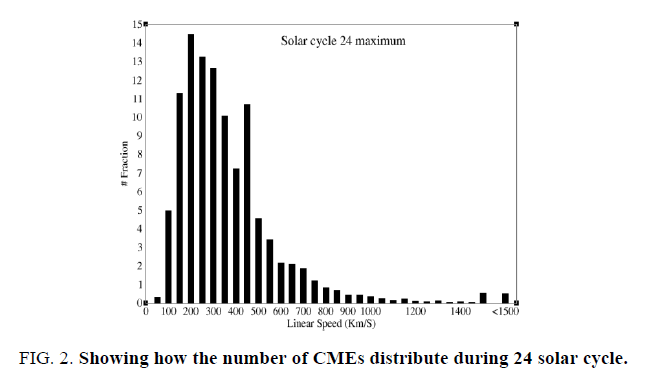
Figure. 1 and Figure. 2 show the how the number of CMEs distribute during 23 and 24 solar cycle. Mass motion is a basic characteristic of CMEs and quantified by their speeds. Coronagraphs obtain images with a preset time cadence and when a CME occurs, the leading edge moves to a greater heliocentric distance. On measuring the heliocentric distance of the leading edge of a CME in each LASCO image, one obtains CME height as a function of time. Height-time measurements are made in the sky plane, so all the derived parameters such as speed etc. are the lowe r limits to the real values [9]. The height-time plots are then fitted to first order polynomials which give an average speed within the LASCO field of view. The CME velocity general means the radial propagation speed of the top part of a CME frontal loop.
During 23 solar cycle maximum phase, linear speed of CMEs predominantly distributed around 400 km/S. But for 24 solar cycle maximum phase, linear speed of CMEs distributed much greater near 200 km/s. Also figure illustrate that most of the CMEs observed in 24 solar maximum phase have less than 500 km/s. CMEs with slow solar wind is much abundant in 24 solar maximum phases than 23 solar maximum.
By analyzing linear speed of CMEs, it is found that 75.06% of CMEs have slow solar wind features in 23 solar maximum phase and 89.55% of CMEs have slow solar wind features in 24 solar maximum phase. The overall solar maximum linear speed average and median of CMEs during 23 solar maximum phase are 490 km/s and 439 km/s and overall linear speed average and median of CMEs during 24 solar maximum phase are 366 km/s and 311 km/s.
Angular width distribution of CME during 23 and 24 solar cycle maximum
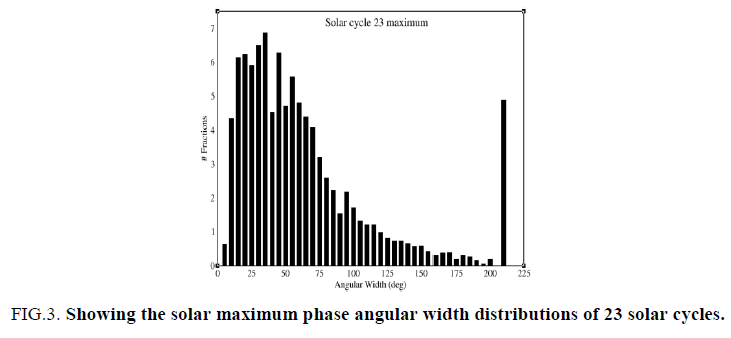
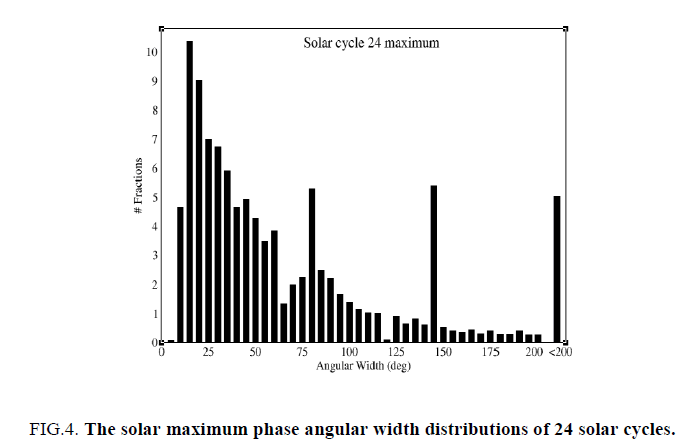
The angular width of CMEs typically refers to their projected, apparent span, in degree. The angular width of CMEs projected in the plane of the sky ranges from ~2º to 360º [4]. CMEs originating from close to the limb resemble measured width as true width. Many CMEs show an increase in width as they move out, so measurements are made when the width appears to approach a constant value. The Figure. 3 and 4 show the solar maximum phase angular width distributions of 23 and 24 solar cycles.
During 23 solar cycle maximum, angular width of CMEs predominantly distributed around 10º-75º. But for 24 solar cycle maximum, angular width of CMEs distributed much peaked around 10º- 60º. Also figure illustrate that most of the CMEs observed in both solar maximum cycles have lower angular width distribution. The apparent angular width of CMEs ranges from a few degrees to 150º. The overall solar maximum angular width average and median of CMEs during 23 solar maximum are 121º and 49º and overall angular width average and median of CMEs during 24 solar maximum are 61º and 40º.
Conclusion
We observed more than 5200 CMEs during 23 solar maximum phase and more than 5700 CMEs during 24 solar maximum. Even though 24 solar cycle is a weaker one, more CMEs are found in maximum phase than 23 solar cycle maximum. A large number of CMEs have speeds smaller than 850 km/s but greater than 150 km/s are found in 23 solar maximum phase. The largest fraction of CMEs had a speed of 400 km/s and number of CMEs having linear speed greater than 1000 km/s is very small(5.8%) observed in this period. In 24 solar maximum, many of CMEs have speeds smaller than 700 km/s but greater than 100 km/s are found. The largest fraction of CMEs had a speed of 200 km/s and number of CMEs having linear speed greater than 1000 km/s is very small (2.05%) observed in this duration. From the above analysis inference of the work is that the CMEs with more slow solar wind are found in 24 solar maximum than in 23 solar maximum.
In 23 solar cycle maximum phase, many of CMEs have angular width smaller than 125º but greater than 10º are found in 23 solar maximum phase. The largest fraction of CMEs had an angular width of 35º and number of CMEs having angular width greater than 180º is very small (6%) are observed in this period. 24 solar cycle maximum phase observed many of CMEs have angular width smaller than 150º but greater than 10º are found. The largest fraction of CMEs had a angular width of 15º and number of CMEs having angular width greater than 180º is very small (6%) observed in this duration. CMEs speed changes with time. CMEs derive their energy from the magnetic fields in solar active regions, which contain intense magnetic fields during the solar activity maximum.
The physical properties of CMEs such as linear speed and angular width have investigated during recent successive solar cycle maxima. The histogram of CME linear speed and angular width distribution show that there is tendency towards low speed and angular width CMEs. The observational evidences presented in this paper suggest that during solar activity maximum phase, 24 solar cycle has CMEs with more slow solar wind than 23 solar cycle.
References
- Howard RA, SheeleyJr NR, Plunkett SP, et al. Properties of coronal mass ejections: SOHO LASCO observations from January 1996 to June 1998. J Geophys Res. 2000;105:169-85.
- Hundhausen AJ, Burkepile JT. Speeds of coronalmass ejections: SMM observations from 1980 and 1984-1989.?, J Geophys Res. 1994;99:6543-52.
- Tousey R. The solar corona. Space Res. 1973;13(2):713-30.
- Yashiro S, Gopalswamy N, Michalek G, et al. Properties of narrow coronal mass ejections observed with LASCO. Adv Space Res. 2003;32(12):2631-35.
- Gopalswamy N, Lara A, Yashiro S, et al. In solar variability as an input to the earth?s environment. ESA SP-535, Nooedwijk: ESA Publication division; 2003.403-14p.
- Brueckner RA, Howard GE, Koomen MJ, et al. The large angle spectroscopic coronagraph (LASCO). Sol Phys. 1995;162:357-402.
- Gopalswamy N, Yashiro S, Liu Y, et al. Coronal mass ejections and other extreme characteristics of the 2003 October-November solar eruptions. J Geophys Res. 2005;110:A09S15.
- Gosling JT, Hildener E, MacQueeen RM, et al. The speeds of coronal mass ejection events. SolarPhys. 1976;48: 389.
- Gopalswamy N.Coronal mass ejections of cycle 23. J Astrophys Astron. 2006;27:243-54.
