Research
, Volume: 18( 4)Characterization of Physicochemical, Heavy Metal and Poly Aromatic Hydrocarbon on Industrial Sewage in Nile river, Egypt
- *Correspondence:
- Khaled. M. Zakaria Egyptian Nuclear and Radiological Regulatory Authority,Egypt, E-mail: drkhaledzakaria@gmail.com
Received: Sep-05-2020, Manuscript No. tsijcs-23-98869; Editor assigned: October-07-2020, PreQC tsijcs-23-98869 (PQ); Reviewed: October-10-2020, QC No. tsijcs-23-98869 (Q); Revised: October-20-2020, Manuscript No tsijcs-23-98869 (R); Published: Nov-05-2020, DOI: 10.37532/0972-768X.2020.18(4).298
Citation:Zakaria KM. Characterization of Physicochemical, Heavy Metal and Poly Aromatic Hydrocarbon on Industrial Sewage in Nile river, Egypt. Int J Chem Sci. 2022;18(4):298..
Abstract
This study analyzed the sample of water and sediments form El-Hawamdeya, Egypt. As much as 11 stations sample site were investigated for the pysicochemical characteristic, heavy metal and PAHs concentration. The physicochemical characteristic includes DO, COD, BOD, EC, pH and TDS. The results showed that the 63% stations have higher concentration of DO, COD and BOD compared to maximum concentration allowed by Egyptian regulation. The characterization of heavy metal including Cd, Co, Cu, Fe, Mn and Pb. The concentration of Co, Cu, Fe, Mn and Pb is still in the range of permissible limit from EPA while the Cd concentration has higher number than permissible limit. The highest concentration of PAHs is 2.256 mg/L and the lowest 0.0220 mg/L. Some stations have no detection for several kinds of PAHs. From all these result, the situation of El-Hawadeya region should be concerned in term of psycochemical characteristic, heavy metal contamination especially Cd and PAHs pollution.
Keywords
Physicochemical parameters, Heavy metals, Industrial sewage, Poly Aromatic Hydrocarbon, River Nile alkenes
Introduction
All life forms on earth depend on water for their survival in the ecosystem [1]. According to Daraei et al, water is the second most important element required by human for survival after the air for we breathe [2]. The quality of water globally has been affected negatively due to man-made activities including unskilled utilization of natural water resources. Even though, the United Nations recognizes the availability of good drinking water for humans as a human right, high numbers of people in worldwide are still suffering with the limited access of clean and new drinking water [3].
The activity from agricultural discharge, industrial effluents and municipal sewage are being recklessly dumped into the Nile river, Egypt which cause the water spring on Nile river is not suitable for human consumption [4]. Sewage water from slums and other areas in Cairo are directly discharged to the river without treatment due to lack of water treatment plants [5]. Agricultural discharge highly contains pollutants including organic pollutants, pesticides and herbicides, which have negative effects on the river ecosystem and the people who consume the water [6]. Industrial effluents are very toxic containing heavy metals that can combine with the suspended solids in domestic wastewater to form muck [7]. All of these factors are causing pollutionn for Nile River and give negative impact for future generations [8].
Egypt faces a rapidly increasing deterioration in surface area and groundwater due to increasing discharges of heavily polluted domestic wastewater and industrial effluents into the water flow [9]. There are approximately 24,000 industries in Egypt and about 700 of them have major industrial facilities [10]. Egyptian industries use 638 Million m3 /year of water, which around 549 Million m3/year is discharged to the drainage system [11]. Industrial activities in the Greater Cairo and Alexandria contribute 40% of the total water discharged [12]. The Nile River supplies 65% of the industrial water needs and receives more than 57% of its effluents. Chemical contaminants are the most noticeable pollution that has an impact on the quality of water [13]. These chemical pollutants are coming from industrial activity and emission from transportation combustion of petroleum derivatives [14]. In the rural area, pollution arises from residues of agricultural chemicals, such as fertilizers and pesticides. United Nation reported that 61% of the population in rural areas and 26% of the urban population does not have safe drinking water due to contamination of pesticides in groundwater [15].
Bioaccumulation of toxic heavy metals in biota of the river ecosystems may have adverse effects on animals and humans [16]. Higher levels of heavy metals in biota have negative effects on the ecological health of aquatic animal species and contribute for decreasing their populations [17]. Previous study has been confirmed that transmission of pesticide residues is toxic to fish. Metal concentrations above threshold levels affect the microbiological balance of soils and can reduce their fertility [18]. Heavy metals are strong neurotoxins in fish species which its interaction of heavy metals with chemical interrupt the communication of fish with their environment [19]. Heavy metals have been found associated with fish deformities in both natural populations and in the laboratory. Generally, deformities have negative effects on fish populations including their survival rates, growth rates, welfare, and external image [20]. In addition, deformities in fish can serve as excellent biomarkers of environmental heavy metal pollution [21]. Other than organic compounds and heavy metal, Polycyclic Aromatic Hydrocarbons (PAHs) also contribute as pollutants in aquatic ecosystem. The PAHs constitute a large class of semi-volatile organic compounds containing two or more fused aromatic rings. Hundreds of individual PAHs may be formed during incomplete combustion or pyrolysis of 20 organic matters and they are categorized as Persistent Organic Pollutants (POPs) [22]. PAHs are ubiquitous in terrestrial, atmospheric and particularly aquatic environments throughout the world and have been detected in lakes, groundwater and rivers [23]. One of the example of PAH is benzo[a]pyrene [24]. Anthropogenic sources of PAHs in the environment are mainly pyrogenic which mean derived from industrial activities and combustion of organic matter and petrogenic which mean derived from petroleum including crude oil and its refined products [25]. Due to their hydrophobic character, PAHs rapidly become associated with suspended particles and form sediments when they are introduced into the aquatic environment [26]. Contemporary sediments are considered as a sink for hydrocarbons in the aquatic environment and their importance in pollution monitoring has been emphasized by many authors [27]. Sediments are good source of samples representing the levels of hydrocarbons, which are many times higher than those found in the water column [28]. The PAHs released in the aquatic environment enter the food chain and accumulate in aquatic organisms including fish [29]. The POPs are of great concern in environmental monitoring because of their carcinogenic, mutagenic and teratogenic effects on animals especially for aquatic ecosystem [30].
Materials and Methods
Study area
El Hawamdeya is a city in the Giza Governorate of Egypt. The geographical coordinates are 29°53′52″N 31°15′51″E / 29.89778°N 31.26417°E/on the bank of Nile and Marriotia canal as shown in (FIG. 1). It is centre for numerous factories including Egyptian sugar integrated industries, chemical industries, plastics industries and panties industries. These industries produce wastewater as a result from their activity and discharge directly into the Nile river or Marriotia canal [31].
Figure 1: The locations of study area at different stations across north and south the industrial area along Nile river bank.
Sample Collection
Soils and sediments
Four samples were collected using the template method from 10 stations. An area of about 25×25 cm2 up to a depth of 5 cm was cut out from the ground using the stainless steel template for guidance [32]. The samples were collected using a shovel and stored in sealed plastic bags to avoid contamination.
Water
Water samples were collected from Nile River and tributaries around the industrial area. A plastic pail and disposable cups were used to obtain the samples. Unfiltered water samples were then dispensed into 100 ml polypropylene sample bottles, which were then taped shut to avoid spill
Physicochemical analysis
Physicochemical parameters analysis was conducted in-situ including temperature, pH, Electrical Conductivity (EC) and total Dissolved Solids (TDS). All the parameters were measured by using Manta 2, Water-Quality Multiprobe device Sub 3 Model, USA. For each station, a suitable amount of water was collected for major ions and stable isotopes analysis. The water samples were collected in two polyethylene bottles (2 litres) rinsed with the same water sample. All bottles were closed tightly to prevent evaporation. The samples were preserved at 4˚C until the analyses were performed. The Biological Oxygen Requirement (BOD) was measured by the difference between the two dissolved oxygen concentrations before and after incubation estimated according to Azide Modification method. The Chemical Oxygen Requirement (COD) was also measured according to the Dichromate reflux method which is based on heating the sample in the presence of a standard potassium dichromate mixture. The Ratio BOD and COD were calculated for all treatments before and after wastewater treatment with chemicals [33].
Heavy metal analysis
The concentrations of heavy metal including Cd, Co, Cr, Cu, Fe, Mn, Ni and Pb were measured using the Inductively Coupled Plasma - Optical Emission Spectrometry (ICP-OES) with Ultra Sonic Nebulizer (USN) (Perkin Elmer Optima 3000, United States). The samples were filtered by filtration system through membrane fitter of pore size 0.45 μm before analyses using Standard Methods (APHA, 1992). Bed sediment samples were digested using microwave digestion techniques as reported by Littlejohn, et al, in which 0.25 gm of sample was placed in Teflon vessel with 5 ml HNO3 (65%), 2 ml HF (40%) and 2 ml H2O2 (30%) by using Microwave digestion system (MILESTONE mls-200 mega) [34]. An aliquot of the filtration of the samples was taken about 100 ml. Digestion solutions were measured for total heavy metals using ICP-OES (APHA 1995).
Poly aromatic-hydrocarbon analysis
All chemicals were purchased from Sigma-Aldrich Chemical Company. Solvents with highest grade of purity commercially available therefore it used without further purification. The PAH mixture solution containing 16 USEPA priority PAHs standard including Naphthalene (Nap), Acenaphthylene (Acy), acenaphthene (Ace), fluorine (Fle), phenanthrene (Phe), anthracene (Anth), Fluoranthene (Fla), Pyrene (Pyr), Benzo[A]Anthracene (BaA), Chrysene (Chr), Benzo[B]Fluoranthene (BbF), Benzo[K]Fluoranthene (BkF), benzo[a]pyrene (BaP), indeno[1,2,3-cd] pyrene (Ind), dibenz[a,h]anthracene (DBA) and benzo[g,h,i]perylene (BgP)). All of these mixture was transferred to acetonitrile with concentration 10 µg·mL-1 for each mixture. In order to exclude impurities before use, analytical-grade anhydrous Na2SO4 was used.
Extraction of PAHs
The general overall method used has been described in the literature. The initial 1 L watersample, to be analyzed, was equally divided into two 500 mL fractions. For each fraction, two successive extractions were carried out. Each extraction involved the addition of 100 mL of dichloromethane while letting the mixture shack for one hour with a stirring bar on a magnetic agitator. The mixture was then extracted using a separating funnel. All extracts, combined to a total of 400 mL of dichloromethane, were dried with anhydrous Na2SO4 and concentrated by rotary evaporation to a 1 mL residue liquid for HPLC analysis.
Results and Discussion
Psycohemical analysis
TABLE 1 shows the the result of analysis pysicochemical parameters of water at Nile River from station 1 until station 11. Based on the table 1, the highest concentrations of DO is located at station 11 as much as 6.8 mg/L and the lowest concentration of DO is located at station 5 as much as 4.4 mg/L. In term of COD, the highest concentration is 86.2 mg/L which located at station 3 and the lowest concentration is 33.6 which located at station 11. The highest and lowest concentration of BOD are located at station 2 and station 11 with amount of 56.2 mg/L and 25.2 mg/L respectively. Same thing happend with the EC value which is the highest amount at station 2 as much as 68.2 mS/cm and the lowest amount at station 11 as much as 27.4 mS/cm. The pH value from all stations in range of 7-8 which indicate the neutral pH of the water.
TABLE 1. Concentration of pysicochemical parameters of water at Nile River from different stations.
| Stations | DO (mg/L) |
COD (mg/L) |
BOD (mg/L) |
pH | EC (mS/cm) |
TDS (mg/l) |
|---|---|---|---|---|---|---|
| S1 | 4.9 | 79.4 | 48.3 | 7.24 | 62.8 | 45,700 |
| S2 | 5.1 | 52.7 | 56.2 | 7.35 | 68.2 | 62,200 |
| S3 | 4.8 | 86.2 | 53.8 | 7.46 | 57.4 | 54,300 |
| S4 | 4.6 | 64.6 | 48.7 | 7.67 | 43.7 | 48,500 |
| S5 | 4.4 | 73.8 | 55.2 | 7.32 | 48.4 | 46,200 |
| S6 | 5.2 | 46.3 | 33.7 | 8.17 | 37.2 | 39,600 |
| S7 | 5.6 | 64.7 | 29.5 | 8.15 | 42.6 | 35,300 |
| S8 | 6.2 | 38.3 | 26.8 | 8.23 | 33.8 | 37,400 |
| S9 | 6.7 | 42.4 | 37.4 | 7.65 | 33.4 | 26,300 |
| S10 | 6.4 | 45.2 | 28.3 | 8.12 | 29.5 | 29,500 |
| S11 | 6.8 | 33.6 | 25.2 | 8.22 | 27.4 | 27,600 |
TABLE 2 represents the comparison of minimum standards for the water quality released to the river between World Health Organization Guidelines (WHO), Environmental Protection Agency (EPA United States, 2018) and Egyptian standard regularities of article 60 law No. 48/1982. There is no significant difference between all regulation in term of maximum concentration allowed. According to TABLE 2, the value of pH in this study is still in the range of standard limit for water released to the environment. The pH amount of water in all stations of Nile River are considered safe. This amount is confirmed by previous study which reported on evaluation of water quality at Fayoum watershed, Nile River, Egypt. The result showed that the pH of the water in the range of 7.60-8.47 during winter season and 7.31-8.10 during summer season [35].
TABLE 2. Comparison of minimum standards for the water quality released to the river between World Health Organization Guidelines, U.S. Environmental Protection Agency and Egyptian standard regularities of article 60 law No. 48/1982.
| Parameters | Egyptian Regulation | WHO 2011 | EPA 2018 |
|---|---|---|---|
| pH | 7.0-8.5 | 8.2-8.8 | 6.5-8.5 |
| TDS (mg/L) | 500 | - | 500 |
| DO (mg/L) | <5 | - | - |
| BOD (mg/L) | 6 | - | - |
| COD (mg/L) | 10 | - | - |
| Nitrate(mg/L) | 45 | 50 | 10 |
| Ammonium (mg/L) | 0.5 | - | 30 |
| Iron (mg/L) | 1 | 0.1 | 0.3 |
| Manganese (mg/L) | 0.5 | 0.05 | 0.05 |
| Copper (mg/L) | 1 | 2 | 1 |
| Zinc (mg/L) | 1 | 3 | 5 |
| Cadmium (mg/L) | 0.01 | 0.003 | 0.005 |
| Lead (mg/L) | 0.005 | 0.01 | 0 |
| Total Alkalinity (mg/L) | 20-150 | 200 | 80-120 |
| Oil and Greases (mg/L) | 0.1 | - | 50-100 |
| Sulphate (mg/L) | 200 | 500 | 250 |
| Nitrogen (mg/L) | 1 | - | 2-6 |
| Mercury (mg/L) | 0.001 | 0.002 | 0.002 |
| Detergents (mg/L) | 0.5 | - | 0.7 |
| Florides (mg/L) | 0.5 | - | 4 |
| Phenol (mg/L) | 0.02 | 5 | 2-8 |
| Arsenic (mg/L) | 0.05 | 0.1 | 0.1 |
| Chrome (mg/L) | 0.05 | - | 0.1 |
| Cyanide (mg/L) | 0.1 | 0.2 | 0.2 |
| Silinium (mg/L) | 0.01 | 0.04 | 0.05 |
| Color (units) | 100 | - | 15 |
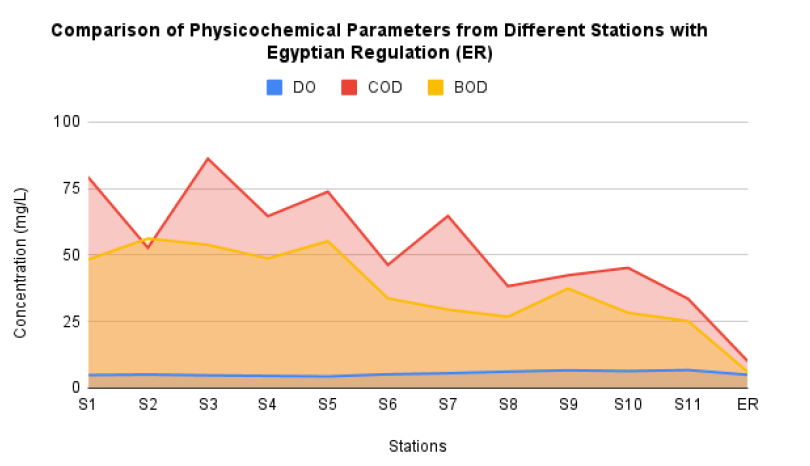
FIG. 2 shows the comparison of concentration between physicochemical parameters including DO, COD and BOD from all stations with maximum concentration allowed by Egyptian regulation. The results show there are 7 stations have higher DO concentration compared to maximum concentration allowed by Egyptian regulation. Meanwhile the rest of stations have lower concentration. The previous study reported that DO in Damietta Branch, Niler River also has higher concentration compared to Egyptian regulation as much as 6.53 mg/L [36]. This can be concluded that most of site in Nile River, Egypt have higher concentration of DO compared to maximum concentration allowed by Egyptian regulation.
Figure 2: The comparison of physicochemical parameters (DO, COD and BOD) from different stations with Egyptian regulatin (ER).
In term of concentration of COD as shown in FIG. 2, all stations at El-Hawamdeya Egypt have higher amount compared to maximum concentration allowed by Egyptian regulation. However, previous study reported that the concentration of COD at water surface of Nile River and Rosetta Branch are in the range of permissible concentration by Egyptian regulation. The concentration of COD from both sites are 7.43 mg/L and 9.65 mg/L respectively [36,37]. It means that Nile River at El-Hawamdeya should be given more attention for action especially for organic pollutant wastewater treatment. FIG. 2 also shows the comparison of BOD concentration between all stations at Nile River with maximum concentration allowed by Egyptian regulation. The results show that all stations at El-Hawamdeya, Egypt have exceded from the maximum limit by Egyptian regulation. The concentrations even reach until 3 times higher than number of maximum limit. Different case happened in Manyal District, Niler River, Egypt which reported by previous study that the BOD concentration in the range of 1 mg/L-4 mg/L [38]. These amount is below than the maximum limit by Egyptian regulation. It indicates the water in Manyal District is categorized safer than in El-Hawamdeya.
Heavy metal analysis
FIG. 3 shows the concentration of Cd from station 1 until station 11 in water sample at El-Hawamdeya, Egypt. The TABLE 3 represents the permissible limit concetration of heavy metals by WHO and EPA. The results show that the highest concentration of Cd is located at 3 stations including station 5, 10 and 11. These 3 stations have same amount of Cd concentration as much as 0.041 mg/L. These concentrations are higher than permissible amount by WHO and EPA. The results of this study is in agreement with previous study which reported the Cd analysis in Al-Nasiria site, Egypt. The previous study reported that concentration of Cd in Nile River is higher than permissible amount by WHO and EPA as much as 0.106 mg/L. It indicates that some of site in Nile River is polluted by Cd.
TABLE 3. Maximum limit concentration of heavy metals for drinking water by world health organization (WHO) and Environmental Protection Agency (EPA).
| Heavy Metals (mg/L) | WHO | EPA |
|---|---|---|
| Cd | 0.003 | 0.01 |
| Co | 0.05 | 0.05 |
| Cu | 1.6 | 1.3 |
| Fe | - | 5 |
| Mn | 0.1 | - |
| Pb | 0.01 | 0.006 |
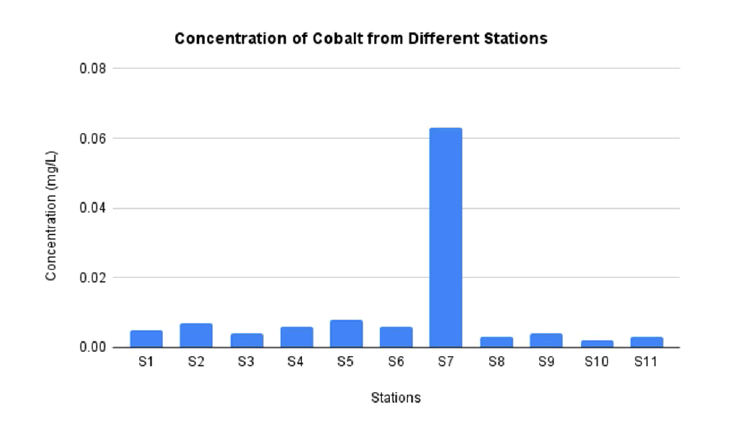
FIG. 4 represents the concentration of Co from station 1 until station 11 in water sample at El-Hawamdeya, Egypt. The lowest concentration of Co is located at station 10 as much as 0.002 mg/L. Meanwhile the highest concentration of Co is located at station 5 as much as 0.008 mg/L. This concentration is still in the range of permissible limit by WHO and EPA which is 0.05 mg/L. Compared to previous study conducted in El-Srew Drain, Egypt which has higher concentration of Co as much as 0.40 mg/L rather than this study [39].
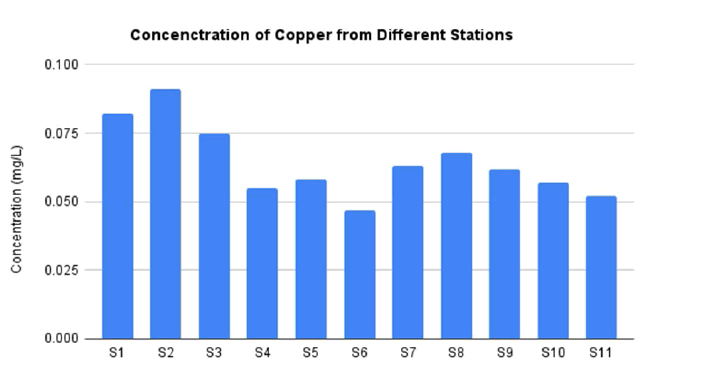
The station 2 is the highest concentration of Cu as much as 0.091 mg/L as shown in FIG. 5. This amount is also in the range of permissible limit by WHO and EPA which is 1.6 mg/L and 1.3 mg/L respectively. In addition, the lowest concentration of Cu is located at station 6 as much as 0.047 mg/L. Previous study also confirmed the concentration of Cu in Nile River is still in the range of permissible limit by WHO and EPA. It is reported that in Lake Nasser, Egypt the Cu concentration as much as 0.021 mg/L [40].
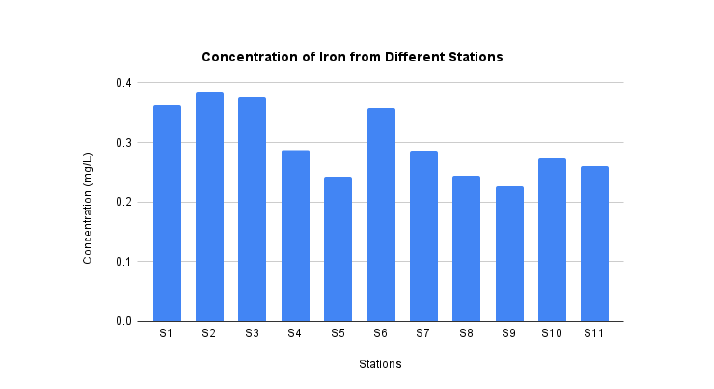
The station 2 is also highest concentration of Fe as much as 0.384 mg/L as shown in FIG. 6. This amount is in the range of permissible limit by EPA which is 5 mg/L. The lowest concentration of Fe is located at station 9 as much as. The previous study reported that the concentration of Fe at Aswan site, Nile river as much as 0.403 mg/L [41]. It means the agreement about some of the site in Nile River were contaminated by Fe (FIG. 6).
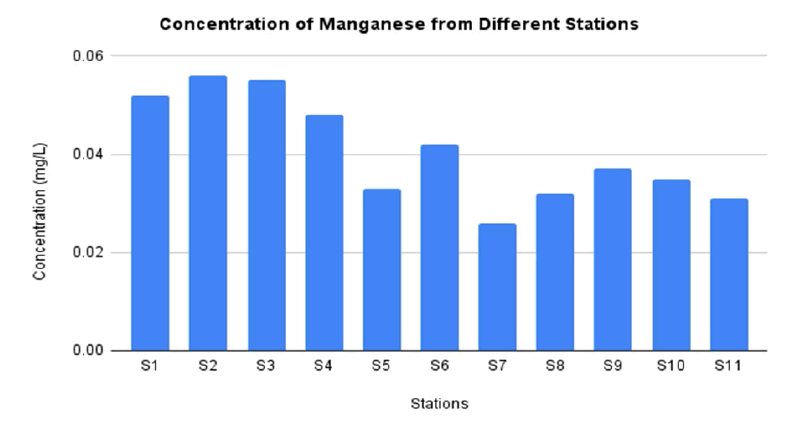
FIG. 7 represents the concentration of Mn in water sample from station 1 until station 11. The highest concentration of Mn is located at station 2 as much as 0.056 mg/L which still in the range of permissible limit by WHO. The previous study confirmed that the Nile River did not affected by Mn. It is reported that the concentration of Mn as much as 0.004 mg/L at Demietta branch, Nile River which is still in the range of permissible amount [42].
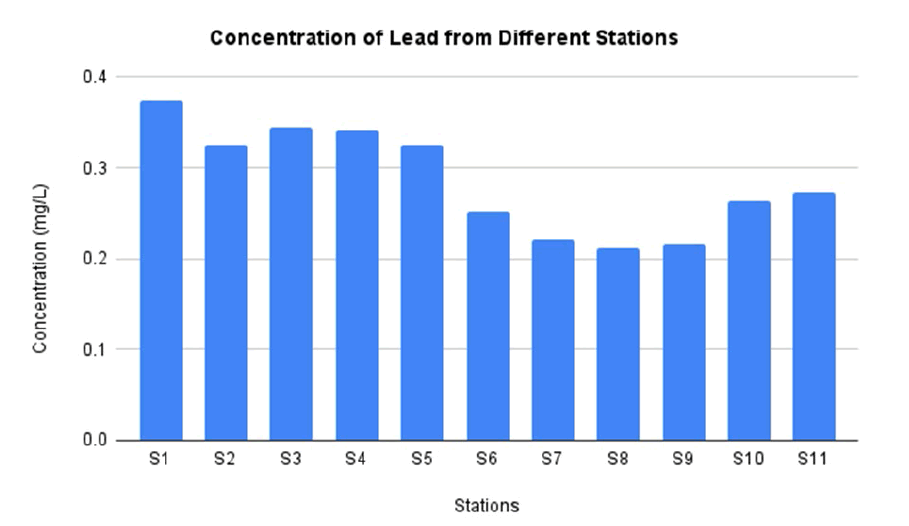
FIG. 8 shows the concentration of Pb in water sample from station 1 until station 11. The highest concentration of Pb is located at station 1 as much as 0.374 mg/L. This amount of concentration is higher than permissible limit by WHO and EPA. In addition, the lowest concentration of Pb is located at station 1 as much as. The concentration of Pb in this study has similar amount with the previous study conducted in El-Minya site, Nile River. The previous study reported that the concentration of Mn in drain water of Nile River as much as 0.329 mg/L [43].
The accumulation of heavy metals including Cd, Co, Cu, Fe, Mn, Pb, etc. in several regions come from the exhausts of transportation, discharges of different industries, oil lubricants, automobile parts, corrosion of building materials, and atmospheric deposition [44]. Heavy metals concentration that coming from different sources such as industrial, domestic waste and soils which cut off by rain and releasing heavy metals into water and groundwater system. The high concentrations of Fe naturally found in regions that have polluted soil. In addition, emissions of vehicle and industry also crust re-suspension increased the concentrations of other heavy metals [45]
Poly aromatic hydrocarbon analysis
Polycyclic Aromatic Hydrocarbons (PAHs) are a class of non-polar volatile organic compounds consisting of two or more benzene rings connected in a linear, angular, or clustered manner [46]. The PAHs are widely spread via different environmental media, such as water, soil, sediments, and the atmosphere [47]. The characteristic of PAHs strongly explains that they are difficult to degrade, toxic, carcinogenic, teratogenic, and mutagenic. Furthermore, the risk of environmental pollution from PAHs has been widely studied [48]. That is why it is important to analyze the concentration of total PAHs from water sample in Nile river.
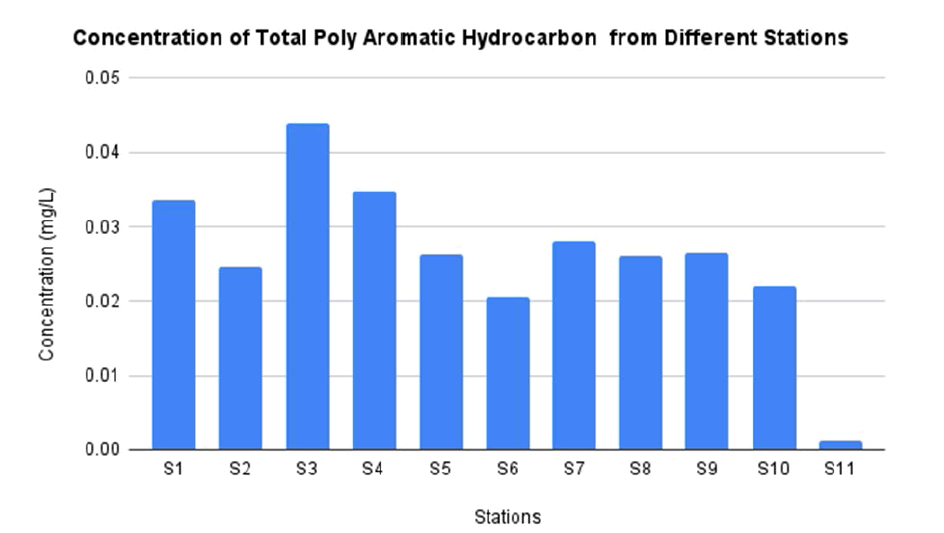
In this study, concentrations of total PAH from water sample at different station is showed by FIG. 9. The highest concentraion is located at station 3 as much as 0.0440 mg/L. On the other hand, the lowest concentration is located at station 11 with only 0.0013 mg/L. The highest concentration of PAHs in this study is higher compared to previous study with concentration as much as 0.0103 mg/L. The previous study was use Rosetta Branch, Egypt as sampling site [49]. Even though there is slightly different between both concentration, something that can be highlighted about the distance between El-Hawamdeya region with Rosetta Branch is approximately 180 miles apart. In addition, different time periods and increased emission of industrialization affect the concentration of PAHs produces [50].
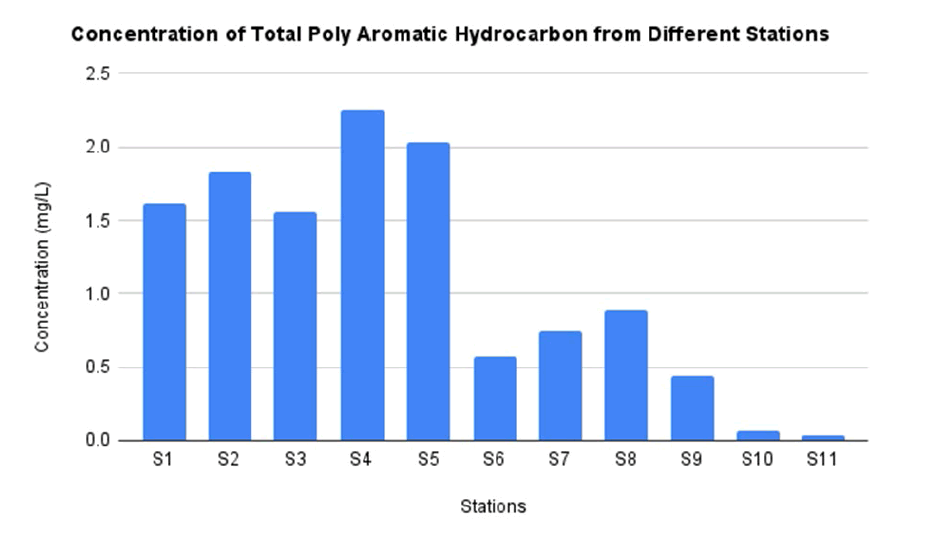
In this study, the type of PAHs detected including acenaphtylene, acenaphtene, anthracene, fluorene, chrysene, fluoranthene and benzo[a]pyrene. According to TABLE 4, the type of PAHs that can be detected in all stations is anthracene and benzo[a]pyrene. The highest concentration of anthracene and benzo[a]pyrene as much as 0.0092 mg/L and 0.0226 mg/L respectively. Meanwhile the lowest concentration of anthracene and benzo[a]pyrene found 0.0012 mg/L and 0.0026 mg/L. Chrysen was found only 60% of the stations including station 1, 4, 5, 6, 7, 8, 9 with the highest value detection 0.0092 mg/L which located at station 7 and the lowest detection 0.0041 at station 6 (TABLE 5). There are some stations which cannot detect the PAHs (FIG. 10). This is due to due to natural removal and reduction by evaporation through solar heat, ultraviolet radiation, and biological activity [51-53].
TABLE 4. Concentration of different PAHs in water sample from different stations.
| Stations | Acenaphtylene (mg/L) | Acenaphtene (mg/L) | Anthracene (mg/L) | Fluorene (mg/L) | Chrysene (mg/L) | Fluoranthene (mg/L) | Benzo[a]pyrene (mg/L) | ∑ PAHs (mg/L) |
|---|---|---|---|---|---|---|---|---|
| S1 | 0.0084 | 0.0007 | 0.0081 | ND | 0.0072 | ND | 0.0091 | 0.0335 |
| S2 | 0.0031 | ND | 0.0055 | ND | ND | 0.0035 | 0.0125 | 0.0246 |
| S3 | 0.0082 | ND | 0.0092 | 0.00 14 | ND | 0.0026 | 0.0226 | 0.044 |
| S4 | 0.0075 | 0.0007 | 0.0074 | 0.00 12 | 0.00 91 | 0.0024 | 0.0064 | 0.0347 |
| S5 | 0.0051 | 0.0002 | 0.0015 | 0.00 31 | 0.00 48 | 0.0032 | 0.0083 | 0.0262 |
| S6 | 0.0022 | ND | 0.0036 | ND | 0.00 41 | 0.0012 | 0.0095 | 0.0206 |
| S7 | 0.0062 | 0.0003 | 0.0022 | 0.00 13 | 0.00 9 2 | 0.0052 | 0.0037 | 0.0281 |
| S8 | 0.0077 | 0.0006 | 0.0027 | 0.00 24 | 0.00 73 | 0.0021 | 0.0033 | 0.0261 |
| S9 | 0.0091 | 0.0004 | 0.0041 | 0.00 12 | 0.00 58 | 0.0033 | 0.0026 | 0.0265 |
| S10 | 0.0058 | 0.0001 | 0.0025 | 0.00 31 | ND | 0.0061 | 0.0044 | 0.022 |
| S11 | ND | 0.0001 | 0.0012 | 0.00 2 2 | ND | 0.0047 | 0.0048 | 0.013 |
TABLE 5. Concentration of different PAHs in sediments sample from different stations.
| Stations | Acenaphtylene (mg/L) | Acenaphtene (mg/L) | Anthracene (mg/L) | Fluorene (mg/L) | Chrysene (mg/L) | Fluoranthene (mg/L) | Benzo[a]pyrene (mg/L) | ∑ PAHs (mg/L) |
|---|---|---|---|---|---|---|---|---|
| S1 | 0.097 | 0.182 | 0.084 | 0.063 | 0.246 | 0. 358 | 0.582 | 1.612 |
| S2 | 0.061 | 0.156 | 0.089 | 0.042 | 0.183 | 0. 574 | 0.726 | 1.831 |
| S3 | 0.082 | 0.071 | 0.083 | 0.0 82 | 0.086 | 0. 737 | 0.417 | 1.558 |
| S4 | 0.094 | 0.364 | 0.095 | 0.0 84 | 0.274 | 0. 5 21 | 0.824 | 2.256 |
| S5 | 0.089 | 0.221 | 0.074 | 0.0 46 | 0.146 | 0. 846 | 0.613 | 2.035 |
| S6 | 0.013 | 0.4 63 | 0.031 | 0.0 16 | 0.073 | 0. 22 1 | 0.216 | 0.57 |
| S7 | 0.011 | 0.082 | 0.037 | 0.0 18 | 0.048 | 0. 13 1 | 0.413 | 0.74 |
| S8 | 0.021 | 0.011 | 0.048 | 0.0 1 1 | 0.0 22 | 0. 442 | 0.327 | 0.882 |
| S9 | 0.031 | ND | 0.025 | 0.0 35 | 0.0 1 1 | 0.121 | 0.221 | 0.444 |
| S10 | 0.025 | ND | 0.013 | 0.014 | 0.0 15 | 0. 353 | ND | 0.067 |
| S11 | ND | ND | 0.027 | ND | 0.0 1 1 | 0. 211 | ND | 0.038 |
Conclusion
The activity from agricultural discharge, industrial effluents and municipal sewage affect the condition and water quality ofthe Nile river, Egypt which cause the water spring on Nile river is not suitable for human consumption. Therefore it is important to study the situation of the Nile river. This study was conducted at El-Hawamdeya, Egypt. As much as 11 stations sample site were investigated for the pysicochemical characteristic, heavy metal and PAHs concentration. The physicochemical characteristic include DO, COD, BOD, EC, pH and TDS. The results showed that the 63% stations have higher concentration of DO, COD and BOD compared to maximum concentration allowed by Egyptian regulation. The characterization of heavy metal including Cd, Co, Cu, Fe, Mn and Pb. The concentration of Co, Cu, Fe, Mn and Pb is still in the range of permissible limit from EPA while the Cd concentration has higher number than permissible limit. The highest concentration of PAHs is 2.256 mg/L and the lowest 0.0220 mg/L. Some stations have no detection for several kinds of PAHs. From all these result, the situation of El-Hawadeya region should be concerned in term of psycochemical characteristic, heavy metal contamination especially Cd and PAHs pollution. An effective river treatment can be intergrated for better water quality in the future.
References
- Vardhan KH, Kumar PS, Panda RC. A review on heavy metal pollution, toxicity and remedial measures: Current trends and future perspectives. Journal of Molecular Liquids. 2019;290:111197.
- Daraei H, Toolabian K, Kazempour M et al. The role of the environment and its pollution in the prevalence of COVID-19. Journal of Infection. 2020;81(2):e168-9.
- Ahmad N. Human right to water under international law regime: an overview. Commonwealth Law Bulletin. 2020;46(3):415-39.
- Abdel-Rahman GN. Heavy metals, definition, sources of food contamination, incidence, impacts and remediation: A literature review with recent updates. Egyptian Journal of Chemistry. 2022 1;65(1):419-37.
- Abdelrazek S. Monitoring irrigation water pollution of Nile Delta of Egypt with heavy metals. Alexandria Science Exchange Journal. 2019 ;40:441-50.
- Chowdhary P, Bharagava RN, Mishra S et al. Role of industries in water scarcity and its adverse effects on environment and human health. Environmental Concerns and Sustainable Development: Volume 1: Air, Water and Energy Resources. 2020:235-56..
- Anderson A, Anbarasu A, Pasupuleti RR et al. Treatment of heavy metals containing wastewater using biodegradable adsorbents: A review of mechanism and future trends. Chemosphere. 2022 May 1;295:133724.
- Shahid S, Razzaq S, Farooq R. Polyhydroxyalkanoates: Next generation natural biomolecules and a solution for the world's future economy. International Journal of Biological Macromolecules. 2021;166:297-321.
- Abd-Elaty I, Saleh OK, Ghanayem HM et al. Assessment of hydrological, geohydraulic and operational conditions at a riverbank filtration site at Embaba, Cairo using flow and transport modeling. Journal of Hydrology: Regional Studies. 2021;37:100900.
- Sovacool BK, Griffiths S, Kim J et al. A critical and systematic review of developments, sociotechnical systems and policy options for reducing synthetic greenhouse gas emissions. Renewable and sustainable energy reviews. 2021;141:110759.
- Saber AA, Ullah Bhat S, Hamid A et al. Chemical Quality and Hydrogeological Settings of the El-Farafra Oasis (Western Desert of Egypt) Groundwater Resources in Relation to Human Uses. Applied Sciences. 2022;12(11):5606.
- El-Khayat HM, El-Wakil ES, Abdel-Motleb A et al. Bacteriological, parasitological and chemical pollution of Nile River water at some Greater Cairo sites. International Journal of Environmental Studies. 2022 Jul 4;79(4):731-47.
- Shalaby SE, El-Saadany SS, Abo-Eyta AM et al. Levels of pesticide residues in water, sediment, and fish samples collected from Nile River in Cairo, Egypt. Environmental Forensics. 2018 Oct 2;19(4):228-38.
- Weldeslassie T, Naz H, Singh B et al. Chemical contaminants for soil, air and aquatic ecosystem. Modern age environmental problems and their remediation. 2018:1-22.
- Yuan MH, Lo SL. Developing indicators for the monitoring of the sustainability of food, energy, and water. Renewable and Sustainable Energy Reviews. 2020;119:109565.
- Ali H, Khan E, Ilahi I. Environmental chemistry and ecotoxicology of hazardous heavy metals: environmental persistence, toxicity, and bioaccumulation. Journal of chemistry. 2019 Mar 5;2019..
- Kahlon SK, Sharma G, Julka JM et al. Impact of heavy metals and nanoparticles on aquatic biota. Environmental chemistry letters. 2018 Sep;16:919-46.
- Kumar A, Thakur A, Sharma V et al. Pesticide residues in animal feed: Status, Safety, and Scope. J. Anim. Feed Sci. Technol. 2019;7:73-80.
- Sonone SS, Jadhav S, Sankhla MS et al. Water contamination by heavy metals and their toxic effect on aquaculture and human health through food Chain. Lett. Appl. NanoBioScience. 2020;10(2):2148-66.
- Macaulay G, Warren‐Myers F, Barrett LT et al. Tag use to monitor fish behaviour in aquaculture: a review of benefits, problems and solutions. Reviews in Aquaculture. 2021;13(3):1565-82.
- Khan M, Javed M, Rehman M et al. Heavy metal pollution and risk assessment by the battery of toxicity tests. Scientific Reports. 2020 Oct 6;10(1):1-0.
- Fuoco R, Giannarelli S. Integrity of aquatic ecosystems: An overview of a message from the South Pole on the level of persistent organicpollutants(POPs).MicrochemicalJournal.2019;148:230-9.
- Campos I, Abrantes N. Forest fires as drivers of contamination of polycyclic aromatic hydrocarbons to the terrestrial and aquatic ecosystems. Current Opinion in Environmental Science & Health. 2021 Dec 1;24:100293.
- Cao H, Wang C, Liu H et al. Enzyme activities during Benzo [a] pyrene degradation by the fungus Lasiodiplodia theobromae isolated from a polluted soil. Scientific Reports. 2020;10(1):1-1.
- Pang SY, Suratman S, Latif MT et al. Polycyclic aromatic hydrocarbons in coastal sediments of Southern Terengganu, South China Sea, Malaysia: source assessment using diagnostic ratios and multivariate statistic. Environmental Science and Pollution Research. 2022:1-4.
- Glaser C, Zarfl C, Rügner H et al. Analyzing particle-associated pollutant transport to identify in-stream sediment processes during a high flow event. Water. 2020 ;12(6):1794.
- Ashok A, Cusack M, Saderne V et al. Accelerated burial of petroleum hydrocarbons in Arabian Gulf blue carbon repositories. Science of the Total Environment.15;669:205-12.
- Ma M, Gao W, Li Q et al. Biodiversity and oil degradation capacity of oil-degrading bacteria isolated from deep-sea hydrothermal sediments of the South Mid-Atlantic Ridge. Marine Pollution Bulletin. 2021;171:112770.
- Honda M, Suzuki N. Toxicities of polycyclic aromatic hydrocarbons for aquatic animals. International Journal of Environmental Research and Public Health. 2020;17(4):1363.
- Okocha RC, Olatoye IO, Adedeji OB. Food safety impacts of antimicrobial use and their residues in aquaculture. Public health reviews. 2018 Dec;39(1):1-22.
- Tawfik MH, Hoogesteger J, Elmahdi A et al. Unpacking wastewater reuse arrangements through a new framework: insights from the analysis of Egypt. Water International. 2021;46(4):605-25.
- Annual book of American Society for Testing and Materials. (1986). United States. [Google Scholar] [Cross Ref]
- Baird RB, Eaton AD, Rice EW. Standard Methods for the examination of water and wastewater 23th edition. [Google Scholar] [Cross Ref]
- El-Hassanin AS, Samak MR, Abdel-Rahman GN et al. Risk assessment of human exposure to lead and cadmium in maize grains cultivated in soils irrigated either with low-quality water or freshwater. Toxicology reports. 2020;7:10-5.
- Hasballah AF, Beheary MS. Detection of heavy metals in breast milk and drinking water in Damietta Governorate, Egypt. Asian Journal of Biology. 2016;1(2):1-7..
- El Sayed SM, Hegab MH, Mola HR et al. An integrated water quality assessment of Damietta and Rosetta branches (Nile River, Egypt) using chemical and biological indices. Environmental monitoring and assessment. 2020 Apr;192:1-6.
- Al-Afify AD, Othman AA, Ramadan MF. Characterization of chemical and microbiological quality of Nile River surface water at Cairo (Egypt). Rendiconti Lincei. Scienze Fisiche e Naturali. 2018 ;29(3):725-36.
- Ghannam HE. Risk assessment of pollution with heavy metals in water and fish from River Nile, Egypt. Applied Water Science. 2021; (7):125.
- Hagras AE, Elbaghdady HA, Gouda AM. Assessment of water quality and heavy metals in water, sediments, and some organs of African catfish (Clarias gariepinus) in El-Serw Drain, Nile Delta, Egypt. International Journal of Environment. 2018;7(4):124-41.
- Abdel-Satar AM, Ali MH, Goher ME. Indices of water quality and metal pollution of Nile River, Egypt. The Egyptian Journal of Aquatic Research. 2017;43(1):21-9.
- Sharaky A, Salem T, Aal AA. Assessment of water quality and bed sediments of the Nile River from Aswan to Assiut, Egypt. The Nile River. 2017:207-38.
- El-Ameir YA. Evaluation of heavy metal pollution in Damietta branch of Nile River, Egypt using metal indices and phyto-accumulators. Journal of Environmental Sciences. 2017;46(2):89-102.
- Salman SA, Asmoay AA, El-Gohary A et al. Evaluation of human risks of surface water and groundwater contaminated with Cd and Pb in the southern El-Minya Governorate, Egypt. Drinking Water Engineering and Science.;12(1):23-30.
- Du Y, Gao B, Zhou H et al. Health risk assessment of heavy metals in road dusts in urban parks of Beijing, China. Procedia environmental sciences. 2013 Jan 1;18:299-309.
- F Hasaballah A, A Hegazy T, S Ibrahim M et al. Assessment of Water and Sediment Quality of the River Nile, Damietta Branch, Egypt. Egyptian Journal of Aquatic Biology and Fisheries. 2019 Dec 1;23(5 (Special Issue)):55-65.
- Lv J, Xu J, Guo C et al. Spatial and temporal distribution of polycyclic aromatic hydrocarbons (PAHs) in surface water from Liaohe River Basin, northeast China. Environmental Science and Pollution Research. 2014 Jun;21:7088-96.
- Zhang L, Dong L, Ren L et al. Concentration and source identification of polycyclic aromatic hydrocarbons and phthalic acid esters in the surface water of the Yangtze River Delta, China. Journal of Environmental Sciences. 2012;24(2):335-42.
- Nakata H, Uehara K, Goto Y et al. Polycyclic aromatic hydrocarbons in oysters and sediments from the Yatsushiro Sea, Japan: comparison of potential risks among PAHs, dioxins and dioxin-like compounds in benthic organisms. Ecotoxicology and environmental safety. 2014 Jan 1;99:61-8.
- Haiba NS, Hassan IA. Monitoring and assessment of polycyclic aromatic hydrocarbons (PAHs) in the atmosphere of Alexandria city, Egypt. Polycyclic Aromatic Compounds. 2018;38(3):219-30.
- Fouad MM, El-Gendy AS, Khalil MM et al. Polycyclic aromatic hydrocarbons (PAHs) in Greater Cairo water supply systems. Journal of Water and Health. 2022 (4):680-91.
- Ukiwe LN, Egereonu UU, Njoku PC et al. Polycyclic aromatic hydrocarbons degradation techniques. International Journal of Chemistry. 2013;5(4):43-55.
- Cheng C, Hu T, Liu W et al. Modern lake sedimentary record of PAHs and OCPs in a typical karst wetland, south China: response to human activities and environmental changes. Environmental Pollution. 2021 ;291:118173.
- Lata S. Sustainable and eco-friendly approach for controlling industrial wastewater quality imparting succour in water-energy nexus system. Energy Nexus. 2021;3:100020.

