Research
, Volume: 15( 4) DOI: 10.37532/0974-7435.2019.15(4).195Calibration of Micropipettes through Gravimetric Solution and its Beneficial Impact on Research
- *Correspondences:
- Navaneethakrishnan Lakshmipriya Institute of Microbiology, Madras Medical College, Chennai, Tamil Nadu, India, E-mail: drpriyamicro@gmail.com
Reji Manjunathan Multi-Disciplinary Research Unit, Chengalapttu Medical College, Chengalpattu, Tamil Nadu, India, E-mail: rejimanjunath@gmail.com
Received: October 1, 2019; Accepted: October 25, 2019; Published: November 1, 2019
Citation: Krishnan KU, Adisesh M, Navaneethakrishnan L, et al. Calibration of Micropipettes through Gravimetric Solution and its Beneficial Impact on Research. Biotechnol Ind J. 2019;15(4):195
Abstract
The use of high-quality precision liquid handling instruments such as pipettes demands more attention because it provides the user with a sense of confidence while dealing with those data whose applications are robust and rigorous. In order to identify and reduce possible errors in liquid handling, it is necessary to calibrate volume instruments using correct methods. At the highest level of acceptability, the accuracy can be determined by the primary method called a gravimetric method in which the contents of a suitable liquid are weighed by known temperature and density. On this background, in-house verification of pipettes within variable volumes such as 200 μl, 500 μl, and 1000 μl has been performed. The gravimetric method uses a balance to weigh liquid volumes. The balance reports a weight and that weight is converted to mass and then to volume using conversion factors, which may be found in tables, calculated from formulas, or produced by software packages. Corrections are made for the temperature and air pressure when the test is done as Z-factor. Statistical analysis was used to convert mass to volume (V=m*Z). The mean of ten measurements is calculated as V. Accuracy is calculated as A=V-Vs. Random error is expressed as standard deviation and coefficient of variability. In the house, verification findings are compared with those data published by ISO-8655 as Maximum Error Limits for pipettes. The analysis indicates that the performance of in-house pipettes especially the precision and accuracy was not within the tolerance limit that has given by the manufacturer. Hence, the pipettes were sent to manufactures for servicing and recalibration
Keywords
Calibration; Pipette; Gravimetric method
Introduction
Pipettes are necessary equipment to satisfy complex requirements and often used in chemical laboratories to measure and transfer the accurate volume of liquid within specifications. It plays a key role in the laboratory where the product development process is long and a great deal of money has been invested.
Hence, it is important to focus on the calibration and uncertainty related to this kind of equipment and also it is imported to consider the pipette’s accuracy on the quality assurance process [1]. Each pipette is unique and demonstrates its own measurement of uncertainty. Testing and calibration of pipettes are essential to ensure the dispensed volume is within the specified process tolerances. The issue can be overcome only with regular testing. In the absence of regular testing, it may be impossible to determine if and when a pipette has gone out of tolerance, which may result in very costly reworking and a lot of wasted time [2].
The cumulative report shows that almost 30% of pipettes and currently using other liquid delivery devices are not performing within the expected tolerance at any given moment [3]. Pipettes have significant limitations due to their susceptibility to environmental effects such as temperature, relative humidity, and biometric pressure. Another important aspect of the majority of pipette malfunctions deals with the variability in operator techniques [4].
Generally, while on calibration the volume of liquid dispensed by the pipette is being tested and is compared against a standard deviation from the measured standard volume. In detail, under constant temperature and atmospheric pressure, the density of distilled water is constant. The volume of water can be determined by weighing dispensed water. When determining the volume of water, the accuracy of measurements is affected by ambient temperature, atmospheric pressure, and relative humidity. These factors are usually combined to give the Z factor, used in the calculation of the volume of water. Then, the calculated volume of water is compared with the theoretical volume to determine the accuracy and precision of the pipette [5].
The main object of this experiment is to evaluate and calibrate pipettes by the gravimetric method [6]. The particular experiment was conducted at HIV Testing National Reference Laboratory, Institute of Microbiology, Madras Medical College, Tamil Nadu, India. The accuracy and precision of 100 μL to 1000 μL pipettes for a selected volume such as 200 μL, 500 μL, and 1000 μL has been performed by Gravimetric method.
Materials and Methods
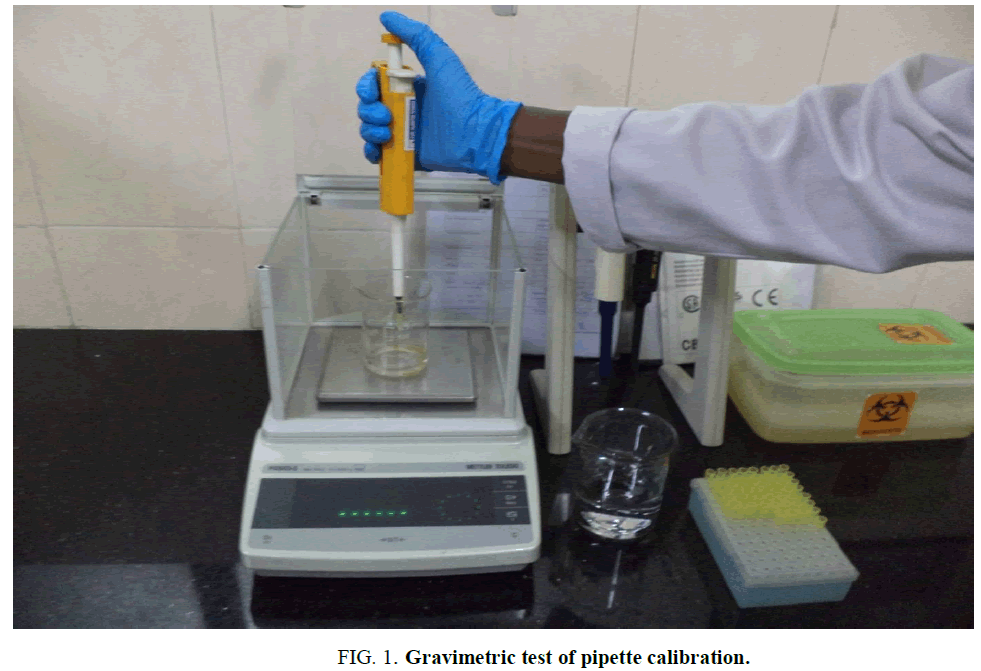
The gravimetric test methodology was adopted for verifying pipette performance. Repeated aspiration and dispense cycles were carried out using distilled water in controlled conditions (a pictogram of the procedure as shown in FIG. 1). Corrections have been made for the temperature and air pressure (Z-factor) to calculate the volume from the weighing balance readings. Pipettes measurement happened in a strictly controlled, vibration-free test environment considering the validation by ISO 8655. The acceptable ranges of environmental conditions are defined as:
• Temperature=Constant (± 0.5°C), 15°C-30°C
• Relative humidity: ˃50%
• Air flow: draft-free
• Static: ~0
• Evaporation rate: ~0
• Vibration: ~0
• Altitude: Ground level
Requirements
Calibrated analytical balance or calibrated weights, calibrated Thermometer, tips, and distilled water.
Procedure
1. Install a new tip on the pipette
2. Pipette distilled water and empty into the waste container. Repeat at least 5 times in order to stabilize the humidity of the air inside the pipette
3. Add water to the weighing receptacle until the level of liquid reaches at least 3 mm
4. Register temperature, environmental pressure, and relative humidity. Press the tab to maintain the initial reading as zero (0)
5. Following the day-to-day lab procedure, fill the pipette tip with water from the storage container and dispense it into the weighing receptacle expelling all the water
6. Register the new weight detected by the balance
7. Repeat steps 5 and 6 at regular intervals and records the weight registered by the balance at the end of each cycle. Make sure that the reading at the balance should be maintained at zero before the beginning of each repetitive cycle
8. Calculate the mass of water dispensed by the pipette in each cycle. Subtract the reading registered at the end of the previous cycle to the reading registered in the current cycle. Repeat for all measurements
9. Multiply the weighing readings (mg) by the Z-factor to obtain a series of volumes (μL)
The formula is V=m × Z.
The Z factor is not only depending on the density of water adjusted to the local temperature and pressure parameters but also account the density of air and the weights used to calibrate the balance. In this procedure, water is used based on the technical unit’s conversion tool for water volume vs. weight measures because of its identical physical total value (1 μL volume of water is equal to the 1 μg of mass). For very low volumes the application of the Z factor may not affect the final result. The estimation of the Z factor (the conversion factor) is given in TABLE 1.
| Temperature (°C) | Air Pressure kPa* | ||||||
|---|---|---|---|---|---|---|---|
| 80 | 85 | 90 | 95 | 100 | 101 | 105 | |
| 15.00 | 1.0017 | 1.0018 | 1.0019 | 1.0020 | 1.0020 | 1.0020 | 1.0020 |
| 15.50 | 1.0018 | 1.0019 | 1.0019 | 1.0020 | 1.0020 | 1.0020 | 1.0021 |
| 16.00 | 1.0019 | 1.0020 | 1.0020 | 1.0021 | 1.0021 | 1.0021 | 1.0022 |
| 16.50 | 1.0020 | 1.0020 | 1.0021 | 1.0021 | 1.0022 | 1.0022 | 1.0022 |
| 17.00 | 1.0021 | 1.0021 | 1.0022 | 1.0022 | 1.0023 | 1.0023 | 1.0023 |
| 17.50 | 1.0022 | 1.0022 | 1.0023 | 1.0023 | 1.0024 | 1.0024 | 1.0024 |
| 18.00 | 1.0022 | 1.0023 | 1.0023 | 1.0024 | 1.0025 | 1.0025 | 1.0025 |
| 18.50 | 1.0023 | 1.0024 | 1.0024 | 1.0025 | 1.0025 | 1.0026 | 1.0026 |
| 19.00 | 1.0024 | 1.0025 | 1.0025 | 1.0026 | 1.0026 | 1.0027 | 1.0027 |
| 19.50 | 1.0025 | 1.0026 | 1.0026 | 1.0027 | 1.0027 | 1.0028 | 1.0028 |
| 20.00 | 1.0026 | 1.0027 | 1.0027 | 1.0028 | 1.0028 | 1.0029 | 1.0029 |
| 20.50 | 1.0027 | 1.0028 | 1.0028 | 1.0029 | 1.0029 | 1.0030 | 1.0030 |
| 21.00 | 1.0028 | 1.0029 | 1.0029 | 1.0030 | 1.0031 | 1.0031 | 1.0031 |
| 21.50 | 1.0030 | 1.0030 | 1.0031 | 1.0031 | 1.0032 | 1.0032 | 1.0032 |
| 22.00 | 1.0031 | 1.0031 | 1.0032 | 1.0032 | 1.0033 | 1.0033 | 1.0033 |
| 22.50 | 1.0032 | 1.0032 | 1.0033 | 1.0033 | 1.0034 | 1.0034 | 1.0034 |
| 23.00 | 1.0033 | 1.0033 | 1.0034 | 1.0034 | 1.0035 | 1.0035 | 1.0036 |
| 23.50 | 1.0034 | 1.0035 | 1.0035 | 1.0036 | 1.0036 | 1.0036 | 1.0037 |
| 24.00 | 1.0035 | 1.0036 | 1.0036 | 1.0037 | 1.0037 | 1.0038 | 1.0038 |
| 24.50 | 1.0037 | 1.0037 | 1.0038 | 1.0038 | 1.0039 | 1.0039 | 1.0039 |
| 25.00 | 1.0038 | 1.0038 | 1.0039 | 1.0039 | 1.0040 | 1.0040 | 1.0040 |
| 25.50 | 1.0039 | 1.0040 | 1.0040 | 1.0041 | 1.0041 | 1.0041 | 1.0042 |
| 26.00 | 1.0040 | 1.0041 | 1.0041 | 1.0042 | 1.0042 | 1.0043 | 1.0043 |
| 26.50 | 1.0042 | 1.0042 | 1.0043 | 1.0043 | 1.0044 | 1.0044 | 1.0044 |
| 27.00 | 1.0043 | 1.0044 | 1.0044 | 1.0045 | 1.0045 | 1.0045 | 1.0046 |
| 27.50 | 1.0045 | 1.0045 | 1.0046 | 1.0046 | 1.0047 | 1.0047 | 1.0047 |
| 28.00 | 1.0046 | 1.0046 | 1.0047 | 1.0047 | 1.0048 | 1.0048 | 1.0048 |
| 28.50 | 1.0047 | 1.0048 | 1.0048 | 1.0049 | 1.0049 | 1.0050 | 1.0050 |
| 29.00 | 1.0049 | 1.0049 | 1.0050 | 1.0050 | 1.0051 | 1.0051 | 1.0051 |
| 29.50 | 1.0050 | 1.0051 | 1.0051 | 1.0052 | 1.0052 | 1.0052 | 1.0053 |
| 30.00 | 1.0052 | 1.0052 | 1.0053 | 1.0053 | 1.0054 | 1.0054 | 1.0054 |
TABLE 1. Values of the conversion factor Z (μl/mg).
As per the earlier research, ten data points were considered adequate to verify accuracy and precision [7] because a quick check using four data points not only useful to verify accuracy alone but also insufficient for evaluating precision [8]. The mean volume is computed from the series of ten volumes (μL). Accuracy and precision for the selected volume are also calculated.
Following the standard defined maximum error limits recommended by ISO 8655 for the piston-operated pipettes, the maximum permissible random error limits were measured. The maximum permissible random error limits for a device at specific volumes ranging from 1-10,000 μL were also calculated because most of the pipette manufacturer's tolerance specifications fall below within the specified error limits by ISO 8655.
In this particular study, the data obtained from the in house verification findings of the pipettes were compared with that of ISO 8655 maximum permissible error chart [9] and is given in TABLES 1 and 2.
| Range | Volume (µl) | ISO 8655 maximum permissible error | |||
|---|---|---|---|---|---|
| Accuracy | Precision | ||||
| ± µl | ± % | ± µl | ± % | ||
| 200 µl-1000 µl | 200 | 8 | 4 | 3 | 1.5 |
| 500 | 8 | 1.6 | 3 | 0.6 | |
| 1000 | 8 | 0.8 | 3 | 0.3 | |
TABLE 2. ISO 8655 maximum Permissible error limit for nominal volume 200, 500, 1000 μl.
Results
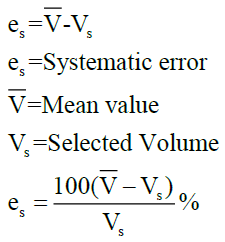
The precision and accuracy for all the three selected volumes of the pipette analyzed were not found within the tolerance limit. Accuracy was measured as the difference between the dispensed volume for the selected volume of the pipette and inaccuracy by means of the numerical difference between the mean of a set of replicate measurements and the true value. The value can be expressed either in absolute units such as microliters or as relative units as a percentage to represent the systematic error as per the given formula.

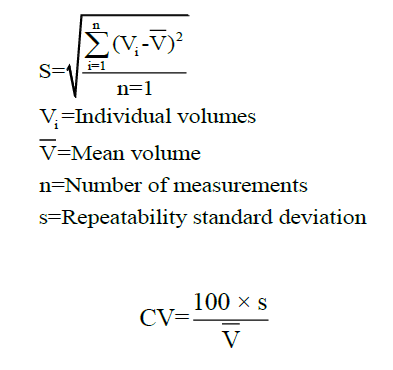
The repeatability or the reproducibility of the measurement was calculated as precision. The absolute imprecision is expressed as standard deviation and the relative imprecision is expressed as a coefficient of variability for the representation of random error based on the given formula.

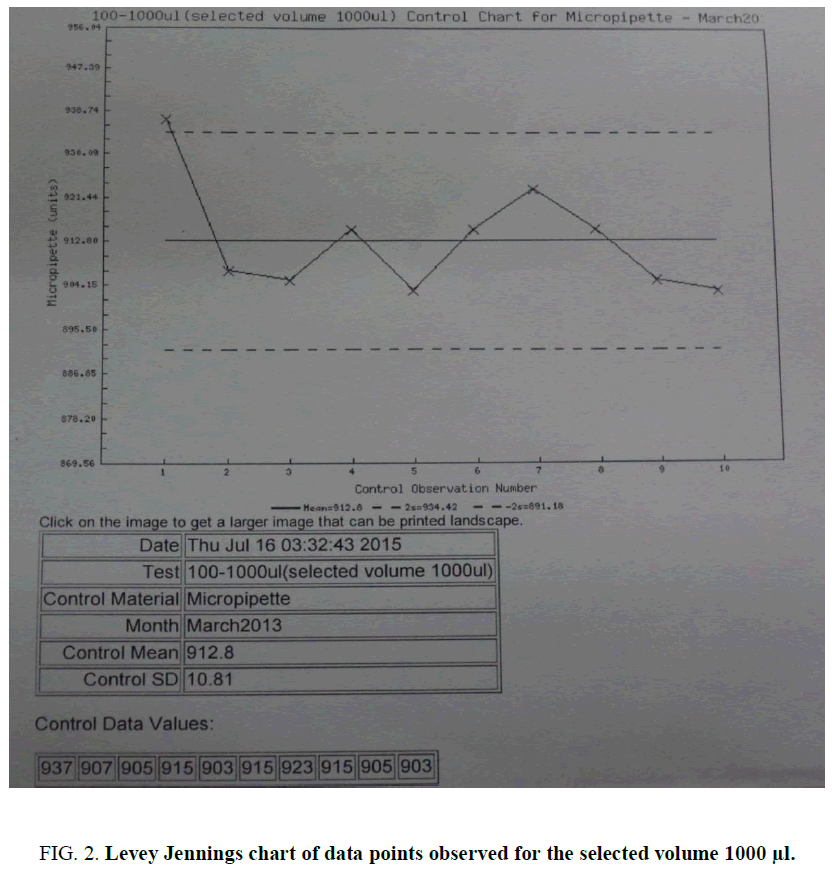
Levey Jennings chart [10,11] was plotted as per the data points observed for the selected volume 1000 μL. The result shows >2SD, as an indicator of the random error of the pipette (FIG. 2). An on-line analysis can be also being performed using a QC simulator [12] for the data as per the convenience.
Discussion
It is highly recommended to calibrate variable volumes devices at regular intervals for its accurate function. It is also equally important to understand the factors that influence the accuracy and precision of volume devices such as pipettes. Since there is continuous development happening in the field of medical equipment validation, the emphasis is given on the development of a methodology that directly helps to calculate those parameters required for validation and verification of pipettes.
In general, variability in pipettes happens due to the following reasons:
• Systemic failure based on factors such as frequency of usage or time since last maintenance
• Random failure due to unpredictable accidents or mishandling
• Operator technique failure happens due to inconsistent or incorrect pipetting handling by the operator
• Environmental factors: Pipettes performance will vary under different environmental conditions such as temperature and humidity
• Device tolerance limits: A variability in liquid delivery due to inaccuracy and imprecision inherent in the pipette itself
These known values are given by the manufacturer’s specifications for the device. Documentation of schedules and procedures for calibration (within the traceability measurements given by national standards), along with periodic maintenance, and validation of performance verification are essential to ensure the proper functioning within the tolerance limit. Many laboratories follow pipette manufacturers’ specifications for the inspection of pipette tolerance limits for their in-lab testing of pipettes. However, a manufacturer’s specifications may not always support the performance validation of the pipette in a working laboratory. As per ISO-8655 definition, the maximum error limits for pipettes are fairly constant for medium- to large-volume pipettes. At the same time, for a small volume of pipettes, the maximum error limits are higher when compared to large volume [13]. This deviation in error limits supports gravimetric calibration method of pipettes in order to accommodate the increased error inherent at a smaller volume.
Calibrating pipette by the same operator under the same condition in which the pipettes function daily is the ideal way to detect pipette failures. This approach is appreciable because it enables the operator to evaluate the impact of environmental factors on the pipetting technique. The state of repair of the pipette based on accuracy and precision can be evaluated in the same way [14]. If the frequency of verification of pipette is periodical, then the detection of malfunctioning of the pipette will be sooner and can be considered for further complete service. A failure in identification of pipette performance will end with generating inaccurate results.
There are several options available to laboratories to calibrate micropipette to measure the efficacy of liquid handling processes, each with their own benefits, applications, and drawbacks. However, the optimal technology for each laboratory environment, tolerance for risk, required calibration frequency and the demand of the laboratory’s processes. Applying the gravimetric method is a well-accepted technology for pipettes calibration. It has many advantages such as the availability of advanced weighing devices, recognition by national and international regulatory agencies and can be easily traced to national standards which further facilitate regulatory compliances and standardization. If the gravimetric methods are followed, it provides an exceedingly precise analysis.
The gravimetric method has many drawbacks when deals with smaller volumes especially with 100 μl or less than this. As volumes decreases, weighing becomes more challenging for several reasons [14]. But the issue can be sorted with more specialized and delicate weighing balances with a stable platform to limit vibration.
Conclusion
Micropipette calibration is more important for accurate and precise measurement of small volumes of liquid in order to ensure correctness at all times. Understanding pipette failure at the earlier is the most effective means of reducing cost, time and risk while improving quality and compliance of micropipettes. Many laboratories attempt to apply pipette manufacturers’ specifications as the tolerance limits for their in-lab testing program. However, a manufacture specification may not accurately reflect the performance attained in the working laboratory. Pipettes calibration by the gravimetric method is the best suited for measuring the performance of pipettes within the variable volume (200 μl to 1000 μl) in in-lab working conditions. Based on the in-house performance records, pipettes can be sent back to the manufacturer for further minute calibrations. Following simple steps for implementing a regular calibration program for pipettes will minimize the source of uncertainty in laboratory data.
Conflicts of Interest
The authors declare that they have no conflicts of interest with the contents of this article.
References
- Majd HA, Hoseini J, Tamaddon H, et al. Comparison of the precision of measurements in three types of micropipettes according to NCCLS EP5-A2 and ISO 8655-6. J Paramedical Sci (JPS). 2010;1(3).
- Mangukiya KK, Panchal M. Impact of calibration of the pipette on quality control results. Int J Clinical Biochem Res. 2016;3(1):28-30.
- Curtis R. Minimizing liquid delivery risk: Pipettes as sources of error. American Laboratory. 2007;39(7):8-9.
- Westgard JO, Koch DD, Oryall JJ, et al. Selection of medically useful quality-control procedures for individual tests done in a multi-test analytical system. Clin Chem. 1990;36(2):230-33.
- http://www.pipettecalibration.net/pipette-Calibration files/Guide-To-Pipetting-2.pdf
- Piston-operated volumetric apparatus, Part 6: Gravimetric methods for the determination of measurement error, International Organization for Standardization, Geneva, Switzerland. 2000.
- Pipetting Technique. Annexure, Manual on quality standards for HIV testing laboratories. Ministry of Health and family welfare, National AIDS Control organization. 2007:120-122.
- https://www.worldcat.org/title/determining-performance-of-volumetric-equipment/oclc/181843033
- American Society for Testing Materials (ASTM), Standard specification for piston or plunger operated volumetric apparatus, Specification E 1154-89. 2003.
- Sharma D. Use of the microsoft excel for automated plotting of Levey Jennings charts. Indian J Med Microbiol 2011;29(4):448-49.
- Carroll TA, Pinnick HA, Carroll WE. Probability and the Westgard rules. Ann Clin Lab Sci. 2003;33(1):113-14.
- Westgard JO, Groth T. Design and evaluation of statistical control procedures: Applications of a computer “Quality Control Simulator” program. Clin Chem. 1981;27(9):1536-45.
- Clark JP, Shull A. Harper. Gravimetric and spectrophotometric errors impact on pipette calibration certainty. Cal Lab. 2003;10(1):36-43.
- Epstein DM, Tebbett IR, Boyd SE, et al. Eliminating sources of pipetting error in the forensic laboratory. Forensic Science Communications. 2003;5(4):1-6.


