Review Article
, Volume: 12( 7)Assessment of the Rate of Rise of Sea Levels Along the East Coast of Florida
- *Correspondence:
- Parker A , School of Engineering and Physical Science, James Cook University, Townsville QLD 4811, Australia, E-mail: albert.parker@jcu.edu.au
Received: May 19, 2016; Accepted: June 07, 2016; Published: June 12, 2016
Citation: Parker A. Assessment of the rate of rise of sea levels along the East coast of Florida. Environ Sci Ind J. (2016);12(7):103.
Abstract
Some papers build alarmistic claims of unbelievably high relative rates of rise of sea levels by focusing on only a few years of data in selected locations, ignoring long term oscillations. An example is the paper “Increasing flooding hazard in coastal communities due to rising sea level: Case study of Miami Beach, Florida”. According to the authors, “the average rate of sea level rise in Southeast Florida increased from 3 ± 2 mm/yr prior to 2006 to 9 ± 4 mm/yr after 2006”. This statement is incorrect, and it is based on a short time window of 10 years that magnifies the positive phasing of the inter-annual, decadal and multi-decadal oscillations along the East Coast of the United States. It is shown in the present paper that even higher short term relative rates of sea level rise that were measured in the past were followed by much smaller values. A long term assessment of the relative rates of rise of the sea levels for the area suggests the sea levels are rising much less and only oscillating about this trend.
Keywords
Sea level; Key west; Florida; East coast
PSMSL Worlwide Sea Level Rise Statistic
It is impossible to compute a meaningful trend of relative sea level rise by fitting the monthly average mean sea levels (MSL) time series [1-5] without good quality sufficient data of spanning a sufficiently long time. According to Douglas [1], it is well established by 1991 that sea level trends obtained from tide gauge records shorter than about 50-60 years are corrupted by interdecadal sea level variation. Because of the well known inter-annual, decadal and multi-decadal oscillations, minimum of 60-70 years of continuous data collected without major perturbations to the instrument are required to infer reliable trends [2-5].
If we consider all the tide gauges with at least 60 years of recorded data in the latest (February 23, 2016) survey of worldwide relative mean sea level trends computed by PSMSL [6], this subset of 212 tide gauges has a naive average relative rate of rise of +0.41 mm/year, with a maximum of +9.41 mm/year and a minimum -13.22 mm/year. Of the 212, 64 tide gauges have negative rates of rise and 148 tide gauges have positive rates of rise. The tide gauges with a “relative” rate of rise exceeding the alleged global “absolute” rate of rise of +3.25 mm/year of the satellite estimation are 16 out of 212 worldwide. They are all located in areas of very well-known extreme subsidence. The most common relative sea level rate of rise is +1.25 mm/year in 37 tide gauges. The relative sea level rise in the long term tide gauges has not changed over the last decades. This statement is about the worldwide naïve average of relative sea level acceleration and velocity. “Absolute” and “global” sea levels are debated in the discussion section.
Sea Level Rise in FERNANDINA BEACH and KEY WEST
In the list of 212, there are only two tide gauges along the whole east coast of Florida, FERNANDINA BEACH and KEY WEST. FERNANDINA BEACH has 104 recorded years over a time span of 117 years for a completeness of 89%. The first year of data is 1898, the last year is 2014. The trend computed by PSMSL is +2.06 ± 0.1 mm/year.
KEY WEST, has 104 recorded years over a time span of 104 years for a completeness of 100%. The first year is 1913, the last year is 2014. The trend computed by PSMSL is +2.33 ± 0.13 mm/year.
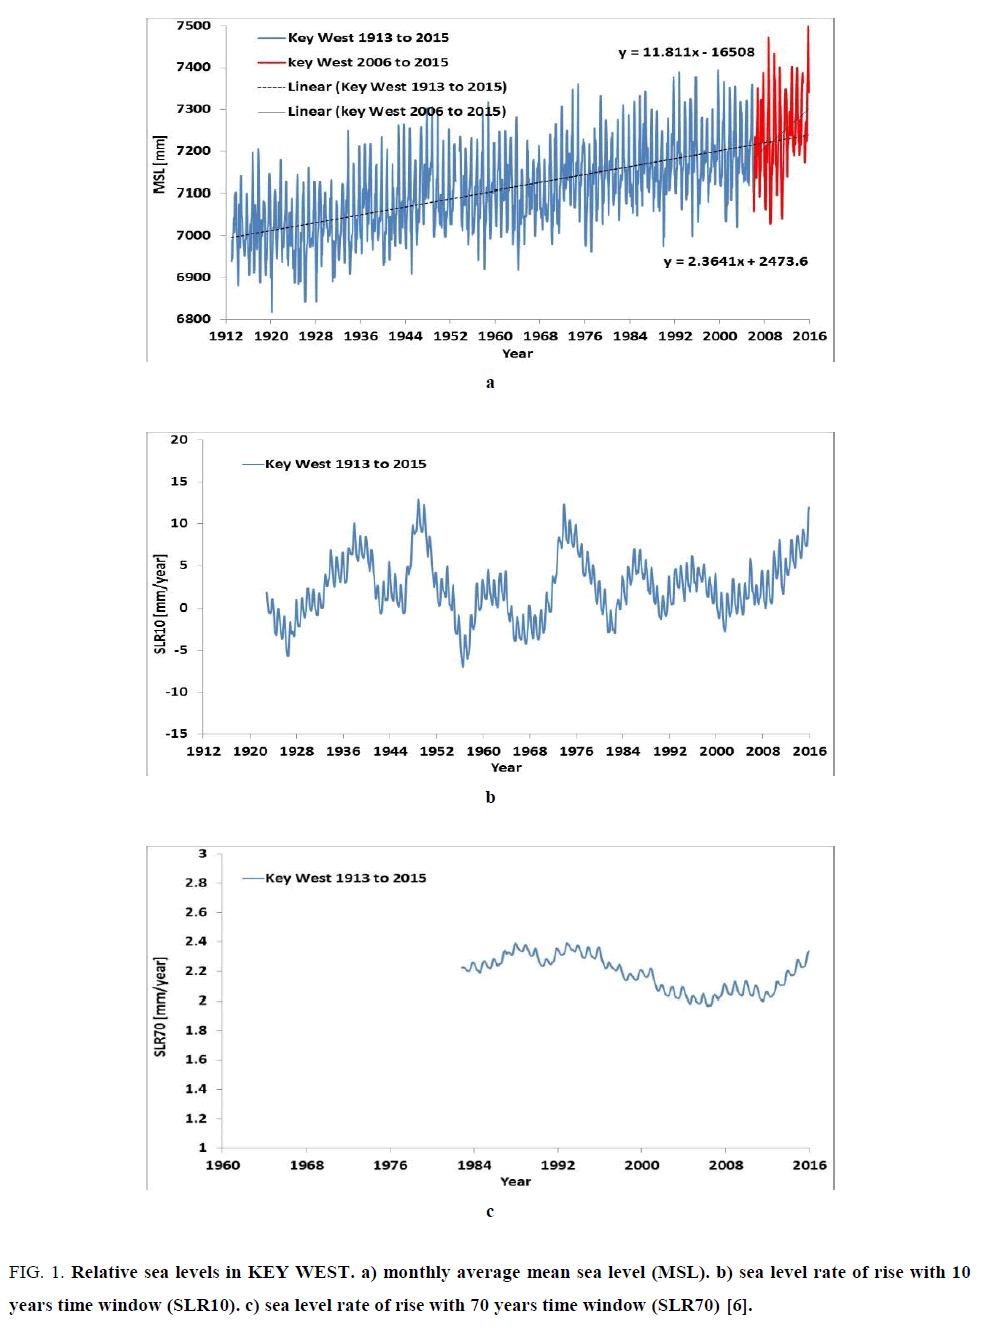
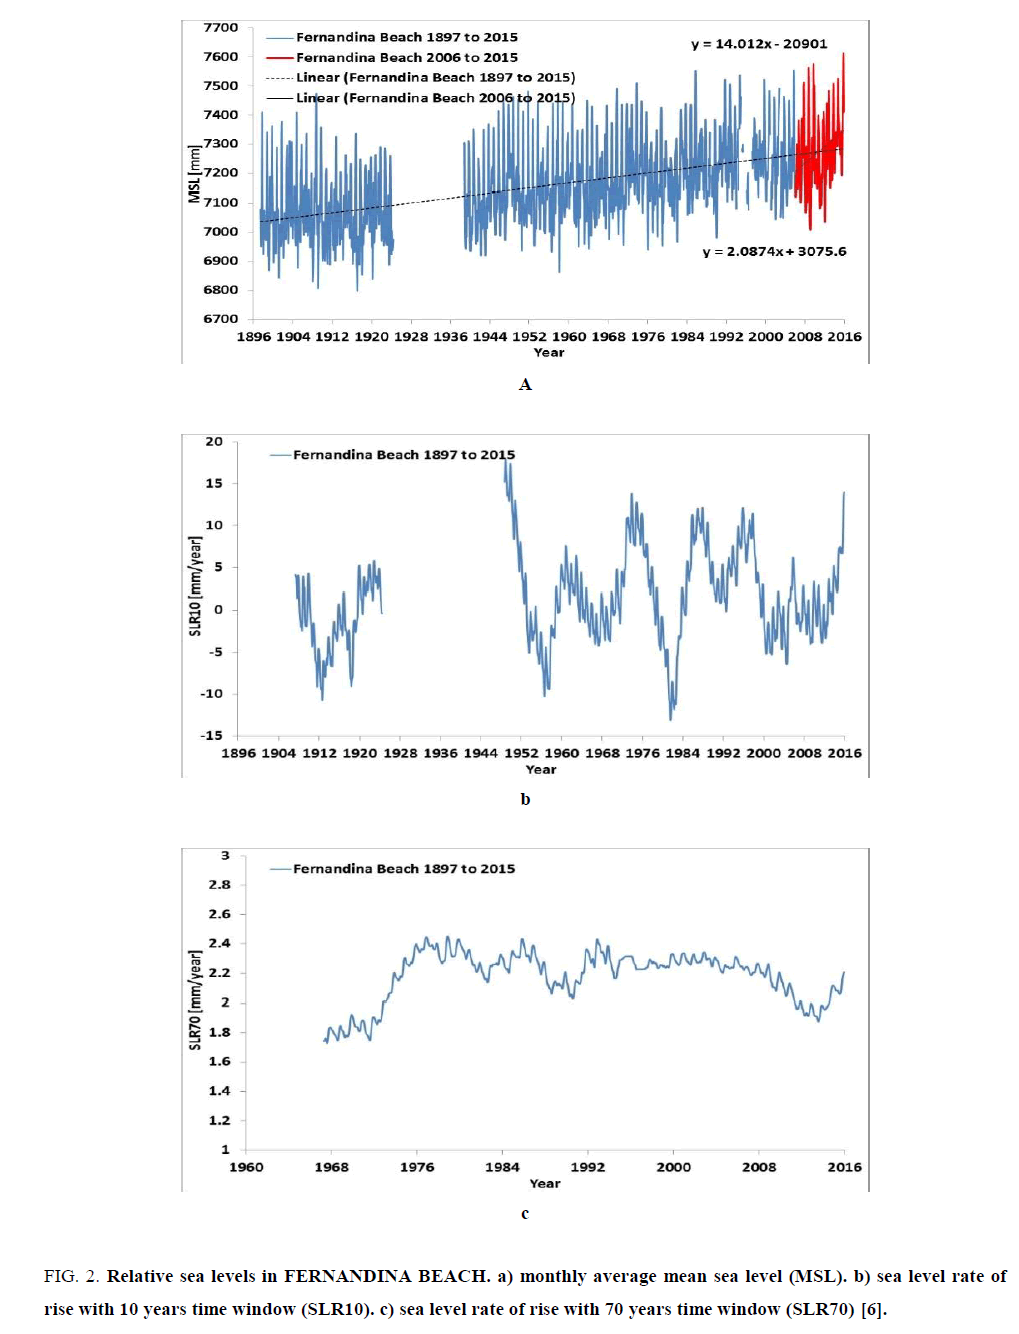
The claim of Wdowinskia et al [7] that along the coast of South East Florida the sea level is rising at a rate of +9 ± 4 mm/yr after 2006 is therefore quite at odds with long term relative sea level rise estimations. It is built on the natural oscillations of the sea levels as shown in Figure 1 and Figure 2.
Figure 1: Relative sea levels in KEY WEST. a) monthly average mean sea level (MSL). b) sea level rate of rise with 10 years time window (SLR10). c) sea level rate of rise with 70 years time window (SLR70) [6].
Figure 2: Relative sea levels in FERNANDINA BEACH. a) monthly average mean sea level (MSL). b) sea level rate of rise with 10 years time window (SLR10). c) sea level rate of rise with 70 years time window (SLR70) [6].
Figure. 1. shows the MSL measured in KEY WEST, the relative rate of rise (SLR) based on a short time window of 10 years (SLR10) or computed with a 70 years’ time window is also shown (SLR70). Figure. 2 shows the same results for FERNANDINA BEACH. As the periodogram for the univariate data series of the MSL in Key West returns an important periodicity of 417 months or 34.75 years, this translates in the request of minimum 70 years of data to infer a reliable trend, similarly to meny others locations worldwide.
The short time window of 10 years is extremely misleading, as the inter-annual, decadal and multidecadal oscillations bias upwards or downwards the computation of the relative rate of rise vs. the likely long term value. The present positive phase produces apparent values much higher than legitimate. In the past, much higher and much lower values have been already experienced.
It is therefore incorect to claim in Key West a SLR of +11.81 mm/year since 2006, as even larger SLR computed with the same short 10 years time windows were previously recorded in the past, and then these values were always followed by much smaller values. As the SLR70 is about constant and also not resently peaking, it seems much more reasonable to state that the sea levels are oscillating in Key West about a +2.36 mm/year trend. Same pattern is found in Fernandina Beach, to show as the oscillations are sinchronous over a much larger area of the Atlantic coast then the area of concerns of the authors.
Sea Level Rise in Other Locations along the East Coast of Florida
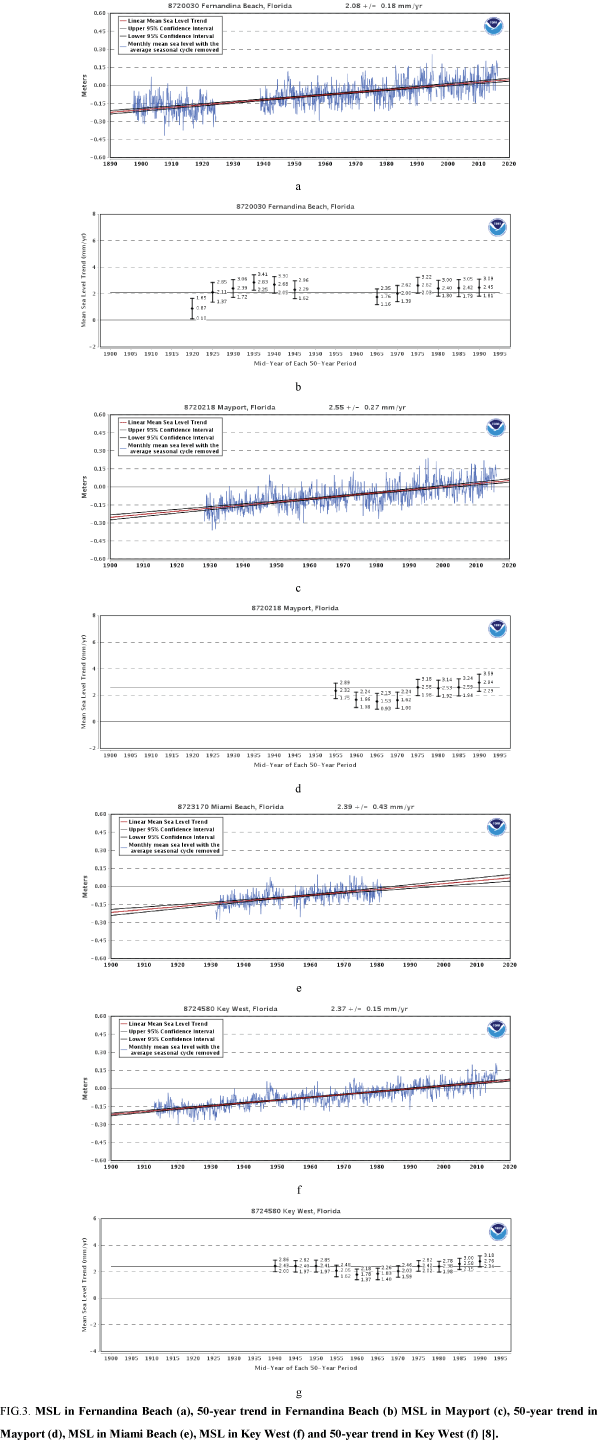
Figure. 3a-3g. [8] presents the MSL in Fernandina Beach, Mayport (another tide gauges of sufficient length and quality neglected by PSMSL), Miami Beach and Key West. Miami Beach unfortunately is not recording since 1981. Despite the record length short (51 years) and the gaps, the sea level oscillations seem quite similar in all these four east Florida coastal locations, as very close are the relative rates of rise, respectively +2.08, +2.55, +2.39 and +2.37 mm/year.
Figure 3: MSL in Fernandina Beach (a), 50-year trend in Fernandina Beach (b) MSL in Mayport (c), 50-year trend in Mayport (d), MSL in Miami Beach (e), MSL in Key West (f) and 50-year trend in Key West (f) [8].
The picture also includes (when available) the variation of the 50-Year Mean Sea Level Trends. Linear mean sea level trends are calculated in overlapping 50-year increments for stations with sufficient historical data [8]. The variability of each 50-year trend, with 95% confidence interval, is plotted against the mid-year of each 50-year period. The solid horizontal line represents the linear mean sea level trend using the entire period of record. This picture further demonstrates the oscillatory rather than accelerating pattern of the sea levels.
Discussion
It is written that the naïve average relative rate of rise measured at the worldwide tide gauges is +0.41 mm/yr. This is not a “global” estimation of the “relative” or “absolute” rate of rise of the sea levels.
Regarding the claim of a “global” absolute sea level rise of about +1.8 ± 0.1 mm/year before the start of the satellite era, roughly 1900 to 1993, it is worth noting that this claim originates from stacking only 21 tide gauge records in areas subjectively considered “stable” to cover the whole world [1], or only 24 [9], in this time with also representatives from the Southern Hemisphere, and introducing a computational correction for the postglacial rebound of unassessed accuracy.
The postglacial rebound model of Peltier [10] is not an accurate representation of the vertical land motion of subsidence or isostasy worldwide. Not only as noted by Morner [11] the glacial isostatic adjustment is a local more than a global phenomenon. There are many other reasons why the land moves vertically, as for example the groundwater extraction, that is particularly relevant for the East Coast and the Gulf states of the United States [12-15]. If we consider for example the area of New Orleans, it has been recently shown [16] that the land is sinking at exceedingly variable rates with maximum of 60-50 mm/year due to a mixture of processes including withdrawal of water, oil and gas, compaction of shallow sediments, faulting, sinking of Earth's crust from weight of sediments.
The vertical velocity of the 21 or 24 tide gauge instruments as discussed by Douglas [1,9] is not given by the Global Isostatic Adjustment model of Peltier [10]. 21 or 24 tide gauges are not an accurate representatiion of the state of the world oceans. Therefore, the “absolute” velocity of the “global” sea level is not +1.8 ±0.1 mm/year as claimed by Douglas [1,9].
In case it could be of interest to understand how much of the +2.33 mm/year of relative sea level rise in Key West is due to subsidence of the tide gauge instrument, the nearby GPS domes monitored by SONEL [17] suggests subsidence of -0.63 mm/year in KYW1, and likely subsidence in CHIN however not assessed for a signal not robust. A subsidence of -0.66 mm/year in KYW1 is also supported by JPL [18]. The relative motion tide gauge vs. GPS dome is unassessed and the vertical velocities of the GPS domes suffer of inaccuracies above 2 mm/year. The actual subsidence of the Key West tide gauge is very likely larger, as the SONEL and JPL constrained optimization deliver “absolute” rates of rise of sea levels much larger than the “relative”, especially in more “sensitive areas” as the United States and Europe.
We are not interested in global sea level velocity trends, as without a proper coverage of the world coastline every claim is a speculation, and we are not interested in computing inaccurate absolute velocities to defocus from the accurate relative sea level rises. We focus on individual tide gauge location with a global persective, considering there not only the velocity, but also the acceleration, i.e., the time rate of change of the velocity. If the sea level acceleration is about zero everywhere in the world, there is no reason why ocean and coastal management should not be local and based on proven relative sea level records [2-5].
Conclusion
As the sea levels are very well known to oscillate on different time scales, from hours to many decades, it is disappointing that many still cherry pick the short term time window to produce the false impression of sea level rises much higher than what they really are.
No sea level relative rate of rise should be computed with short time windows of 10 years or less, and no coastal management should be based on such computations. Along the East Coast of Florida, the sea levels are oscillating after 2006 as they were oscillating before, about a trend of +2 mm/year.
References
- Douglas BC. Global sea level rise. J Geophys Res. 1991;96(C4):6981-92.
- Parker A. Oscillations of sea-levelrise along the Atlantic coast of North America north of Cape Hatteras. NatHazard. 2013;65(1):991-7.
- Parker A. Sea-LevelTrends at Locations of The United States with more than 100 years of recording. NatHazard. 2013;65(1):1011-21.
- ParkerA,Saad SM,LawsonM. Sea-Level Trend Analysis for Coastal Management. OceanCoastManage. 2013;73:63-81.
- Parker A, Ollier CD. Coastal Planning Should be Based on Proven Sea-LevelData. OceanCoastManage. 2016;2(1):1-14.
- http://www.psmsl.org/products/trends/trends.txt
- Wdowinskia S, Braya R, Kirtmana BP, et al. Increasing Flooding Hazard in Coastal Communities Due to Rising Sea Level: Case Study of Miami Beach. OceanCoastManage. 2016;126:1-8.
- http://tidesandcurrents.noaa.gov/sltrends/sltrends.html
- Douglas BC. Global Sea Rise: A Redetermination. SurveysGeophysics. 1997;18(2):279-292.
- Peltier WR.Global Glacial Isostatic Adjustment and Coastal Tectonics. GeologicSocLondon SpecPublicat. 1998;146(1):1-29.
- MornerNA. Glacial Isostasy: Regional-Not Global. IntJGeosci. 2015;6:577-92.
- Galloway DL, Jones DR, Ingebritsen SE.Land Subsidence in the United States: U.S. GeologicSurvey Circ. 1999;1182:175.
- National Research Council Mitigating losses from land subsidence in the United States: Washington DC. National Academy Press.1991; p. 58.
- Clawges RM, Price CV. Digital data sets describing principal aquifers, surficial geology, and ground-water regions of the conterminous United States: U.S. Geological Survey Open. 1999;File Report;99-77.
- Konikow LF. Groundwater depletion in the United States U.S. Geological Survey Scientific Investigations Report. 2013; (1900-2008):5079, 63.
- Jones CE, An K, Blom RG, et al. Anthropogenic and geologic influences on subsidence in the vicinity of New Orleans, Louisiana. Journal of Geophysical Research: Solid Earth. 2016.
- http://www.sonel.org
- http://sideshow.jpl.nasa.gov/post/series.html


