Original Article
, Volume: 12( 3)A Comparative Study of Serum Leptin and Lipid Profile among Non-Diabetic Obese Subjects and Type 2 Diabetic Patients due to Obesity
- *Correspondence:
- Ranadip Mukherjee , Assistant Professor, Department of Biochemistry, SRMS Institute of Medical Sciences, Uttar Pradesh, India, E-Mail: ranadip_mukherjee83@yahoo.co.in
Received: July 27, 2018; Accepted: July 30, 2018; Published: August 27, 2018
Citation: M, Mukherjee R. Study on ?A Comparative Study of Serum Leptin and Lipid Profile among Non-Diabetic Obese Subjects and Type 2 Diabetic Patients due to Obesity?. Biochem Ind J. 2018;12(2):132
Abstract
Background: Obesity and diabetes are the major public health problems in developed as well as developing countries are associated with significant, potentially life-threatening co-morbidities. Insulin and leptin share a common central signaling pathway and there might be a possible role of leptin in the etiology of type 2 DM due to obesity. Moreover few studies have examined the apparent association between serum leptin and type 2 diabetes and those findings are not consonant, so it is useful to reevaluate leptin role in pathogenesis of obesity and type 2 diabetes mellitus.
Materials and Methods: An observational case control study was conducted on OPD patients of SRMS Institute of Medical Science, Bareilly. 40 diagnosed type 2 diabetic obese patients and 25 non diabetic obese subjects were selected and all the biochemical parameters (plasma glucose, leptin and lipid profile) were compared with 25 healthy controls. Statistical analysis was done using SPSS 20.0 version.
Results: We found that serum leptin levels were significantly increased in obese subjects as well as in diabetic patients (p<0.0001) when compared to control group. Significant positive correlation was observed between leptin and BMI both in obese and diabetic obese group. But serum leptin level was not significantly different ('p'=0.44) in obese group with DM in comparison to obese group without type2 DM.
Conclusion: From our observation, it can be concluded that the increase in serum leptin level is associated with obesity but not responsible for the development of diabetes type 2 due to obesity, though more elaborate study with increased sample size may provide more insights.
Keywords
Obesity, Type2 DM, Leptin
Introduction
Obesity and diabetes are the major public health problems in developed as well as developing countries are associated with significant, potentially life-threatening co-morbidities [1,2]. The relation of obesity with Type-2 Diabetes Mellitus (DM) has been understood for decade and the major basis for this relation is the ability of obesity is linked with insulin resistance [3]. Nationwide, the prevalence of type 2 DM is more than 9% in India [3]. More than 60 million of Indians are suffering from Pre-Diabetes and >75 million from type2 DM in 2011 and the figure is ever growing with an approximate estimate of 100 million in 2030 [4]. Diabetes mellitus (DM) and obesity have a complex relationship [5] and in recent scenario worldwide significant numbers of obese individuals are suffering from diabetes [6]. Obesity is not only an established risk factor for type 2 DM but also root of several chronic diseases like progressing to hypertension, development of proteinuria, nephritis, cataract, poor wound healing, increased susceptibility to infection, early ageing, peripheral neuritis, chronic heart diseases and osteoarthritis [6,7].
Obesity is associated with alterations of adipose tissue metabolism. Adipose tissue is recognized nowadays as an active endocrine organ that synthesizes and secretes various inflammatory cytokines, commonly known as adipokines [8]. This adipokines play a key role in regulating various metabolic processes like interfere with insulin sensitivity, glucose homeostasis and lipid metabolism. Among the various adipokines leptin, is the most studied adipocyte derived hormone with molecular weight of 16 kDa, a product of ob gene mainly produced by white adipose tissue [9,10]. Leptin represents as a novel marker of energy storage as the release of leptin is in proportion to the mass of adipose tissue [11]. It enhances the secretion of several cytokines by inflammatory cells and a reduction in its activity leads to insulin resistance [12]. Further, leptin stimulates lipolysis and inhibits lipogenesis and genetic defect in leptin or its receptor will lead to extreme overeating and massive obesity [13]. So leptin plays an important pathophysiological link between obesity and type 2DM which is not properly understood. Various studies suggest that obesity is associated with alteration of leptin levels [14,15]. A recent study suggest that serum leptin levels in T2DM patients are more associated with obesity and less with diabetes.16 Moreover few studies have examined the apparent association between serum leptin and type 2 diabetes and those findings are not consonant. Significant positive associations have been reported by few studies [17-19] whereas no relation have been established by other contemporary studies [20-22]. At the same context inverse relation was also reported by few studies [23,24]. This type of variation observed due to the difference of extent of obesity, age, gender and ethnic group which is not fully understood. Majority of the leptin studies focused to find out the association of leptin in either obese subjects or diabetic patients. It is already proven fact that serum leptin is altered in obesity [14,15] but to our best knowledge no study conducted to reveal the relationship whether there is any further alteration of leptin levels occur when obesity is associated with type 2 diabetes. These unproven facts drag our interest to compare serum leptin levels and lipid profile both in obese subjects along with diabetic patients due to obesity.
Materials and Methods
Present case control study was conducted in the Department of Biochemistry & Medicine, Shri Ram Murti Smarak Institute of Medical Science, Bareilly, U.P. We analyzed total 90 samples out of which were divided into three groups. The first group had 25 adult non-obese persons as control, second group had 25 adult obese persons without DM type 2 and third group had 40 adult obese persons with DM Type 2.This study was intended to evaluate serum leptin levels in obese subject and obese type 2 diabetic subjects, so non obese healthy controls were selected to find out whether this parameter varies significantly in non-diabetic obese and obese diabetic group from healthy control. Type 2 diabetic patients were selected on the basis of clinical history and also according to the classification of American Diabetes Association classification [25] in which fasting plasma glucose concentration is more than 126 mg/dl. Prior approval was taken from the institutional ethical committee. Informed consent was obtained from all the subjects after explaining them about the aim and objective of the study. BMI was measured for each subject and proposed biochemical parameters were estimated in their blood samples. Obese subjects had a BMI equal or greater than 25 and normal subjects had a BMI less than 25 which was in accordance with the revised consensus Body Mass indices for Asian Indians [26]. The subjects chosen were not on any drug treatment during days of blood collection. Ages of the subjects were between 25-65 years. Patients with kidney failure, liver, cardiovascular disease, cancer and acute and chronic inflammatory and autoimmune diseases were excluded for the study.
Before collecting venous blood sample using standard venipuncture subjects were asked to have a fasting period of 12 hrs. The procedure was standardized and followed as per the guidelines of The National Committee for clinical laboratory standards (NCCLS) [27]. For the standardization blood was drawn in sitting position from antecubital vein. These samples were collected in two different vials, one plain vial for measuring the serum leptin and lipid profile, one sodium fluoride vial for measuring fasting plasma glucose. Blood was allowed to clot and was immediately centrifuged at 5000 rpm for 10 minutes. Serum was collected and stored immediately at -20ο C in the lab until assay performed. The quantitative estimation of leptin in human serum was done by competitive ELISA method using Elisa kit from Diagnostics Biochem Canada Inc. Plasma fasting glucose level was done by glucose oxidase/peroxidase method (ACCUREX, India). Total cholesterol was estimated by enzymatic end point cholesterol esterase-peroxidase method (ACCUREX, India). Triglycerides were measured by glycerol phosphate oxidase-peroxidase method (ACCUREX, India). HDL-C was estimated by direct enzymatic end point assay based on precipitation method (ERBA, Germany). LDL-C and VLDL were calculated using Friedewald's formula [28].
Statistical analysis
Data was processed using license excel software. Analysis was performed using SPSS version 20 for windows. Descriptive data were expressed as mean, standard deviation. Results were expressed as mean ± S.D and also using box plot. Independent t-test was used to compare the mean of various groups to find out any statistical significance. Differences were considered statistically significant at p<0.05. ANOVA analysis was done to compare the mean of each parameter. Correlation between serum leptin with other assed parameters was sought using the Pearson’s correlation. ROC analysis was done to find out the cut off value of leptin between normal and obese group and between normal and obese with type II diabetes group.
Results
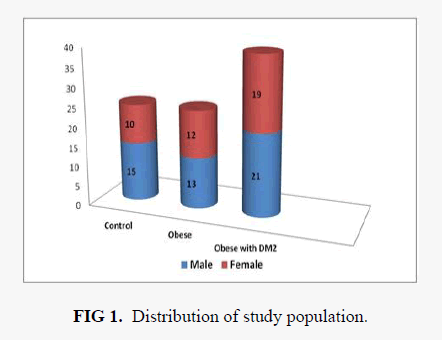
The demographic distribution of our study population is shown in FIG 1. In the obese type 2 diabetic group numbers of male patients were 21 and female patients were 19, whereas in obese without diabetic group the number of male subjects were 13 and female subjects were 12. Mean ± SD of age, BMI, FPG and lipid profile parameters with ANOVA analysis is shown in TABLE 1. The mean age of obese subjects were 49.8 years and for obese diabetic group was 47.4 years. The mean ± SD BMI of obese group was 31.9 ± 4.07 kg/m2 and for diabetic group were 29.98 ± 3.82 kg/m2. Significant variation of mean BMI was observed in both obese and obese with diabetes group when compared with healthy control. ANOVA analysis of total cholesterol showed no significant variation in all groups with 'p' value 0.267. Serum triglyceride and VLDL-C showed statistically significant variation between non diabetic obese with diabetic obese group. Mean HDL-C level showed statistically significant difference between control group and non-diabetic obese group when analyzed by Student’s’t’ test. Upon ANOVA analysis of LDL-C no significant association was observed.
| Parameters | Group-1 (Control) n=25 |
Group-2 (Obese without DM) n =25 |
Group-3 (Obese with type 2 DM) n=40 |
ANOVA p |
|---|---|---|---|---|
| Age (years) ? | 44.27 ±8.10 | 49.8 ±6.34 | 47.4 ±7.70 | <0.0001 |
| BMI (kg/m2) $ | 22.61 ±1.65 | 31.9 ±4.07 | 29.98 ±3.82 | <0.0001 |
| FPG(mg/dl) ? | 94.36 ±10.29 | 101.32 ±13.7 | 206.03 ±72.92 | <0.0001 |
| TC (mg/dl) | 175.42 ±33.67 | 169.20 ±32.54 | 188.95 ±64.58 | 0.267 |
| TG (mg/dl) * | 157.56 ±37.35 | 140.32 ±41.33 | 232.21 ±128.97 | <0.0001 |
| HDL-C (mg/dl) ? | 35.42 ±10.19 | 28.98 ±6.75 | 29.85 ±11.76 | 0.0496 |
| LDL-C (mg/dl) | 108.42 ±32.28 | 112.15 ±30.52 | 111.59 ±55.46 | 0.053 |
| VLDL-C (mg/dl) * | 31.52 ±7.48 | 28.07 ±22.64 | 46.44 ±25.80 | <0.0001 |
Table 1: Anthropometric and biochemical parameters in all groups
Values of leptin in obese, obese with DM type 2 and control group are shown in TABLE 2. Mean ± SD of serum leptin level in obese group was 37.73 ± 24.83 ng/ml and in diabetic obese group was 37.73 ± 24.83 ng/ml. In control group serum leptin level was 16.60 ± 13.51 ng/ml. There was significant difference was observed in mean leptin level between obese group and control group (p<0.0001) and also between obese with type 2 diabetic group and control group (p<0.0001) when compared by Student’s’t’ test. There was no statistical significance observed in respect to serum leptin level between obese and diabetic obese group when compared by Student’s’t’ test (p=0.44). One way ANOVA analysis between control group, obese group and obese diabetic group showed a significant variation of serum leptin between each group with 'p' value 0.00 and F value 8.427501 (TABLE 2).
| Obese without DM group | Obese with DM group | Control group |
|---|---|---|
| Serum | Serum | Serum |
| 33.26±18.54 ng/ml *vs. Obese with type 2 DM 'p' =0.44 (NS) *vs. control 'p' <0.0001 |
37.73±24.83 ng/ml *vs. Obese without type 2 DM 'p' =0.44 (NS) *vs. control’ 'p' <0.0001 |
16.60±13.51 ng/ml |
| ANOVA analysis of leptin in Obese, Obese with DM type 2 and Control Groups | ||
| 'p' Value = 0.00, F value=8.427501, Fcrit= 3.101296 Between groups; SS= 7107.49, df=2, MS= 3553.745 Within groups; SS=36686.54, df=87, MS=421.6843 |
||
Table 2: Values of leptin (ng/ml) in Obese, Obese with DM type 2 and Control Groups
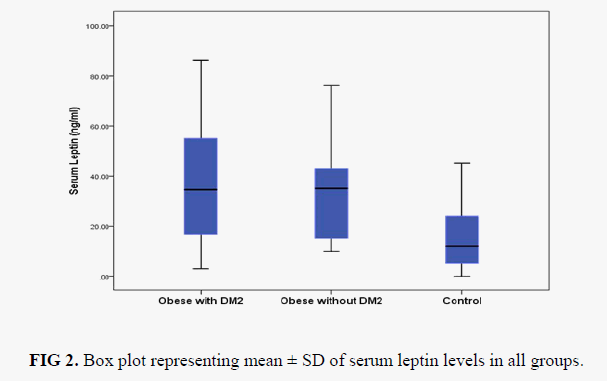
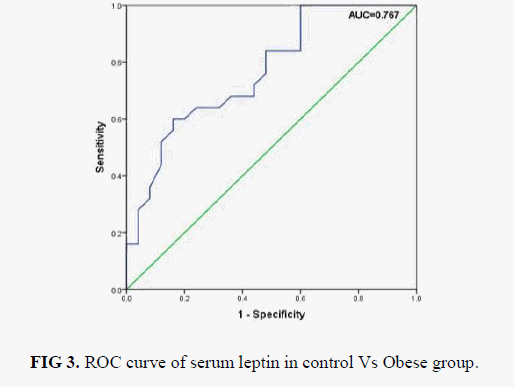
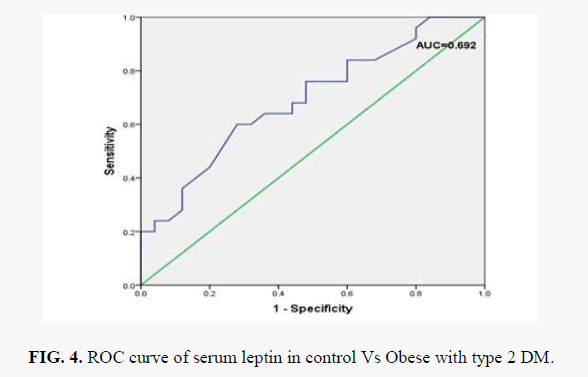
Box plot analysis of serum leptin level in control, obese without diabetic and obese with diabetic is shown in FIG 2. Pearson's correlation analysis of serum leptin levels with other assayed parameters in obese group and obese with diabetic type 2 is shown in TABLE 3. We found that serum leptin is significantly positively associated with BMI both in obese group (p=0.516) and also in obese with diabetes type 2 group (r=0.431). No significant correlation was observed with other assayed parameters (FPG, TC, TG, LDL-C, HDL-C and VLDL-C) with serum leptin in both the groups. ROC analysis of serum leptin in control vs. obese group is shown in FIG. 3. and we found best cut off value for serum leptin was 21.5 ng/ml with 68% sensitivity and 64 % specificity. FIG. 4 shows ROC analysis of serum leptin in control vs. obese with diabetes type 2 group and we found best cut off value for leptin was 20.5 ng/ml wit 64% sensitivity and 64% specificity.
| Serum leptin concentration (ng/ml) | |||
|---|---|---|---|
| Groups | Male (Mean±SD) |
Female (Mean±SD) |
‘p’ value |
| Control subjects | 12.89 ± 14.9 | 21.15 ± 10.66 | <0.0001 |
| Obese subjects | 23.26 ± 18.83 | 44.08 ± 10.83 | <0.0001 |
| Obese with type 2 DM | 33.38 ± 29.55 | 42.55 ± 17.38 | 0.12 |
Table 3: Gender wise distribution of serum leptin in Obese, Obese with DM type 2 and Control Groups
Discussion
Leptin is released from adipocytes in response to increased fat content is involved in the maintenance of fat content of the body. It does so by increasing the fat mobilization from the adipose tissue, fatty acid oxidation by the liver and by decreasing the appetite [29,30]. In our study, as expected, we found significantly higher leptin level in obese subjects (33.26 ± 18.54 ng/ml), in comparison with healthy subjects (16.60 ± 13.51 ng/ml). Leptin level also significantly positively correlated with BMI. Our finding was in accordance with the study conducted by Masoud Y Al Maskari et al. who also reported significantly high leptin level in obese subjects. (Obese subjects; 34.78+13.96 ng/ml and the control non-obese subjects; 10.6 ± 4.2 ng/ml) [31]. Considine RV et al. observed four time higher serum leptin level in obese subjects in comparison with non-obese subjects and they also found significant association of serum leptin with BMI [32]. Our results contradict the findings of Gilberto Jorge da Paz-Filho et al. who reported significant decrease leptin production by the adipose tissue in obese subjects when obesity is associated with advanced stages of metabolic syndrome [33]. A most likely explanation for this increase will be as follows. As the fat content is increased due to low level of hormone sensitive lipase in our obese group, leptin level will increase. Increased leptin level will however not be able to increase the fat mobilization, due to limited amount of hormone sensitive lipase, which is already fully activated. Thus the fat content will continue to increase with parallel increase in serum leptin level [34]. We also observed elevated levels of serum leptin in obese with diabetes group (Mean ± SD; 37.73 ± 24.83 ng/ml) which was statistically significant (p<0.0001) when compared with healthy control. Our findings were in accordance with the result obtained by Arleta et al. who found that concentration of leptin in DM2 patients was significantly higher than in healthy control (p<0.01) [35]. They concluded that leptin may participate in the complex pathogenesis of DM2 and be a predictor of the development of this disease. Our findings contradict the study conducted by Rajeev L et al. who reported significant decrease level of serum leptin in diabetic patients (Mean ± SD; 29.3 ± 19.3 ng/m) when compared with non-diabetic subjects (34.8 ± 21.4 ng/ml) [36].
Serum leptin level was not significantly different ('p'=0.44) in obese group with type 2 DM (37.73 ± 24.83 ng/ml) in comparison to obese group without DM type 2 (33.26 ± 18.54 ng/ml). These results show that the serum leptin level is associated with obesity only and not with diabetes. Such observation was in agreement with the study conducted by Tatti et al. and Morteza et al [37, 38].
In this study in respect with gender we found that females had higher leptin levels than males (TABLE 3) in all groups, which was statistically significant (p<0.0001) in controls as well as in obese subjects. But this significance was not observed in obese diabetic group (p=0.12). This finding was also in accordance with study conducted by Rajeev L et al and Panarotto D et al [36, 39] who also observed significant increased levels of serum leptin in female patients as compared to males.
The levels of serum TGs and VLDL-C were observed to be significantly higher in obese with type 2 DM patients than normal healthy controls which was in accordance to the study findings of Zavaroni et.al [40]. In our study, no significant difference in serum TG level between normal and obese group was observed which contradict most of the studies [41,42]. In respect to total cholesterol and LDL-C no significant change was observed in all these groups. HDL-C levels were significantly decreased in obese non-diabetic group in comparison with control group. Significant positive correlation was observed between serum leptin with BMI both in obese group (p=0.516) and obese with DM2 group (p=0.431) [TABLE 4]. Different results obtained in our study in respect to lipid profile might be due to differences in patient's characteristics, duration and extent of obesity and insulin resistance, metabolic alteration of other hormones, and possible effects of intermediate metabolism. ROC curve of serum leptin in control Vs Obese with type 2 DM is shown in FIG 4. Differences in the duration of the studies, sample size, geographical variation included in the studies may be other possible factors which are responsible of this inconsistency.
Parameters |
Obese without DM2 (n=25) |
Obese with DM2 (n=40) | ||
|---|---|---|---|---|
| 'r' value | 'p' value | 'r' value | 'p' value | |
| BMI (kg/m2) | 0.516 | 0.000 | 0.431 | 0.000 |
| FPG(mg/dl) | 0.142 | 0.706 | -0.128 | 0.431 |
| TC (mg/dl) | 0.341 | 0.095 | -0.217 | 0.179 |
| TG (mg/dl) | 0.581 | 0.000 | 0.142 | 0.381 |
| HDL-C (mg/dl) | 0.217 | 0.298 | 0.182 | 0.262 |
| LDL-C (mg/dl) | 0.300 | 0.145 | 0.197 | 0.224 |
| VLDL-C (mg/dl) | 0.341 | 0.095 | 0.142 | 0.381 |
Table 4: Correlation analysis of leptin concentration with various assayed parameters, in Obese without type 2 DM group and in Obese with type 2 DM group
Conclusion
In this study we reported that obese subjects and obese with type 2 diabetes mellitus patients have similar serum leptin levels. This study finding led to the conclusion that the increase in serum leptin level is associated with obesity but no further alteration is seen in obese subjects who developed type 2 diabetes mellitus due to obesity. To establish this unproven fact, prospective, multicentric study with larger sample size could obtain wider insight.
References
- World Health Organization. World Health Organization fact sheet: obesity and overweight. 2009.
- Agha M, Agha R. The rising prevalence of obesity: part A: impact on public health. Int J Surg Oncol. 2017; 2: e17.
- Eckel R, Grundy S. Insensitivity to insulin and obesity: the underlying cause. Diabetes Voice. 2006; 51: 28-30.
- Shetty P. India's diabetes time bomb. Nature. 2012; 485: S14-S16.
- Schinner S, Scherbaum WA, Bornstein SR, et al. Molecular mechanisms of insulin resistance.
Diabet Med. 2005; 22: 674-82. - Flier JS, Flier EM. Biology of Obesity: Obesity related health disorder & complications. In: Mc Graw Hill, Harrison?s Principle of Internal Medicine, (18th Edn): 2014; 1: 622-34.
- Ginter E, Simko V. Diabetes type 2 pandemic in 21st century. Bratisl Lek Listy. 2010; 111: 134-7.
- Rondinone CM. Adipocyte-derived hormones, cytokines, and mediators. Endocrine. 2006; 29: 81-90.
- Zhang Y, Proenca R, Maffei M, et al. Positional cloning of the mouse obese gene and its human homologue. Nature. 1994; 372: 425-32.
- Zhang Y, Proenca R, Maffei M, et al. Positional cloning of the mouse obese gene and its human homologue. Nature. 1995; 374: 479.
- Margetic S, Gazzola C, Pegg GG, et al. Leptin: a review of its peripheral actions and interactions. Int J Obes. 2002; 26: 1407-33.
- Osegbe I, Okpara H, Azinge E. Relationship between serum leptin and insulin resistance among obese Nigerian women. Ann Afr Med. 2016; 15: 14-19.
- Goralski KB, McCarthy TC, Hanniman EA, et al. Chemerin, a novel adipokine that regulates adipogenesis and adipocyte metabolism. J Biol Chem. 2007; 282: 28175-88.
- Boden G, Chen X, Mozzoli M, et al. Effect of fasting on serum leptin in normal human subjects. J Clin Endocrinol Metab. 1996; 81: 3419-23.
- Pelleymounter MA, Cullen MJ, Baker MB, et al. Effects of the obese gene product on body weight regulation in ob/ob mice. Science. 1995; 269: 540-3.
- Neuparth MJ, Proença JB, Santos-Silva A, et al. Adipokines, oxidized low-density lipoprotein, and C-reactive protein levels in lean, overweight, and obese portuguese patients with type 2 diabetes. ISRN obesity. 2013: 7.
- Wannamethee SG, Lowe GD, Rumley A, et al. Adipokines and risk of type 2 diabetes in older men. Diabetes care. 2007; 30: 1200-5.
- Welsh P, Murray HM, Buckley BM, et al. Leptin predicts diabetes but not cardiovascular disease: results from a large prospective study in an elderly population. Diabetes Care. 2009; 32: 308-10.
- Mcneely MJ, Boyko EJ, Weigle DS, et al. Association between baseline plasma leptin levels and subsequent development of diabetes in Japanese Americans. Diabetes Care. 1999; 22: 65-70.
- Haffner SM, Stern MP, Miettinen H, et al. Leptin concentrations in diabetic and nondiabetic Mexican-Americans. Diabetes. 1996; 45: 822-4.
- Sumner AE, Falkner B, Kushner H, et al. Relationship of leptin concentration to gender, menopause, age, diabetes, and fat mass in African Americans. Obesity research. 1998; 6: 128-33.
- Maahs DM, Hamman RF, D'Agostino Jr R, et al. The association between adiponectin/leptin ratio and diabetes type: the SEARCH for Diabetes in Youth Study. J Pediatr. 2009; 155: 133-5.
- Schmidt MI, Duncan BB, Vigo A, et al. Leptin and incident type 2 diabetes: risk or protection? Diabetologia. 2006; 49: 2086-96.
- Sun Q, Van Dam RM, Meigs JB, et al. Leptin and soluble leptin receptor levels in plasma and risk of type 2 diabetes in U.S. women: A prospective study. Diabetes. 2010; 59: 611-8.
- Burtis CA, Ashwood ER, Bruns DE. Tietz textbook of clinical chemistry and molecular diagnostics; Elsevier (5th edn). Philadelphia,PA: 2012: 1431
- Aziz N, Kallur SD, Nirmalan PK. Implications of the Revised Consensus Body Mass Indices for Asian Indians on Clinical Obstetric Practice. J Clin Diagn Res. 2014; 8: OC01-OC03.
- Wayne A. NCCLS document GP17. National Committee for Clinical Laboratory Standards. PA: National Committee for Clinical Laboratory. 1996.
- Friedewald WT, Levy RI, Fredrickson DS. Estimation of the concentration of low-density lipoprotein cholesterol in plasma, without use of the preparative ultracentrifuge. Clin Chem. 1972; 18: 499-502.
- Park HK, Ahima RS. Physiology of leptin: energy homeostasis, neuroendocrine function and metabolism. Metabolism. 2015; 64: 24-34.
- Elmquist JK, Ahima RS, Elias CS. Leptin activates distinct projections from the dorsomedial and ventromedial hypothalamic nuclei. Proc Natl Acad Sci USA. 1998; 741-8.
- Masoud Y Al Maskari, Adel A Alnaqdy. Correlation between Serum Leptin Levels, Body Mass Index and Obesity in Omanis. Sultan Qaboos Univ Med J. 2006; 6: 27-31.
- Considine RV, Sinha MK, Heiman M, et al. Serum immunoreactive-leptin concentrations in normal-weight and obese humans. N Engl J Med. 1996; 334: 292-5.
- Da PGJ, Alexei V, Lacerda SH, et al. Decrease in leptin production by the adipose tissue in obesity associated with severe metabolic syndrome. Arq Bras Endocrinol Metab. 2009; 53: 1088-95.
- Considine RV, Sinha MK, Heiman ML, et.al. Serum immunoreactive-leptin concentrations in normal weight and obese humans. N Engl J Med.1996; 334: 292-5.
- Arleta MJ, Burska A, Beata MM, et al. Serum leptin concentration in patients with type 2 diabetes. Curr. Issues Pharm. Med. Sci. 2015; 28: 236-41.
- Lohokare R, Bansal A, Kothari V, et al. Study of serum leptin levels in patients with type 2 diabetes mellitus at a tertiary care centre of central India. 2016; 4: 798-802.
- Tatti P, Masselli L, Buonanno A, et al. Leptin levels in diabetic and nondiabetic subjects. Endocrine. 2001; 15: 305-8.
- Morteza A, Nakhjavani M, Asgarani F. The lost correlation between leptin and CRP in type 2 diabetes. Eur Cytokine Netw. 2013; 24: 53-9.
- Panarotto D, Ardilouze JL, Tessier D, et al. The degree of hyperinsulinemia and impaired glucose tolerance predicts plasma leptin concentrations in women only: a new exploratory paradigm. Metab. Clin. Exp. 2000; 49: 1055-62.
- Zavaroni I, Dall'Aglio E, Alpi O, et al. Evidence for an independent relationship between plasma insulin and concentration of high density lipoprotein cholesterol and triglyceride. Atherosclerosis. 1985; 55: 259-66.
- Katsuki A, Sumida Y, Urakawa H, et al. Increased Visceral Fat and Serum Levels of Triglyceride Are Associated With Insulin Resistance in Japanese Metabolically Obese, Normal Weight Subjects With Normal Glucose Tolerance. Diabetes Care. 2003; 26: 2341-4.
- Nogaroto V, Rodrigues MR, Vicari MR, et al. High postprandial triglycerides serum levels: is obesity a good predictor? An. Acad. Bras. Ciênc. 2015; 87: 437-45.
